| Param | Original file | Final file |
|---|---|---|
| Filename | modeM0/AS1A10_071T52_9000004480_31005cztM0_level2.evt | modeM0/AS1A10_071T52_9000004480_31005cztM0_level2_quad_clean.evt |
| Size (bytes) | 555,433,920 | 98,879,040 |
| Size | 529.7 MB | 94.3 MB |
| Events in quadrant A | 3,283,953 | 665,004 |
| Events in quadrant B | 5,243,083 | 673,855 |
| Events in quadrant C | 3,964,356 | 617,240 |
| Events in quadrant D | 3,909,104 | 604,131 |
| Mode M0 | |||
|---|---|---|---|
| Quadrant | BADHDUFLAG | Total packets | Discarded packets |
| A | 0 | 13517 | 2 |
| B | 0 | 19518 | 2 |
| C | 0 | 15787 | 2 |
| D | 0 | 15649 | 2 |
| Mode M9 | |||
|---|---|---|---|
| Quadrant | BADHDUFLAG | Total packets | Discarded packets |
| A | 0 | 16 | 0 |
| B | 0 | 17 | 0 |
| C | 0 | 17 | 0 |
| D | 0 | 17 | 0 |
| Mode SS | |||
|---|---|---|---|
| Quadrant | BADHDUFLAG | Total packets | Discarded packets |
| A | 0 | 128 | 0 |
| B | 0 | 128 | 0 |
| C | 0 | 128 | 0 |
| D | 0 | 128 | 0 |
| Quadrant | Total seconds | Saturated seconds | Saturation percentage |
|---|---|---|---|
| A | 6215 | 57 | 0.917136% |
| B | 6215 | 137 | 2.204344% |
| C | 6215 | 267 | 4.296058% |
| D | 6215 | 115 | 1.850362% |
Noise dominated data is calculated using 1-second bins in cleaned event files. If a bin has >2000 counts, and if more than 50% of those come from <1% of pixels, then it is considered to be noise-dominated and hence unusable.
| Quadrant | # 1 sec bins | Bins with >0 counts | Bins with >2000 counts | High rate bins dominated by noise | Noise dominated (total time) | Noise dominated (detector-on time) | Marked lightcurve |
|---|---|---|---|---|---|---|---|
| A | 7585 | 6216 | 0 | 0 | 0.00% | 0.00% |  |
| B | 7585 | 6215 | 10 | 10 | 0.13% | 0.16% |  |
| C | 7585 | 6215 | 131 | 131 | 1.73% | 2.11% |  |
| D | 7585 | 6216 | 102 | 102 | 1.34% | 1.64% |  |
Top three noisy pixels from each quadrant. If the there are fewer than three noisy pixels in the level2.evt file, extra rows are filled as -1
| Pixel properties | Quadrant properties | ||||||
|---|---|---|---|---|---|---|---|
| Quadrant | DetID | PixID | Counts | Sigma | Mean | Median | Sigma |
| A | 13 | 254 | 12504 | 69.3 | 849 | 835 | 168.4 |
| A | 3 | 137 | 8072 | 42.98 | 849 | 835 | 168.4 |
| A | 0 | 226 | 7066 | 37.01 | 849 | 835 | 168.4 |
| B | 6 | 159 | 1797420 | 11373.23 | 848 | 828 | 158.0 |
| B | 0 | 190 | 38318 | 237.33 | 848 | 828 | 158.0 |
| B | 0 | 230 | 30919 | 190.49 | 848 | 828 | 158.0 |
| C | 0 | 10 | 644724 | 3464.62 | 799 | 807 | 185.9 |
| C | 14 | 238 | 132387 | 707.97 | 799 | 807 | 185.9 |
| C | 3 | 233 | 31258 | 163.84 | 799 | 807 | 185.9 |
| D | 8 | 195 | 538844 | 2852.82 | 803 | 783 | 188.6 |
| D | 2 | 250 | 211616 | 1117.85 | 803 | 783 | 188.6 |
| D | 12 | 218 | 62671 | 328.13 | 803 | 783 | 188.6 |
Histogram calculated using DETX and DETY for each event in the final _common_clean file
| Quadrant A |  |
 |
Quadrant B |
|---|---|---|---|
| Quadrant D |  |
 |
Quadrant C |
| Plot type | Count rate plots | Images |
|---|---|---|
| Comparison with Poisson distribution Blue bars denote a histogram of data divided into 1 sec bins. Red curve is a Poisson curve with rate = median count rate of data. |
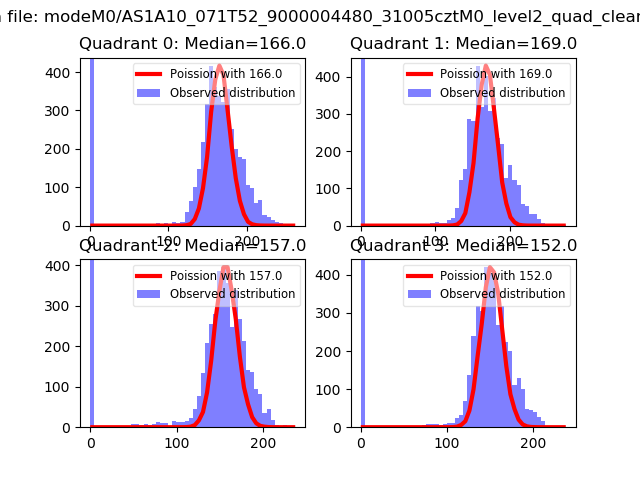 |
 |
| Quadrant-wise count rates Data is divided into 100 sec bins |
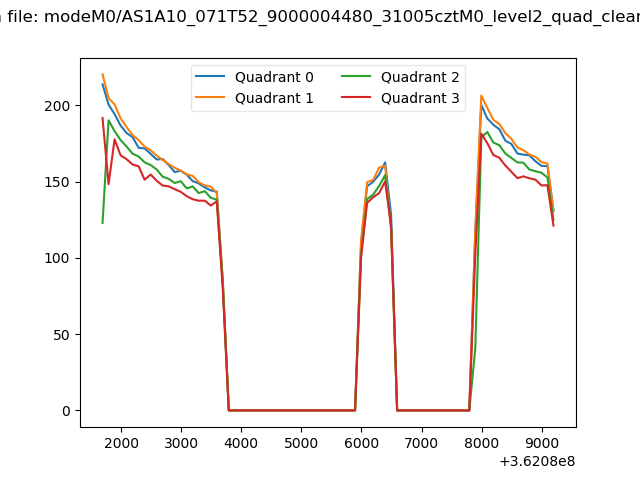 |
|
| Module-wise count rates for Quadrant A Data is divided into 100 sec bins |
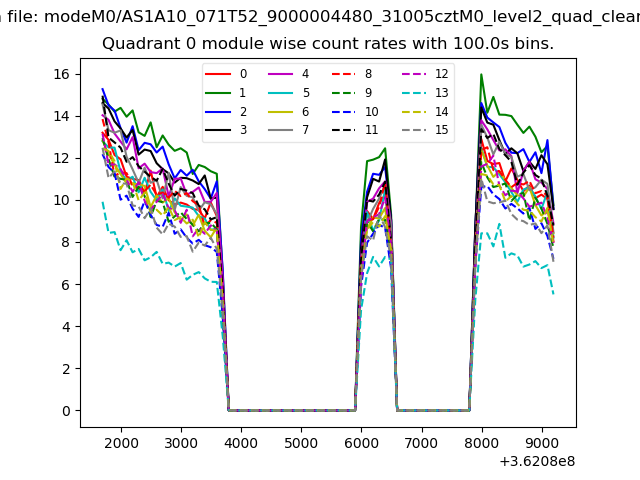 |
 |
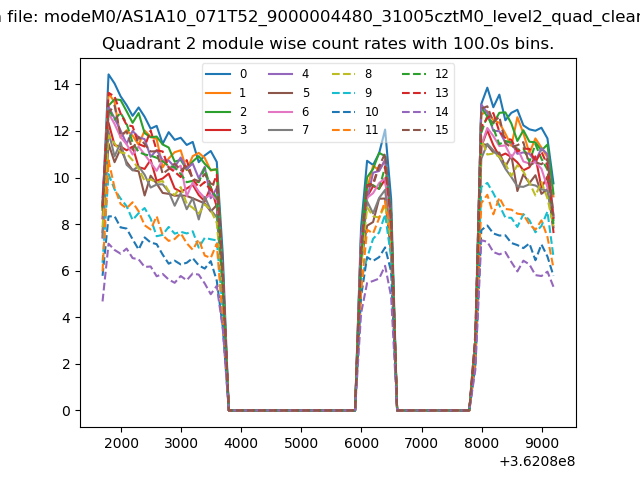
| Module-wise count rates for Quadrant B Data is divided into 100 sec bins |
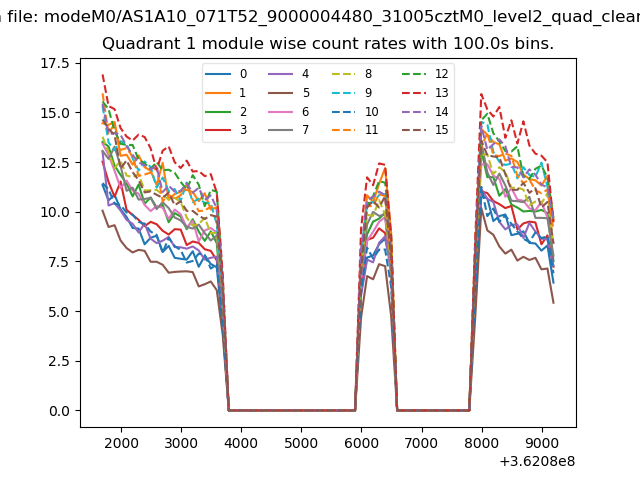 |
 |
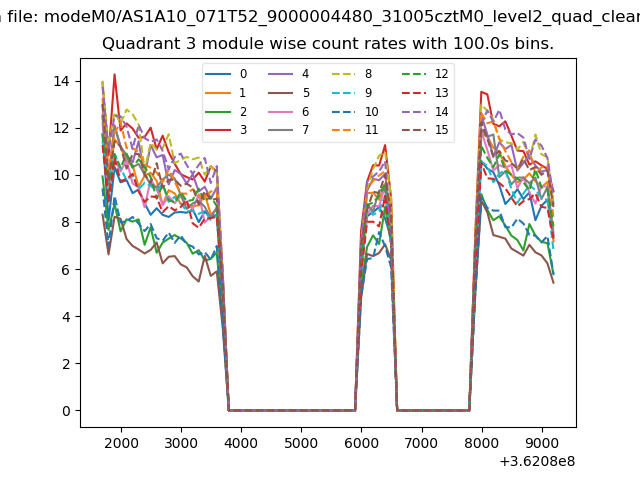
| Module-wise count rates for Quadrant C Data is divided into 100 sec bins |
 |
 |
| Module-wise count rates for Quadrant D Data is divided into 100 sec bins |
 |
 |
| Parameter | Plot |
|---|---|
| CZT HV Monitor | 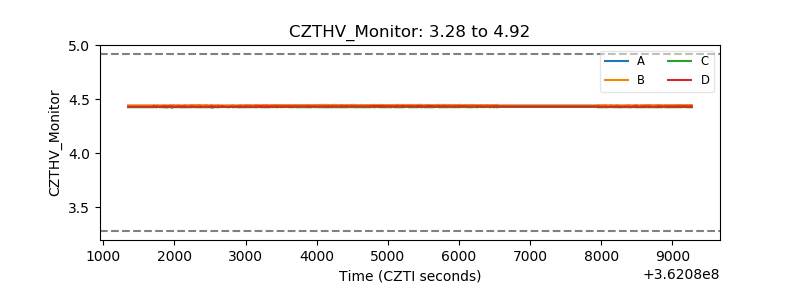 |
| D_VDD |  |
| Temperature 1 |  |
| Veto HV Monitor | 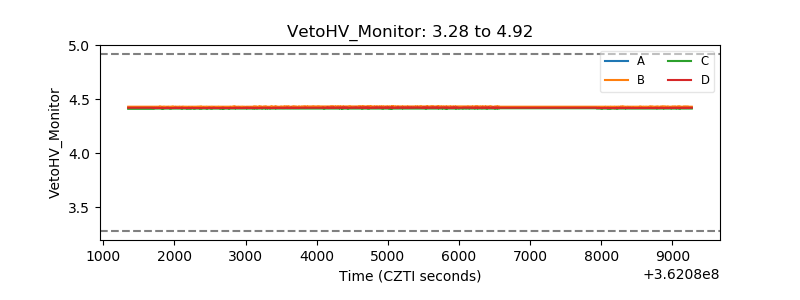 |
| Veto LLD |  |
| Alpha Counter | 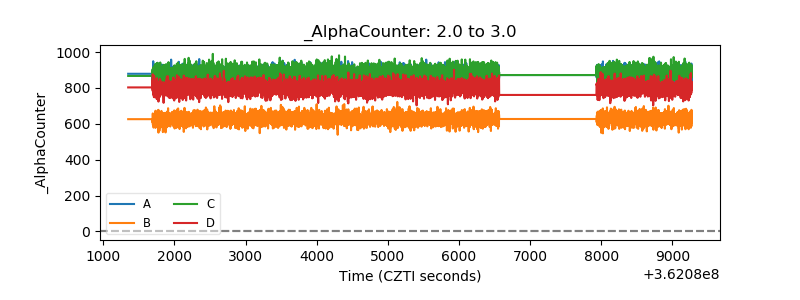 |
| _CPM_Rate | 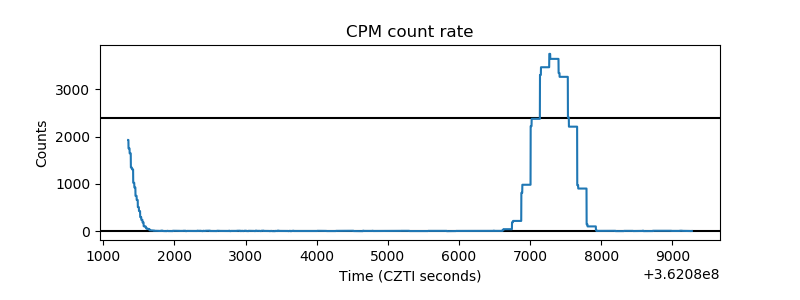 |
| CZT Counter |  |
| +2.5 Volts monitor |  |
| +5 Volts monitor |  |
| _ROLL_ROT | 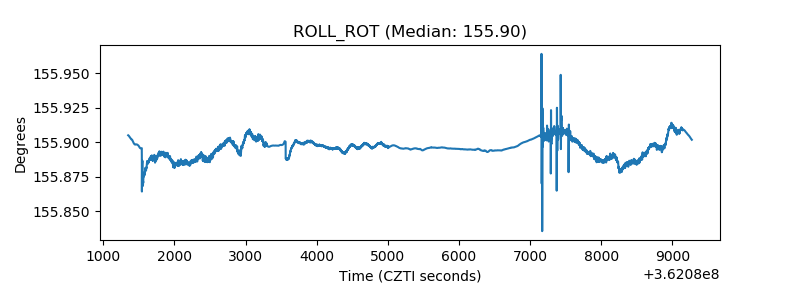 |
| _Roll_DEC | 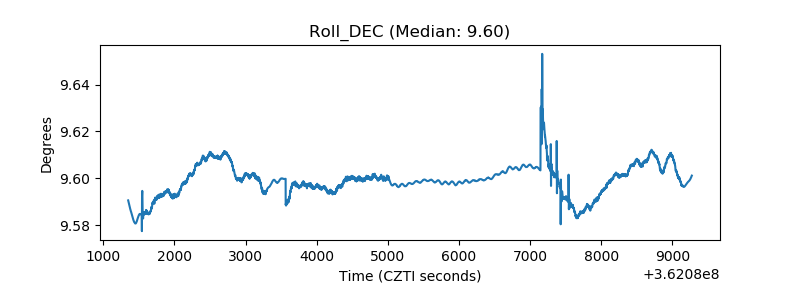 |
| _Roll_RA |  |
| Veto Counter | 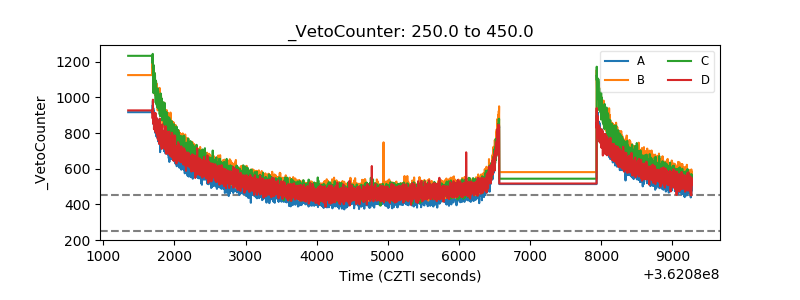 |