| Param | Original file | Final file |
|---|---|---|
| Filename | modeM0/AS1A10_071T52_9000004480_31007cztM0_level2.evt | modeM0/AS1A10_071T52_9000004480_31007cztM0_level2_quad_clean.evt |
| Size (bytes) | 548,153,280 | 84,329,280 |
| Size | 522.8 MB | 80.4 MB |
| Events in quadrant A | 3,155,140 | 553,261 |
| Events in quadrant B | 5,124,698 | 560,987 |
| Events in quadrant C | 3,940,215 | 509,256 |
| Events in quadrant D | 3,960,787 | 496,944 |
| Mode M0 | |||
|---|---|---|---|
| Quadrant | BADHDUFLAG | Total packets | Discarded packets |
| A | 0 | 13052 | 2 |
| B | 0 | 19237 | 2 |
| C | 0 | 15560 | 2 |
| D | 0 | 15676 | 2 |
| Mode M9 | |||
|---|---|---|---|
| Quadrant | BADHDUFLAG | Total packets | Discarded packets |
| A | 0 | 19 | 0 |
| B | 0 | 20 | 0 |
| C | 0 | 20 | 0 |
| D | 0 | 20 | 0 |
| Mode SS | |||
|---|---|---|---|
| Quadrant | BADHDUFLAG | Total packets | Discarded packets |
| A | 0 | 126 | 0 |
| B | 0 | 126 | 0 |
| C | 0 | 126 | 0 |
| D | 0 | 126 | 0 |
| Quadrant | Total seconds | Saturated seconds | Saturation percentage |
|---|---|---|---|
| A | 6204 | 22 | 0.354610% |
| B | 6204 | 91 | 1.466796% |
| C | 6204 | 284 | 4.577692% |
| D | 6204 | 196 | 3.159252% |
Noise dominated data is calculated using 1-second bins in cleaned event files. If a bin has >2000 counts, and if more than 50% of those come from <1% of pixels, then it is considered to be noise-dominated and hence unusable.
| Quadrant | # 1 sec bins | Bins with >0 counts | Bins with >2000 counts | High rate bins dominated by noise | Noise dominated (total time) | Noise dominated (detector-on time) | Marked lightcurve |
|---|---|---|---|---|---|---|---|
| A | 7504 | 6205 | 0 | 0 | 0.00% | 0.00% | 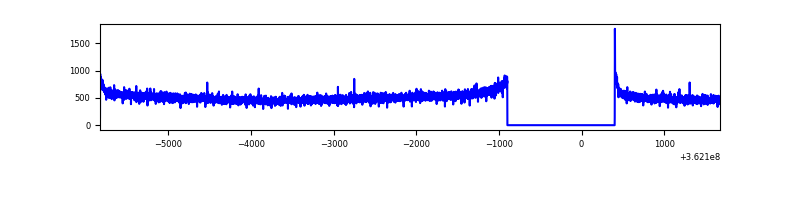 |
| B | 7504 | 6205 | 4 | 4 | 0.05% | 0.06% | 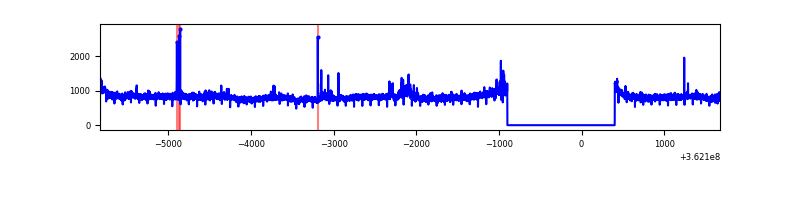 |
| C | 7504 | 6205 | 162 | 162 | 2.16% | 2.61% | 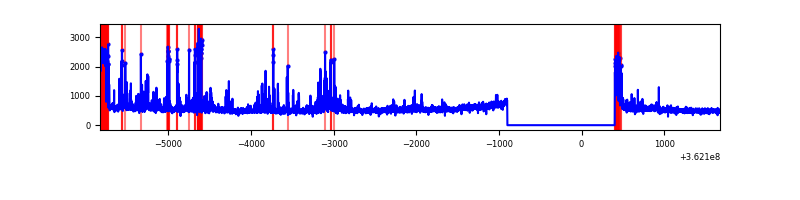 |
| D | 7504 | 6205 | 195 | 195 | 2.60% | 3.14% | 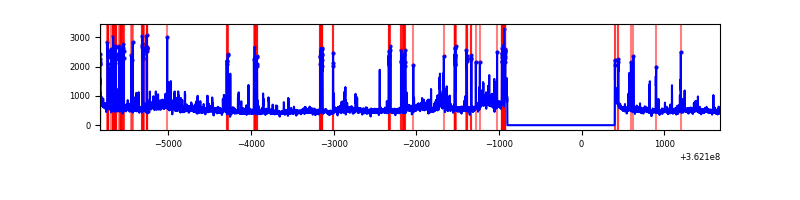 |
Top three noisy pixels from each quadrant. If the there are fewer than three noisy pixels in the level2.evt file, extra rows are filled as -1
| Pixel properties | Quadrant properties | ||||||
|---|---|---|---|---|---|---|---|
| Quadrant | DetID | PixID | Counts | Sigma | Mean | Median | Sigma |
| A | 13 | 254 | 11927 | 67.96 | 817 | 805 | 163.7 |
| A | 3 | 137 | 7842 | 43.0 | 817 | 805 | 163.7 |
| A | 0 | 226 | 7118 | 38.57 | 817 | 805 | 163.7 |
| B | 6 | 159 | 1795420 | 11621.88 | 816 | 798 | 154.4 |
| B | 0 | 230 | 49817 | 317.44 | 816 | 798 | 154.4 |
| B | 0 | 190 | 41101 | 261.0 | 816 | 798 | 154.4 |
| C | 0 | 10 | 786279 | 4403.16 | 764 | 773 | 178.4 |
| C | 14 | 238 | 125568 | 699.54 | 764 | 773 | 178.4 |
| C | 9 | 54 | 14828 | 78.79 | 764 | 773 | 178.4 |
| D | 8 | 195 | 793783 | 4337.84 | 766 | 748 | 182.8 |
| D | 6 | 219 | 85069 | 461.23 | 766 | 748 | 182.8 |
| D | 13 | 174 | 49388 | 266.06 | 766 | 748 | 182.8 |
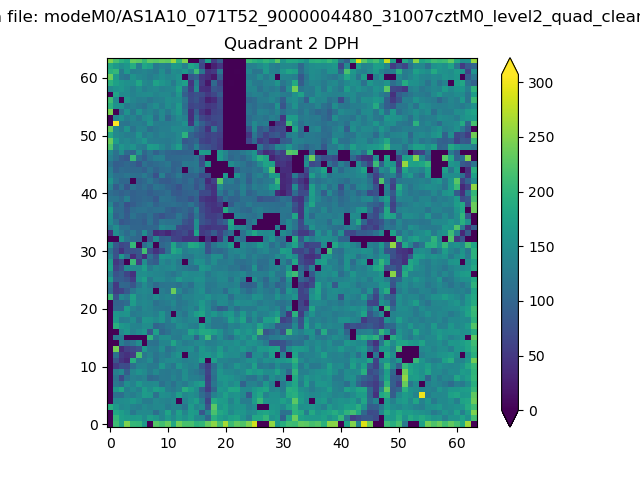
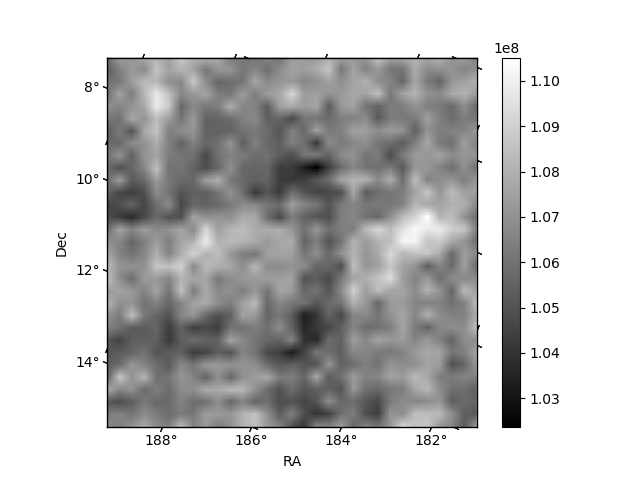
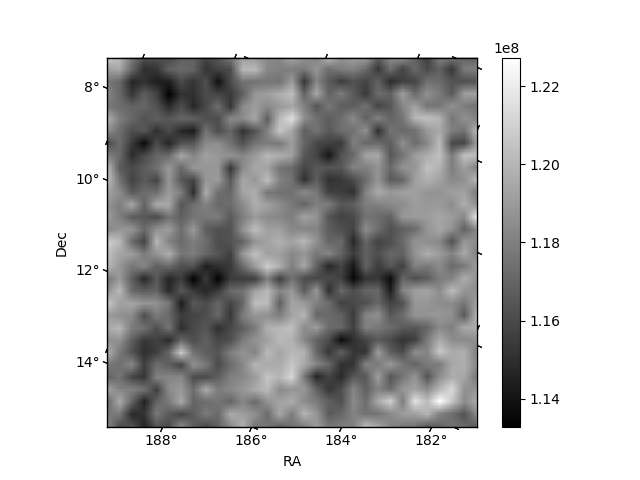
Histogram calculated using DETX and DETY for each event in the final _common_clean file
| Quadrant A |  |
 |
Quadrant B |
|---|---|---|---|
| Quadrant D | 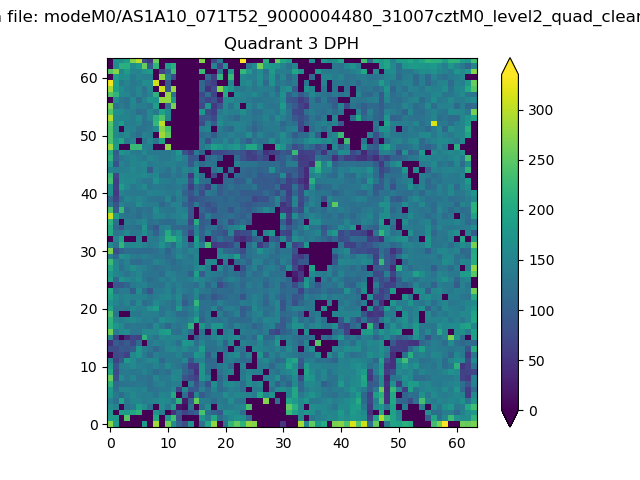 |
 |
Quadrant C |
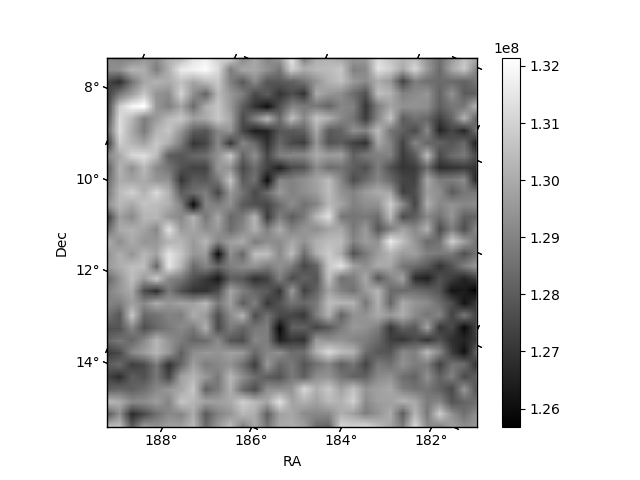
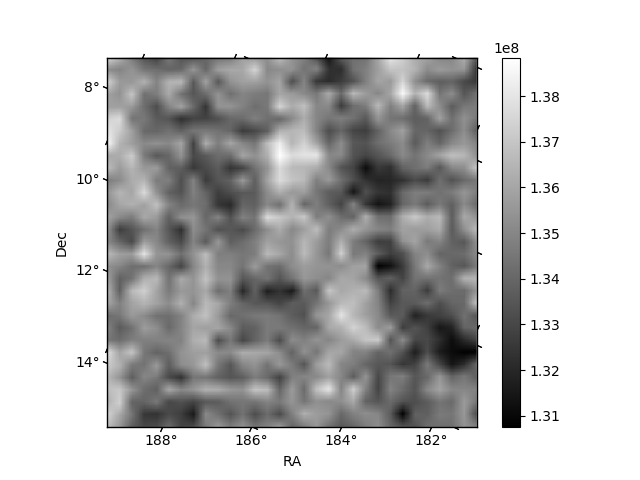
| Plot type | Count rate plots | Images |
|---|---|---|
| Comparison with Poisson distribution Blue bars denote a histogram of data divided into 1 sec bins. Red curve is a Poisson curve with rate = median count rate of data. |
 |
 |
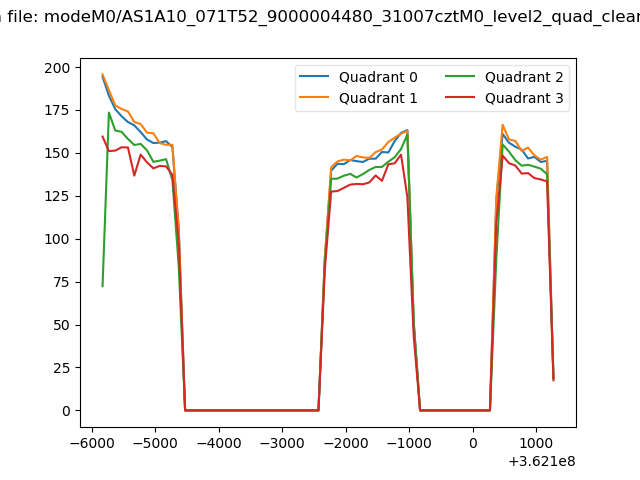
| Quadrant-wise count rates Data is divided into 100 sec bins |
 |
|
| Module-wise count rates for Quadrant A Data is divided into 100 sec bins |
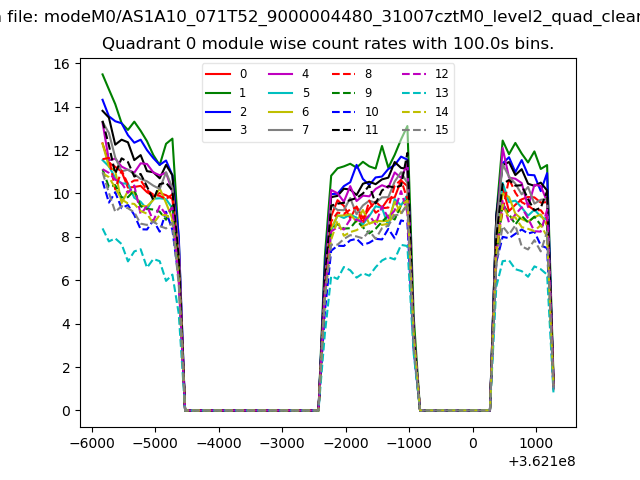 |
 |
| Module-wise count rates for Quadrant B Data is divided into 100 sec bins |
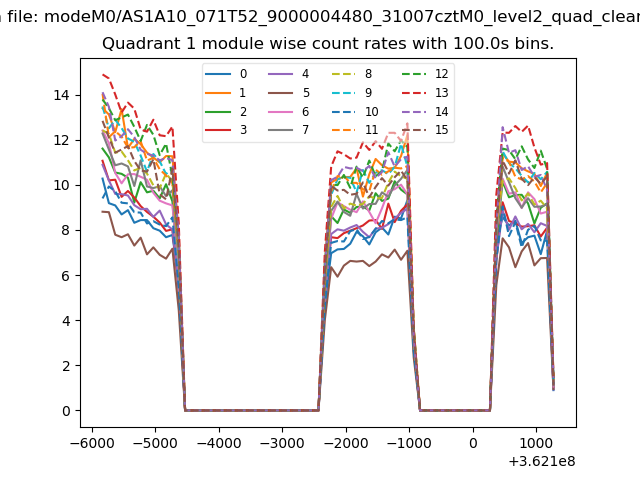 |
 |
| Module-wise count rates for Quadrant C Data is divided into 100 sec bins |
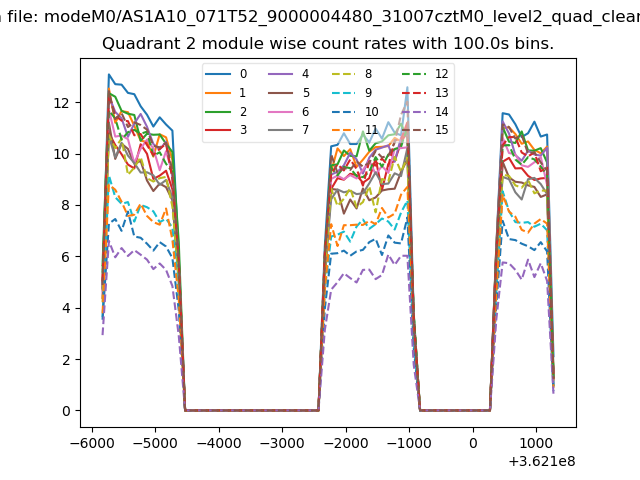 |
 |
| Module-wise count rates for Quadrant D Data is divided into 100 sec bins |
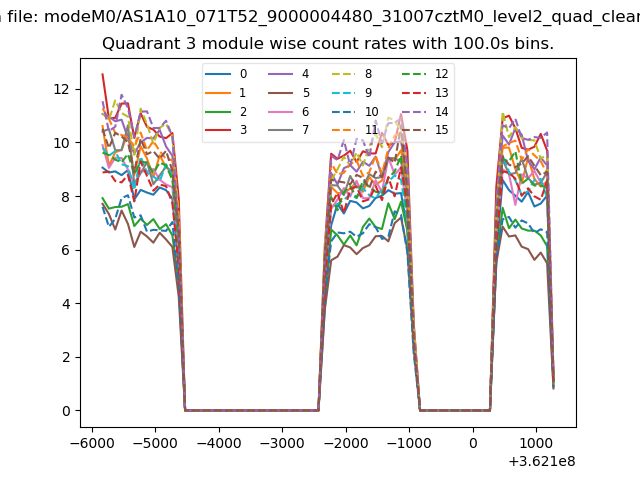 |
 |
| Parameter | Plot |
|---|---|
| CZT HV Monitor |  |
| D_VDD | 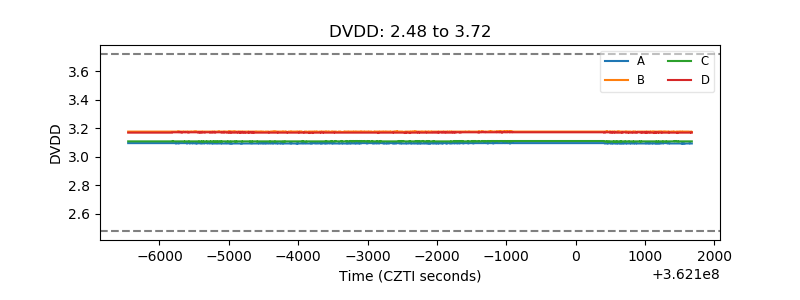 |
| Temperature 1 | 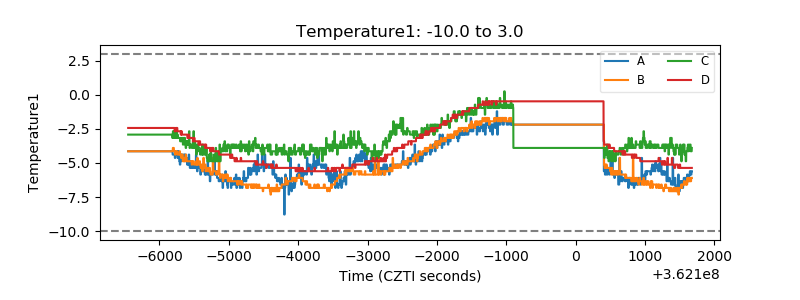 |
| Veto HV Monitor | 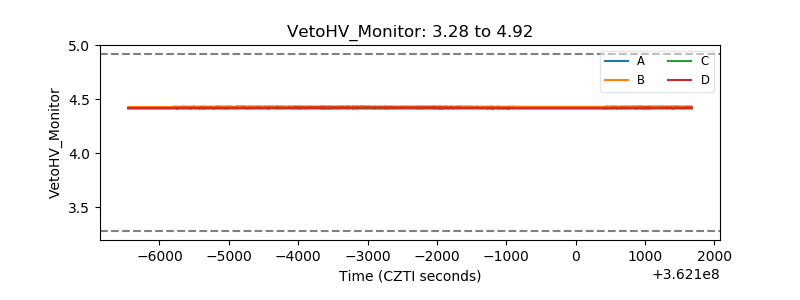 |
| Veto LLD | 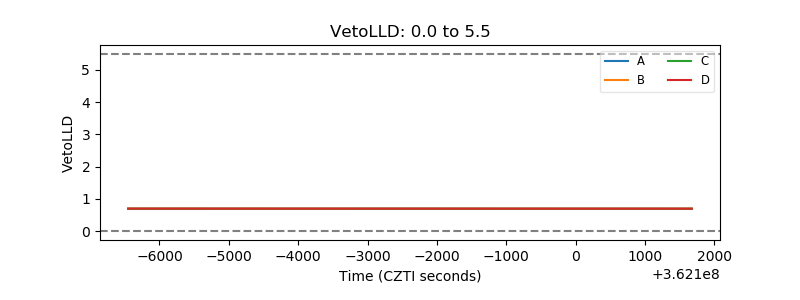 |
| Alpha Counter | 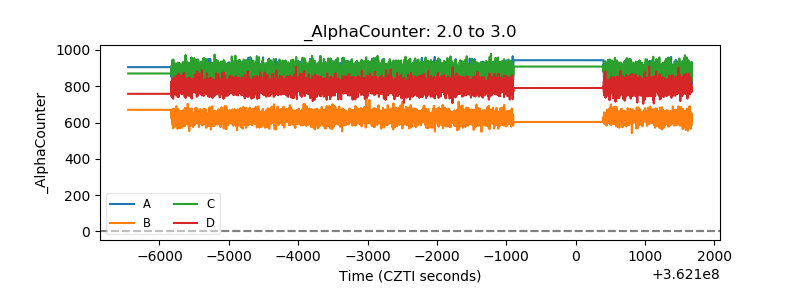 |
| _CPM_Rate | 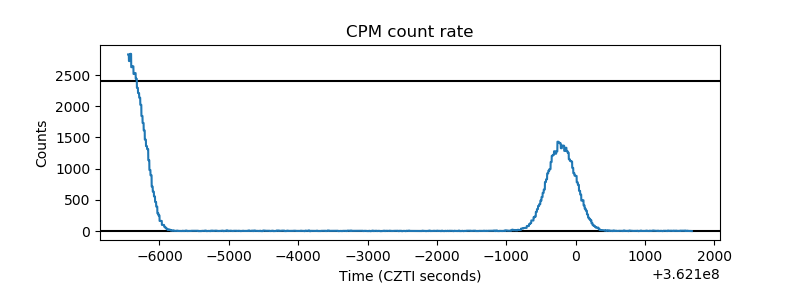 |
| CZT Counter | 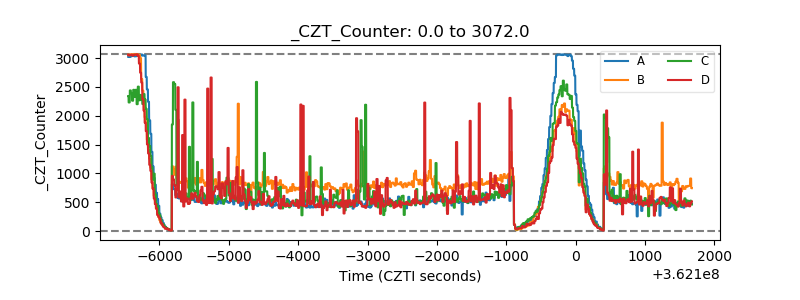 |
| +2.5 Volts monitor |  |
| +5 Volts monitor | 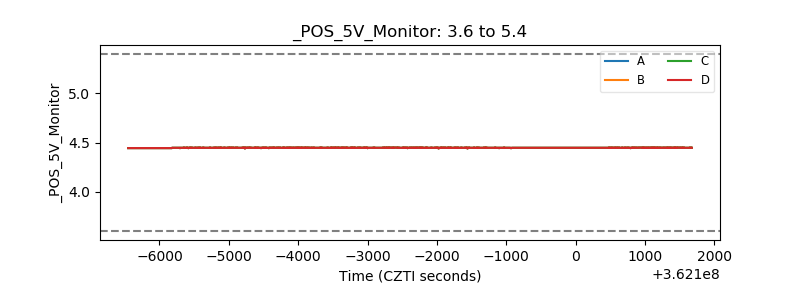 |
| _ROLL_ROT | 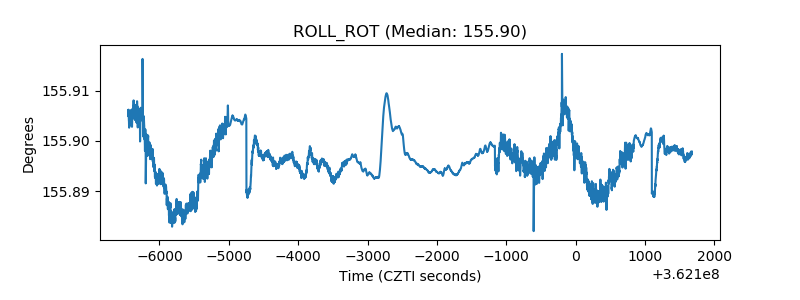 |
| _Roll_DEC | 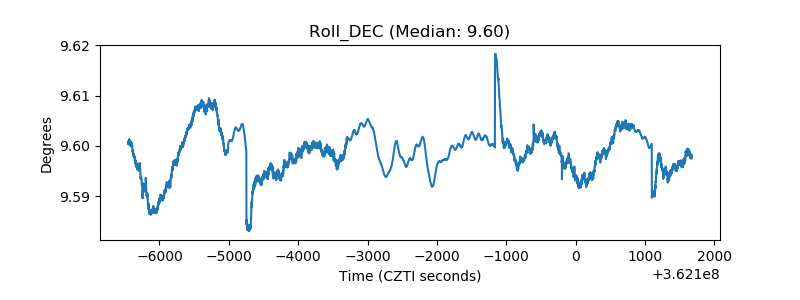 |
| _Roll_RA | 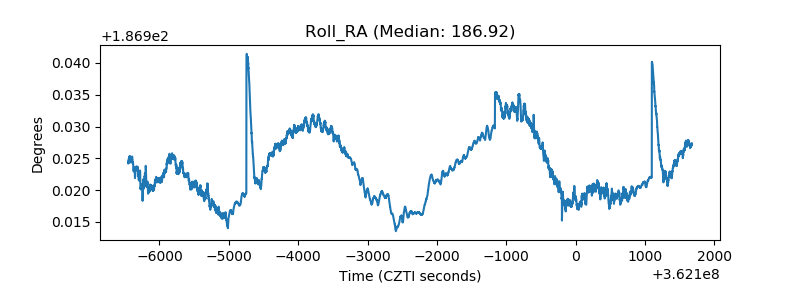 |
| Veto Counter | 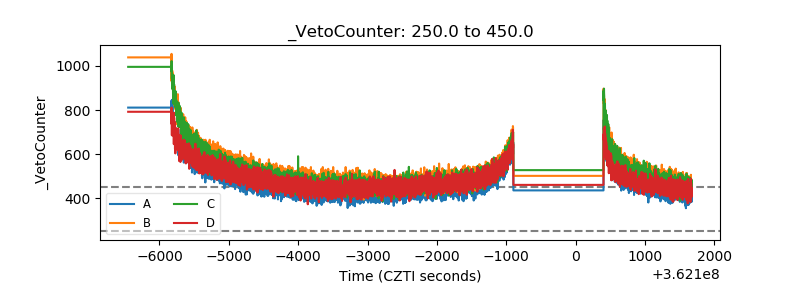 |