| Param | Original file | Final file |
|---|---|---|
| Filename | modeM0/AS1A10_071T52_9000004480_31008cztM0_level2.evt | modeM0/AS1A10_071T52_9000004480_31008cztM0_level2_quad_clean.evt |
| Size (bytes) | 544,337,280 | 79,902,720 |
| Size | 519.1 MB | 76.2 MB |
| Events in quadrant A | 3,268,356 | 505,718 |
| Events in quadrant B | 5,297,116 | 508,750 |
| Events in quadrant C | 3,876,158 | 470,673 |
| Events in quadrant D | 3,593,710 | 471,134 |
| Mode M0 | |||
|---|---|---|---|
| Quadrant | BADHDUFLAG | Total packets | Discarded packets |
| A | 0 | 13709 | 2 |
| B | 0 | 20269 | 2 |
| C | 0 | 15463 | 2 |
| D | 0 | 14786 | 2 |
| Mode M9 | |||
|---|---|---|---|
| Quadrant | BADHDUFLAG | Total packets | Discarded packets |
| A | 0 | 9 | 0 |
| B | 0 | 10 | 0 |
| C | 0 | 10 | 0 |
| D | 0 | 10 | 0 |
| Mode SS | |||
|---|---|---|---|
| Quadrant | BADHDUFLAG | Total packets | Discarded packets |
| A | 0 | 136 | 0 |
| B | 0 | 136 | 0 |
| C | 0 | 136 | 0 |
| D | 0 | 136 | 0 |
| Quadrant | Total seconds | Saturated seconds | Saturation percentage |
|---|---|---|---|
| A | 6638 | 42 | 0.632721% |
| B | 6638 | 100 | 1.506478% |
| C | 6638 | 230 | 3.464899% |
| D | 6638 | 64 | 0.964146% |
Noise dominated data is calculated using 1-second bins in cleaned event files. If a bin has >2000 counts, and if more than 50% of those come from <1% of pixels, then it is considered to be noise-dominated and hence unusable.
| Quadrant | # 1 sec bins | Bins with >0 counts | Bins with >2000 counts | High rate bins dominated by noise | Noise dominated (total time) | Noise dominated (detector-on time) | Marked lightcurve |
|---|---|---|---|---|---|---|---|
| A | 7613 | 6639 | 0 | 0 | 0.00% | 0.00% | 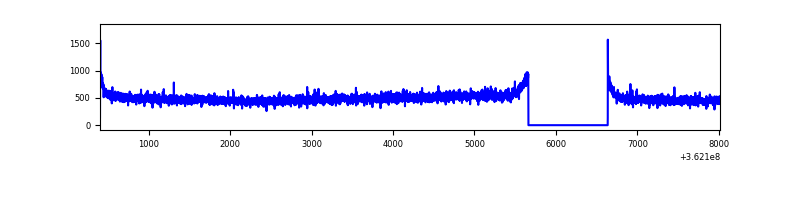 |
| B | 7613 | 6638 | 5 | 5 | 0.07% | 0.08% | 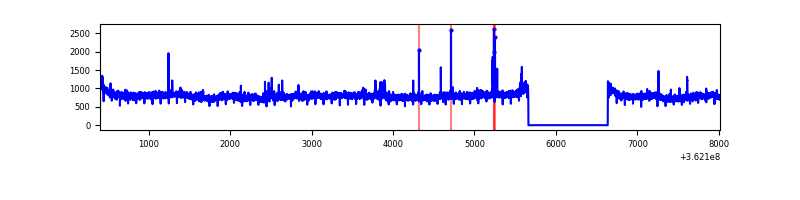 |
| C | 7613 | 6639 | 112 | 112 | 1.47% | 1.69% |  |
| D | 7613 | 6639 | 39 | 39 | 0.51% | 0.59% | 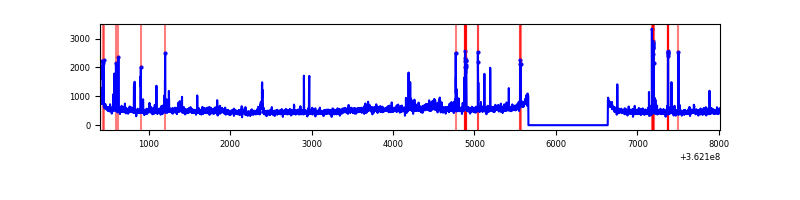 |
Top three noisy pixels from each quadrant. If the there are fewer than three noisy pixels in the level2.evt file, extra rows are filled as -1
| Pixel properties | Quadrant properties | ||||||
|---|---|---|---|---|---|---|---|
| Quadrant | DetID | PixID | Counts | Sigma | Mean | Median | Sigma |
| A | 13 | 254 | 12681 | 70.07 | 844 | 828 | 169.2 |
| A | 3 | 137 | 8379 | 44.64 | 844 | 828 | 169.2 |
| A | 0 | 226 | 7090 | 37.02 | 844 | 828 | 169.2 |
| B | 6 | 159 | 1897001 | 11717.25 | 838 | 815 | 161.8 |
| B | 0 | 230 | 33211 | 200.19 | 838 | 815 | 161.8 |
| B | 0 | 190 | 19733 | 116.9 | 838 | 815 | 161.8 |
| C | 0 | 10 | 603240 | 3232.62 | 795 | 802 | 186.4 |
| C | 14 | 238 | 128579 | 685.64 | 795 | 802 | 186.4 |
| C | 15 | 208 | 18681 | 95.94 | 795 | 802 | 186.4 |
| D | 8 | 195 | 396309 | 2050.07 | 806 | 782 | 192.9 |
| D | 7 | 69 | 45581 | 232.2 | 806 | 782 | 192.9 |
| D | 2 | 250 | 41864 | 212.93 | 806 | 782 | 192.9 |
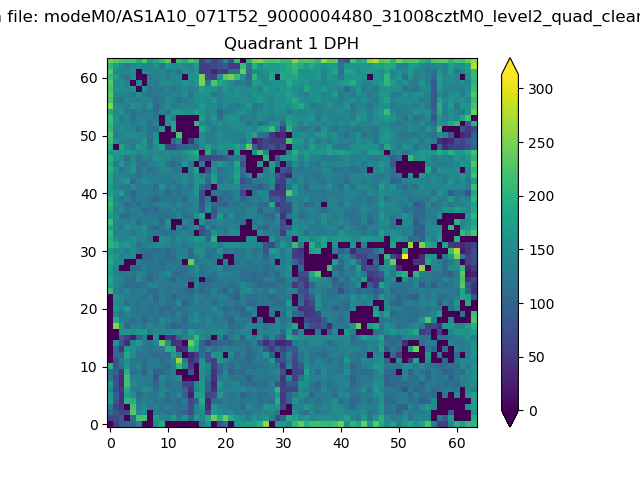
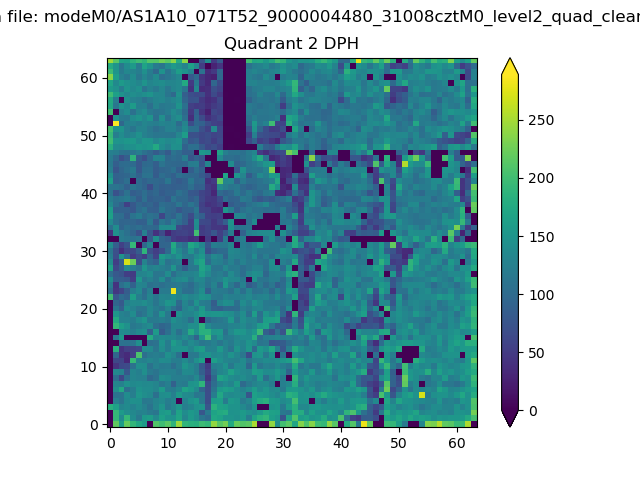
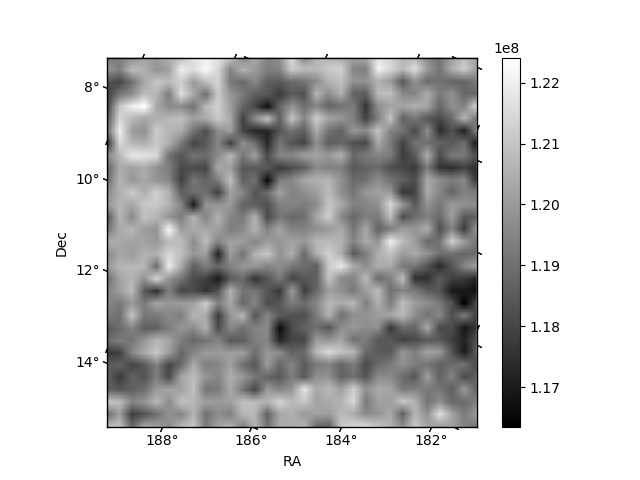
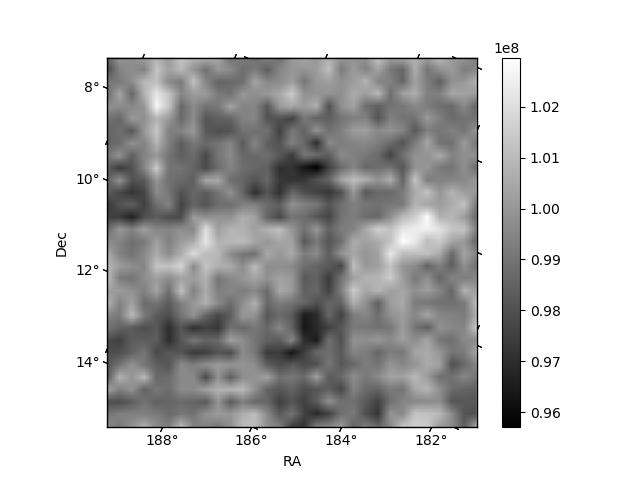
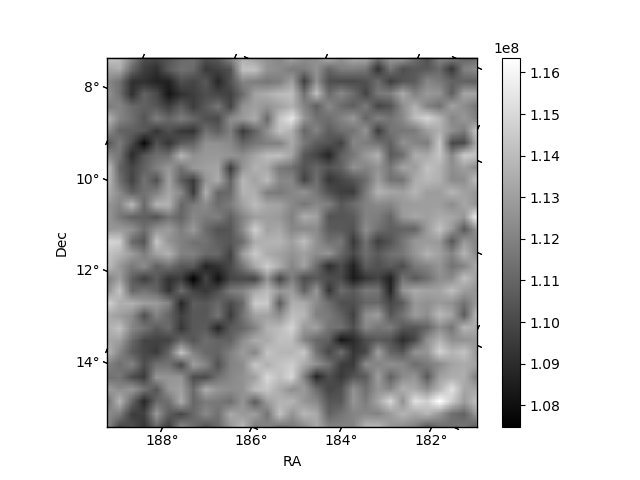
Histogram calculated using DETX and DETY for each event in the final _common_clean file
| Quadrant A | 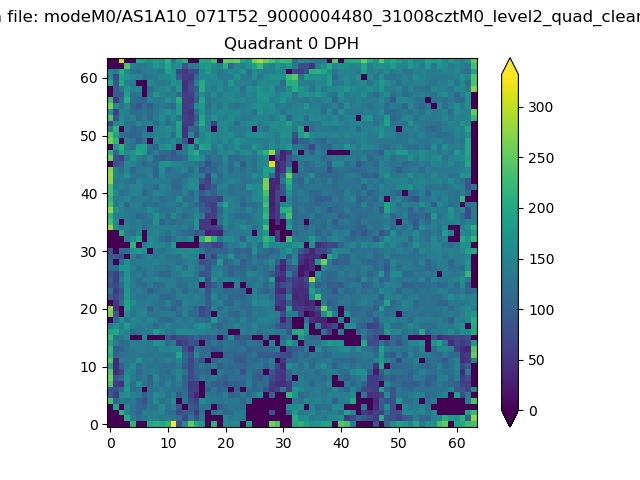 |
 |
Quadrant B |
|---|---|---|---|
| Quadrant D | 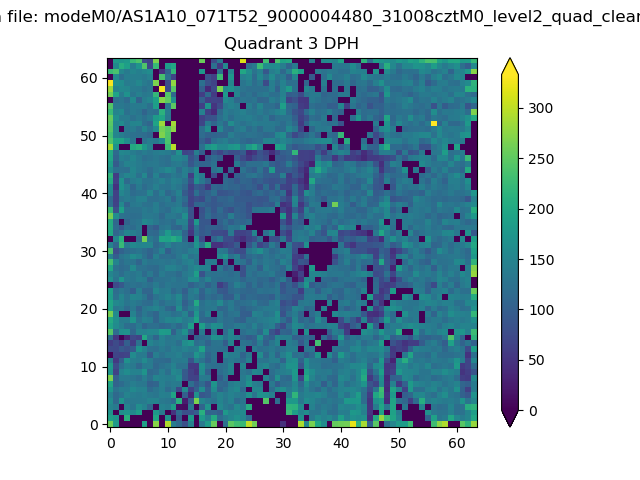 |
 |
Quadrant C |
| Plot type | Count rate plots | Images |
|---|---|---|
| Comparison with Poisson distribution Blue bars denote a histogram of data divided into 1 sec bins. Red curve is a Poisson curve with rate = median count rate of data. |
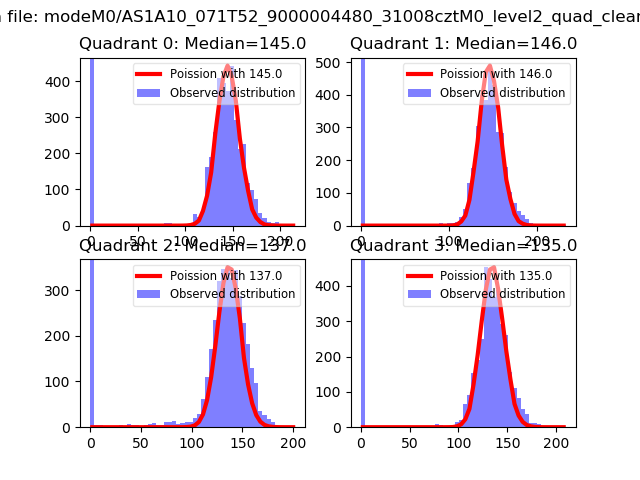 |
 |
| Quadrant-wise count rates Data is divided into 100 sec bins |
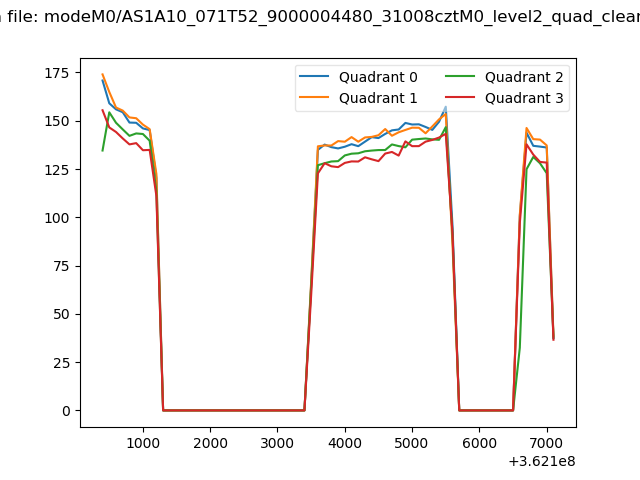 |
|
| Module-wise count rates for Quadrant A Data is divided into 100 sec bins |
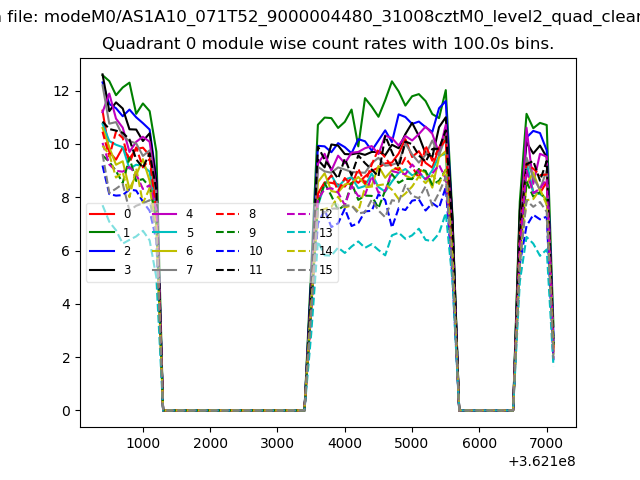 |
 |
| Module-wise count rates for Quadrant B Data is divided into 100 sec bins |
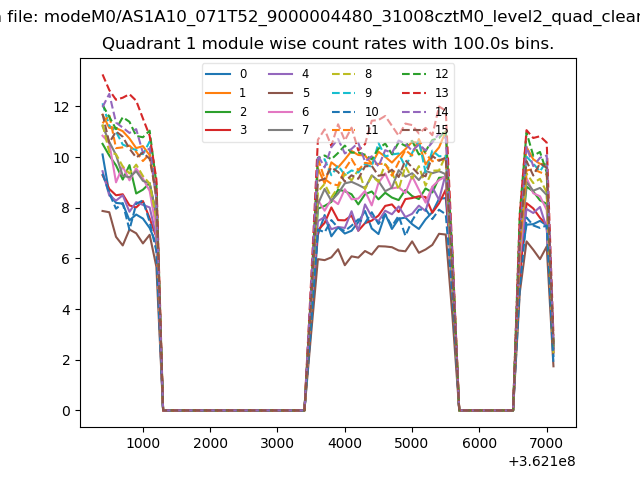 |
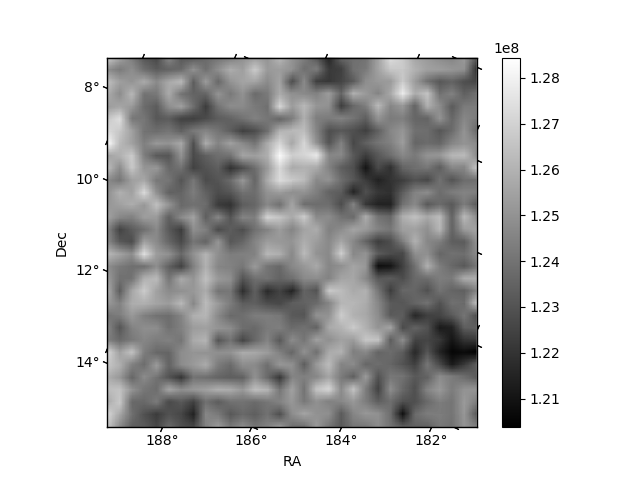 |
| Module-wise count rates for Quadrant C Data is divided into 100 sec bins |
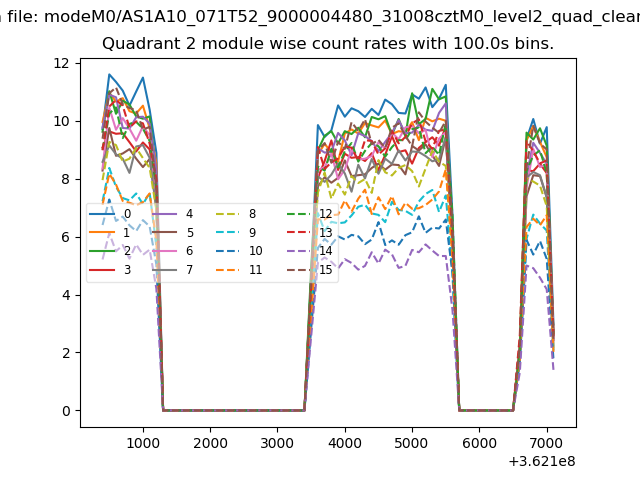 |
 |
| Module-wise count rates for Quadrant D Data is divided into 100 sec bins |
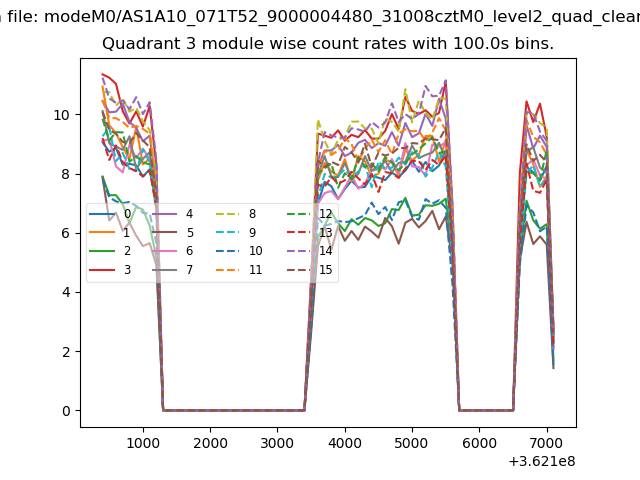 |
 |
| Parameter | Plot |
|---|---|
| CZT HV Monitor | 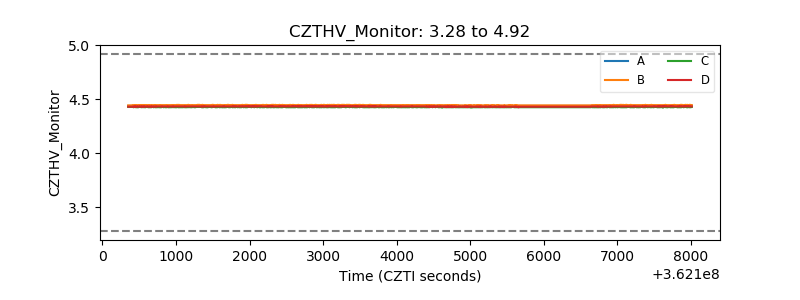 |
| D_VDD |  |
| Temperature 1 | 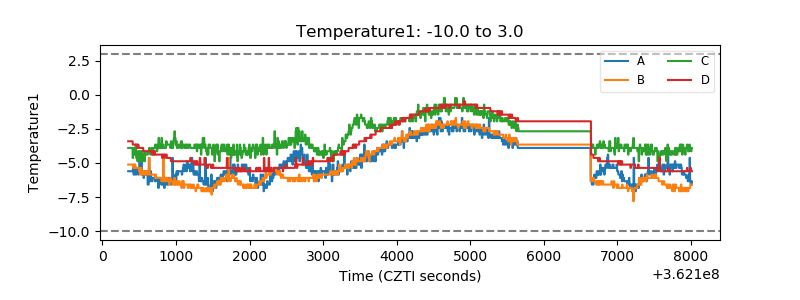 |
| Veto HV Monitor |  |
| Veto LLD | 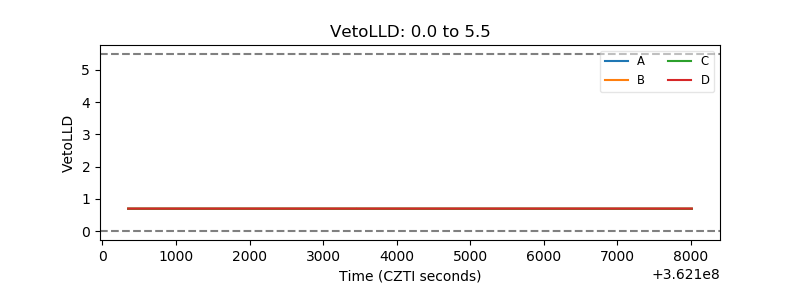 |
| Alpha Counter | 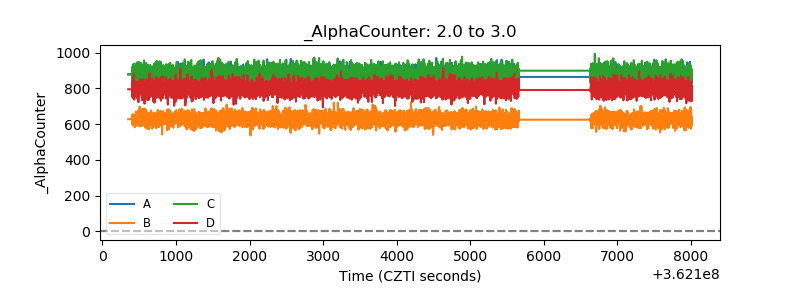 |
| _CPM_Rate | 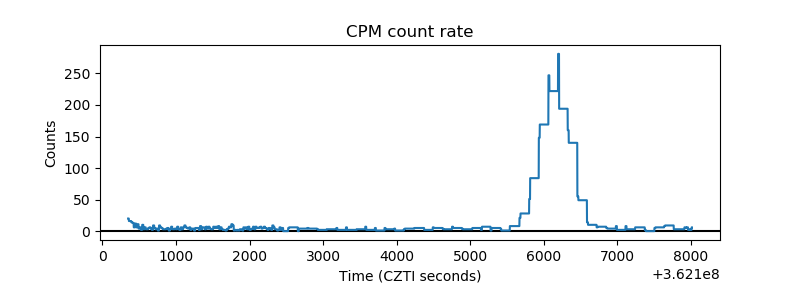 |
| CZT Counter | 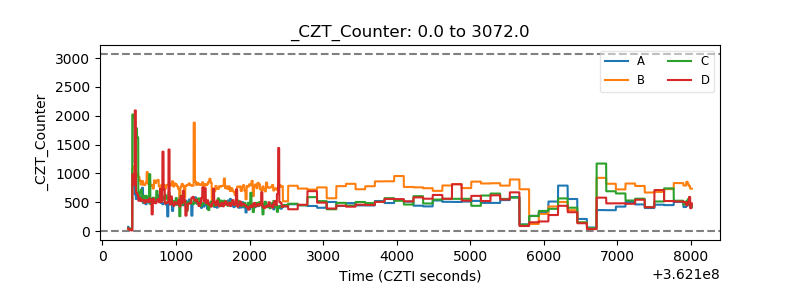 |
| +2.5 Volts monitor |  |
| +5 Volts monitor |  |
| _ROLL_ROT | 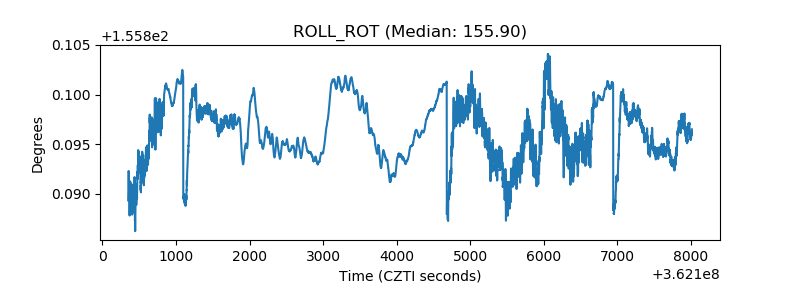 |
| _Roll_DEC | 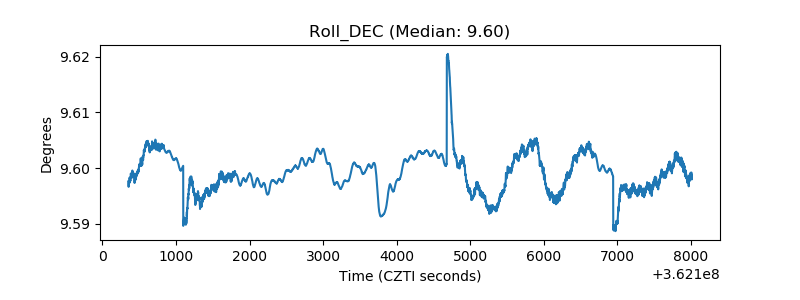 |
| _Roll_RA |  |
| Veto Counter | 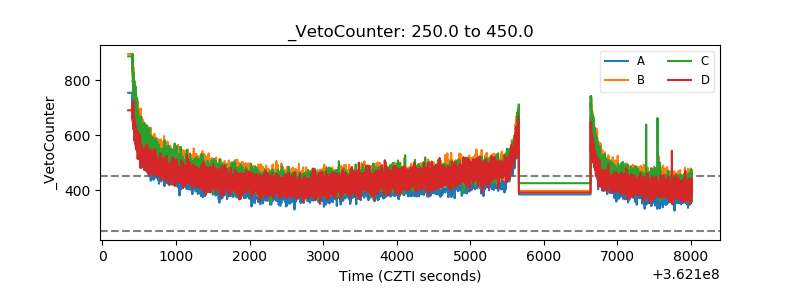 |