| Param | Original file | Final file |
|---|---|---|
| Filename | modeM0/AS1A10_071T52_9000004480_31009cztM0_level2.evt | modeM0/AS1A10_071T52_9000004480_31009cztM0_level2_quad_clean.evt |
| Size (bytes) | 587,194,560 | 78,739,200 |
| Size | 560.0 MB | 75.1 MB |
| Events in quadrant A | 3,463,334 | 488,311 |
| Events in quadrant B | 5,612,397 | 486,370 |
| Events in quadrant C | 4,158,683 | 452,335 |
| Events in quadrant D | 4,061,554 | 456,116 |
| Mode M0 | |||
|---|---|---|---|
| Quadrant | BADHDUFLAG | Total packets | Discarded packets |
| A | 0 | 14789 | 2 |
| B | 0 | 21890 | 2 |
| C | 0 | 16767 | 2 |
| D | 0 | 16714 | 2 |
| Mode M9 | |||
|---|---|---|---|
| Quadrant | BADHDUFLAG | Total packets | Discarded packets |
| A | 0 | 11 | 0 |
| B | 0 | 12 | 0 |
| C | 0 | 12 | 0 |
| D | 0 | 12 | 0 |
| Mode SS | |||
|---|---|---|---|
| Quadrant | BADHDUFLAG | Total packets | Discarded packets |
| A | 0 | 148 | 0 |
| B | 0 | 148 | 0 |
| C | 0 | 148 | 0 |
| D | 0 | 148 | 0 |
| Quadrant | Total seconds | Saturated seconds | Saturation percentage |
|---|---|---|---|
| A | 7188 | 39 | 0.542571% |
| B | 7187 | 137 | 1.906220% |
| C | 7187 | 298 | 4.146375% |
| D | 7187 | 81 | 1.127035% |
Noise dominated data is calculated using 1-second bins in cleaned event files. If a bin has >2000 counts, and if more than 50% of those come from <1% of pixels, then it is considered to be noise-dominated and hence unusable.
| Quadrant | # 1 sec bins | Bins with >0 counts | Bins with >2000 counts | High rate bins dominated by noise | Noise dominated (total time) | Noise dominated (detector-on time) | Marked lightcurve |
|---|---|---|---|---|---|---|---|
| A | 7718 | 7189 | 0 | 0 | 0.00% | 0.00% | 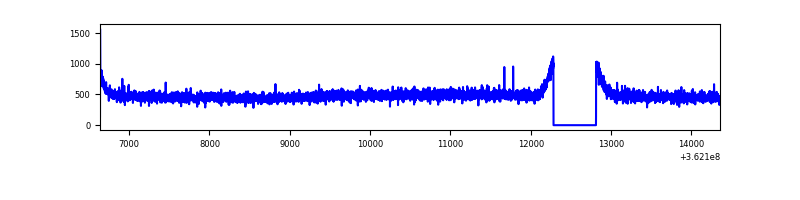 |
| B | 7717 | 7187 | 2 | 2 | 0.03% | 0.03% | 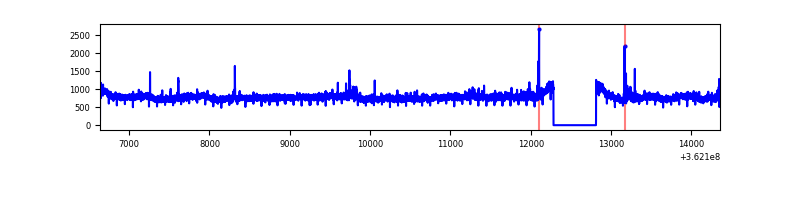 |
| C | 7717 | 7188 | 137 | 137 | 1.78% | 1.91% | 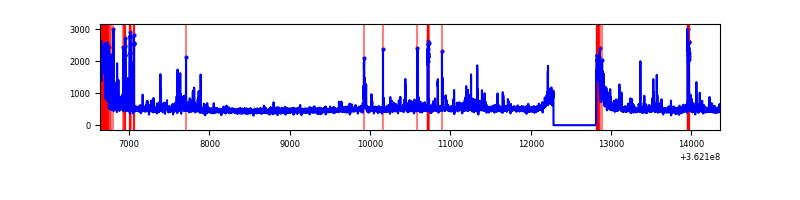 |
| D | 7717 | 7188 | 61 | 61 | 0.79% | 0.85% | 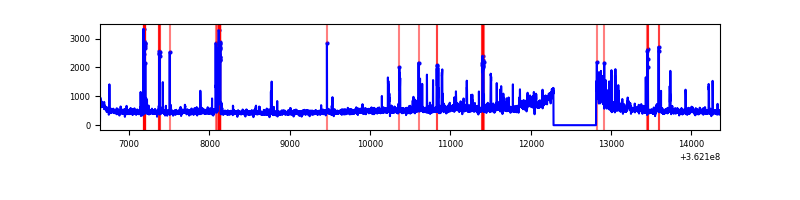 |
Top three noisy pixels from each quadrant. If the there are fewer than three noisy pixels in the level2.evt file, extra rows are filled as -1
| Pixel properties | Quadrant properties | ||||||
|---|---|---|---|---|---|---|---|
| Quadrant | DetID | PixID | Counts | Sigma | Mean | Median | Sigma |
| A | 13 | 254 | 13458 | 69.62 | 897 | 877 | 180.7 |
| A | 3 | 137 | 9441 | 47.39 | 897 | 877 | 180.7 |
| A | 0 | 226 | 7519 | 36.76 | 897 | 877 | 180.7 |
| B | 6 | 159 | 1975206 | 11410.48 | 888 | 865 | 173.0 |
| B | 0 | 183 | 75043 | 428.7 | 888 | 865 | 173.0 |
| B | 0 | 190 | 29495 | 165.46 | 888 | 865 | 173.0 |
| C | 0 | 10 | 682738 | 3430.87 | 841 | 846 | 198.8 |
| C | 14 | 238 | 135631 | 678.16 | 841 | 846 | 198.8 |
| C | 10 | 22 | 31795 | 155.72 | 841 | 846 | 198.8 |
| D | 8 | 195 | 434445 | 2114.08 | 855 | 831 | 205.1 |
| D | 12 | 218 | 194989 | 946.62 | 855 | 831 | 205.1 |
| D | 7 | 69 | 100548 | 486.17 | 855 | 831 | 205.1 |
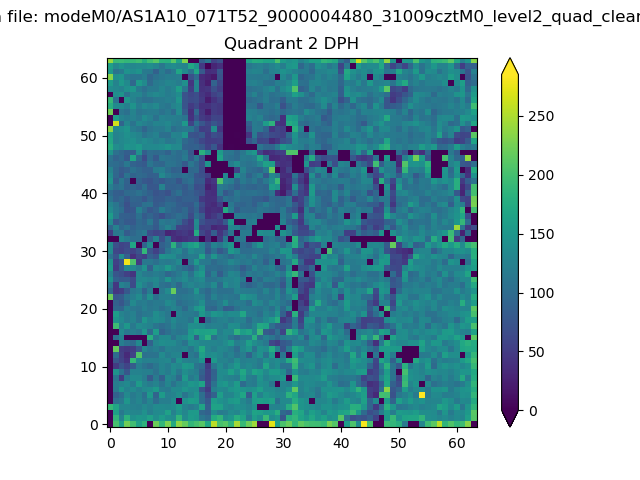
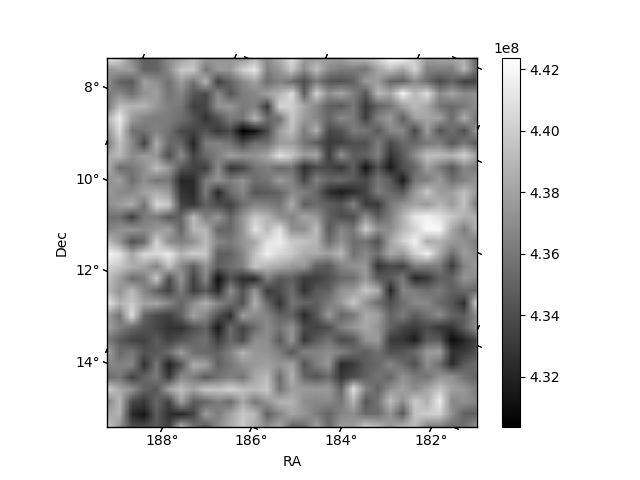
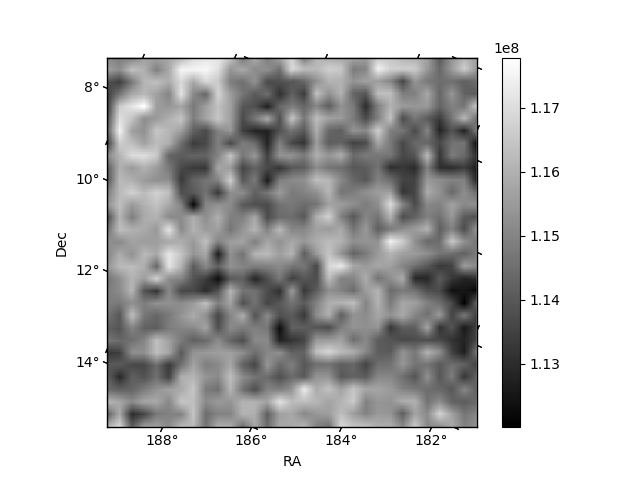
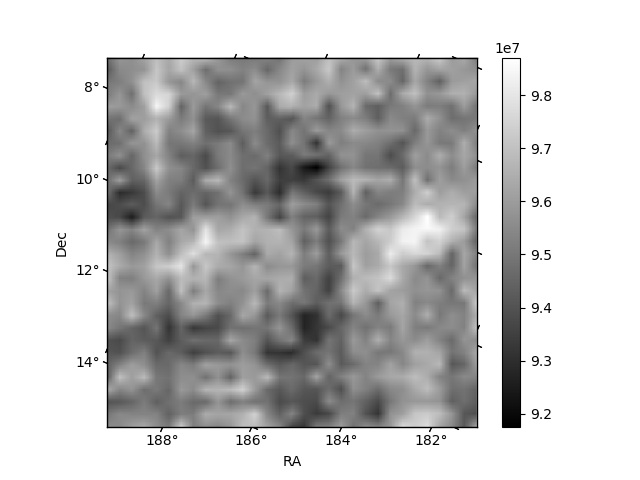
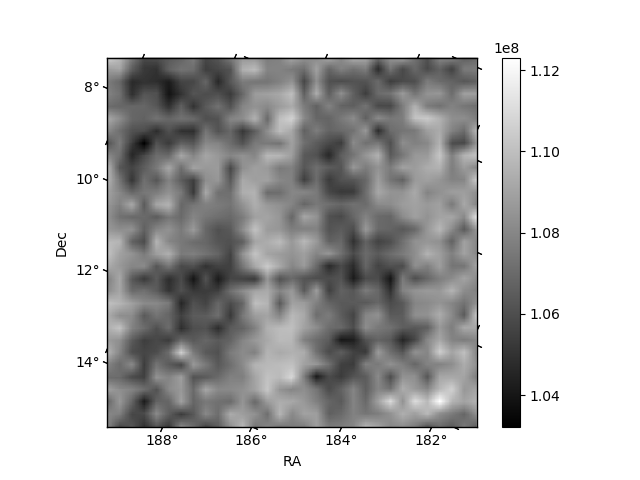
Histogram calculated using DETX and DETY for each event in the final _common_clean file
| Quadrant A | 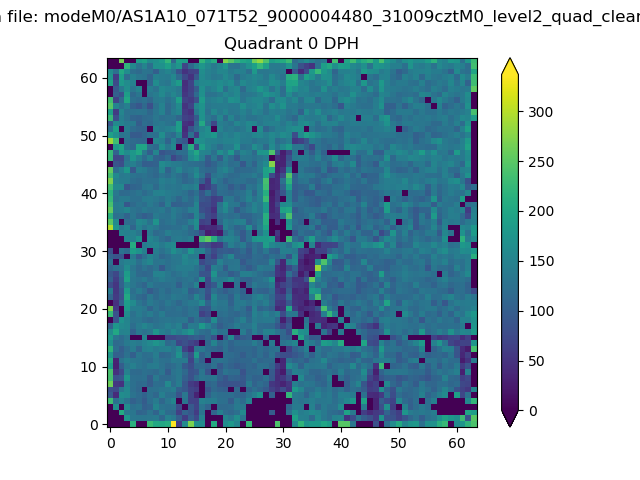 |
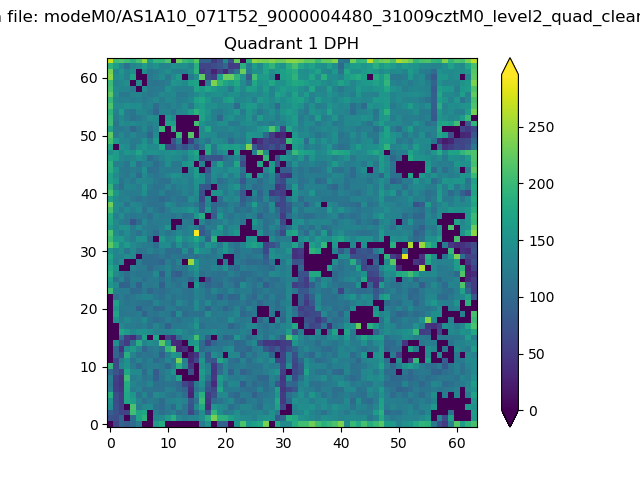 |
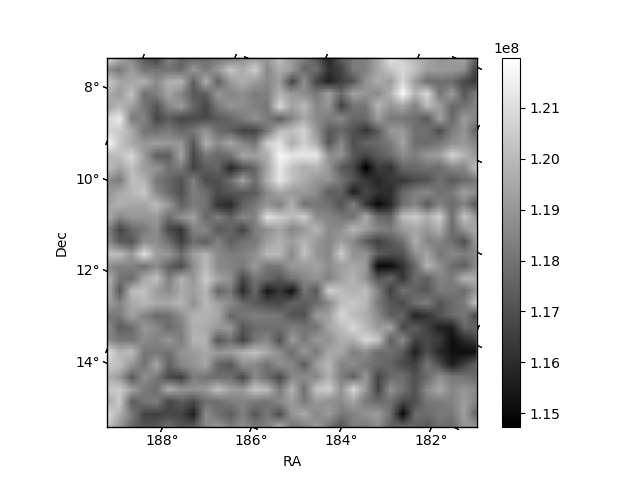
Quadrant B |
|---|---|---|---|
| Quadrant D | 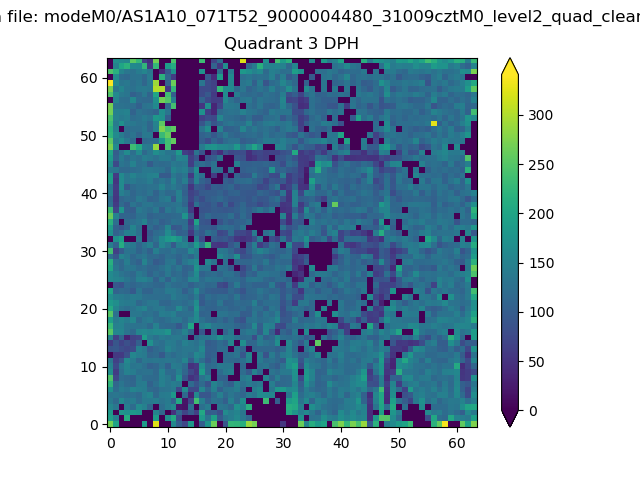 |
 |
Quadrant C |
| Plot type | Count rate plots | Images |
|---|---|---|
| Comparison with Poisson distribution Blue bars denote a histogram of data divided into 1 sec bins. Red curve is a Poisson curve with rate = median count rate of data. |
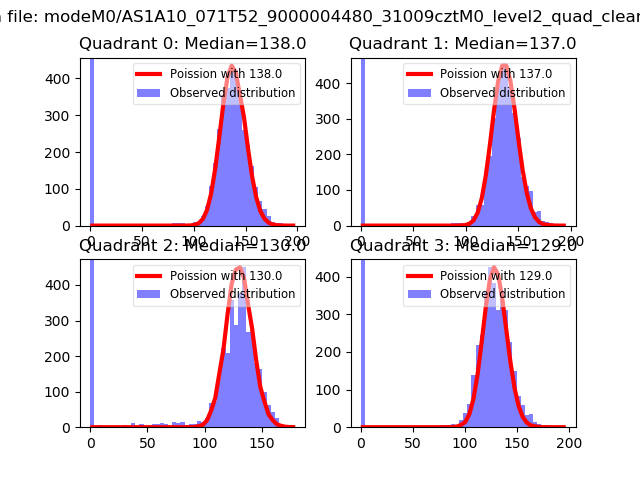 |
 |
| Quadrant-wise count rates Data is divided into 100 sec bins |
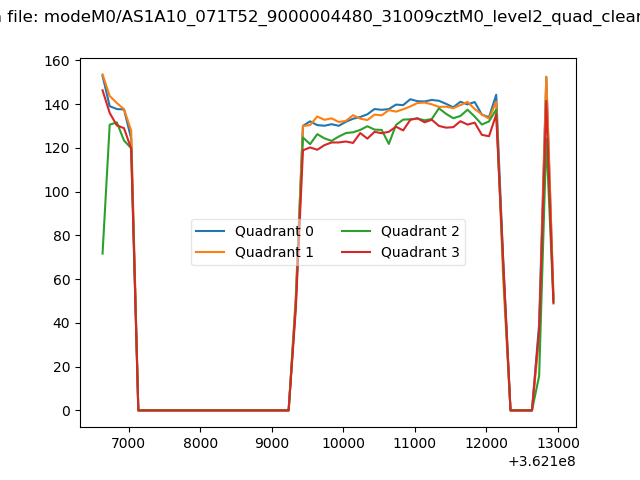 |
|
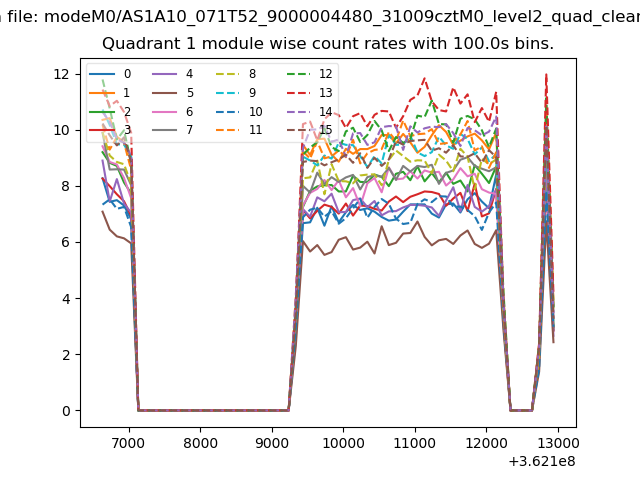
| Module-wise count rates for Quadrant A Data is divided into 100 sec bins |
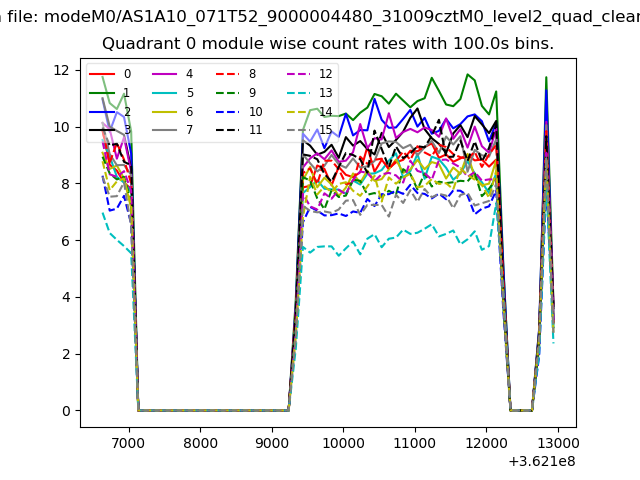 |
 |
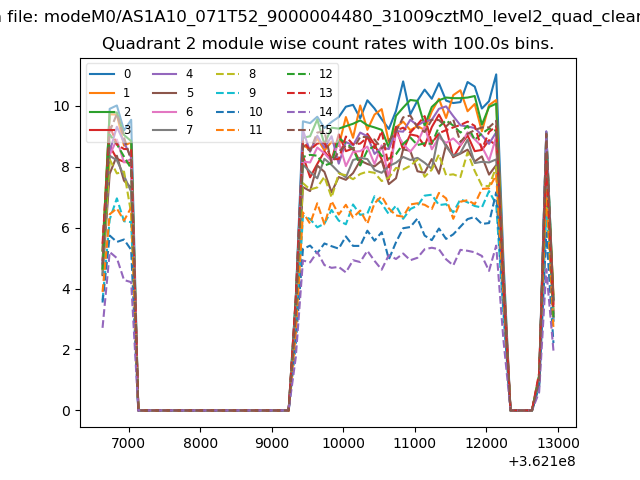
| Module-wise count rates for Quadrant B Data is divided into 100 sec bins |
 |
 |
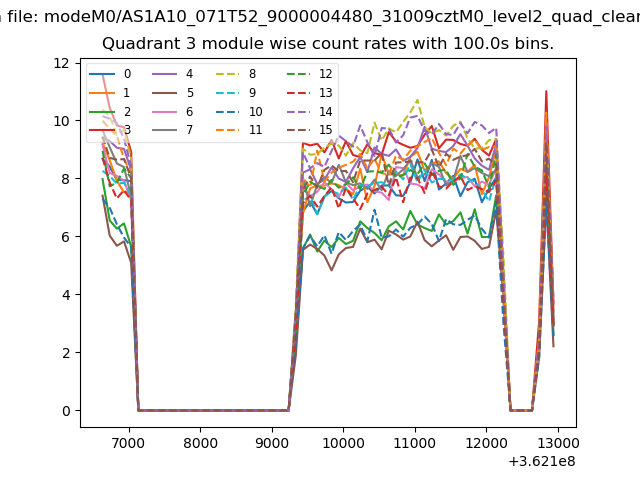
| Module-wise count rates for Quadrant C Data is divided into 100 sec bins |
 |
 |
| Module-wise count rates for Quadrant D Data is divided into 100 sec bins |
 |
 |
| Parameter | Plot |
|---|---|
| CZT HV Monitor | 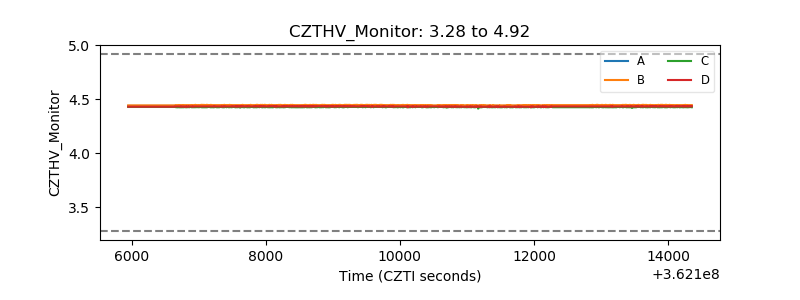 |
| D_VDD | 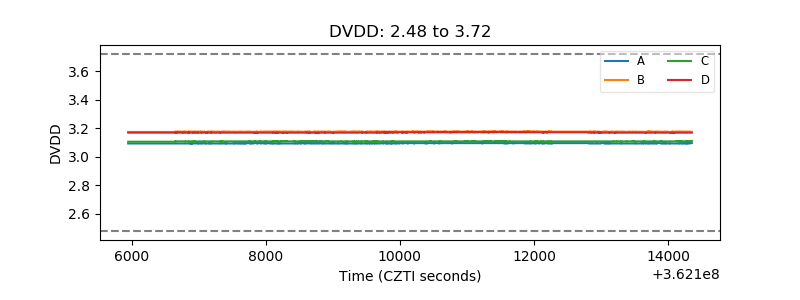 |
| Temperature 1 | 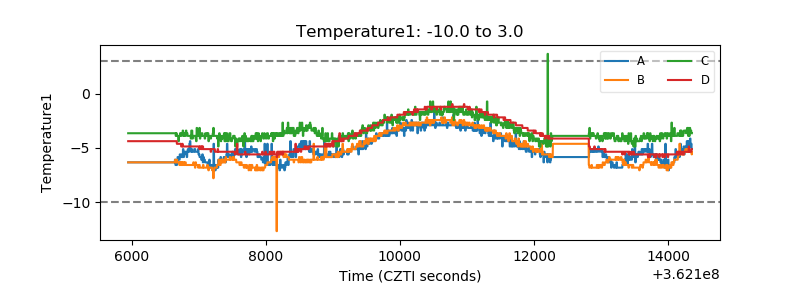 |
| Veto HV Monitor | 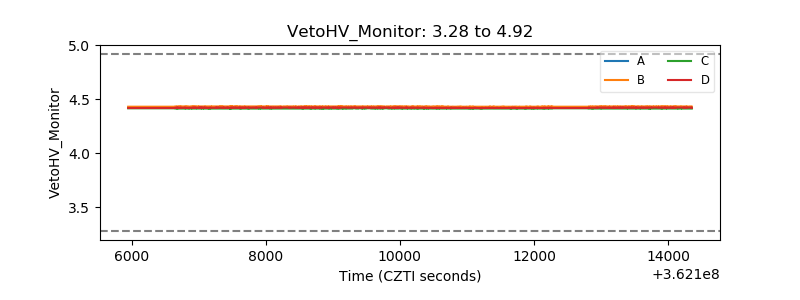 |
| Veto LLD | 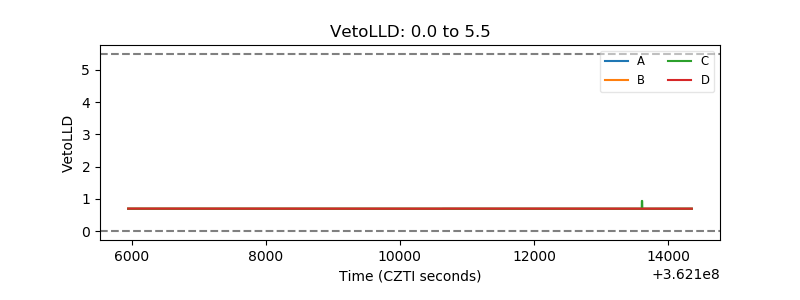 |
| Alpha Counter | 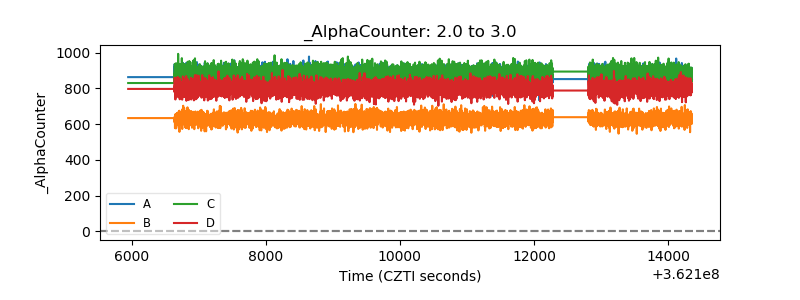 |
| _CPM_Rate | 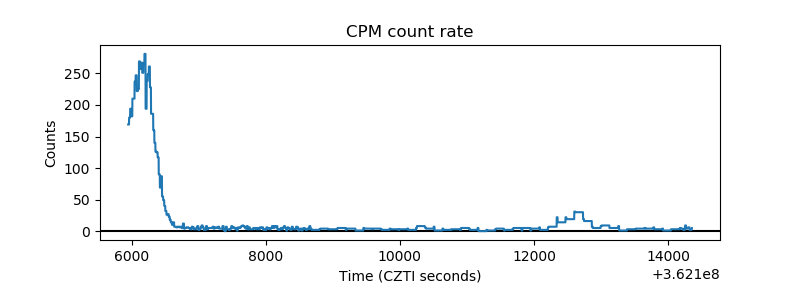 |
| CZT Counter | 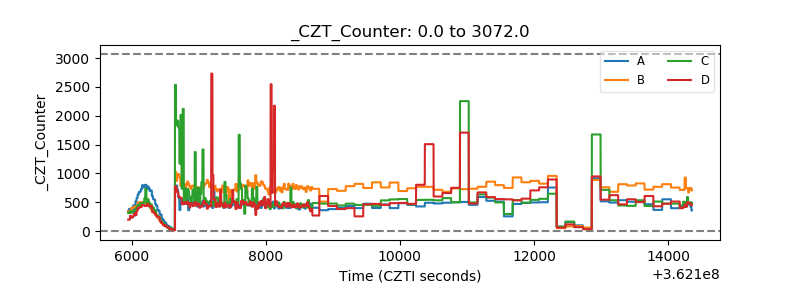 |
| +2.5 Volts monitor | 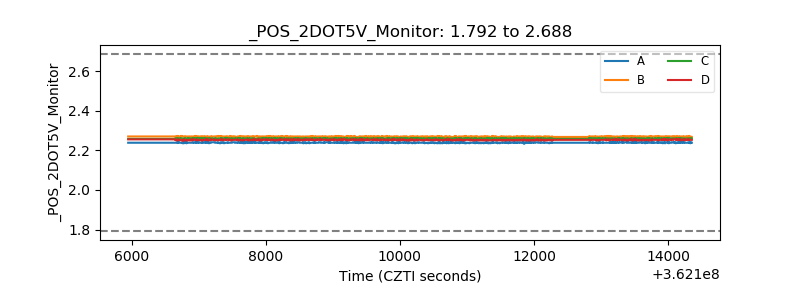 |
| +5 Volts monitor | 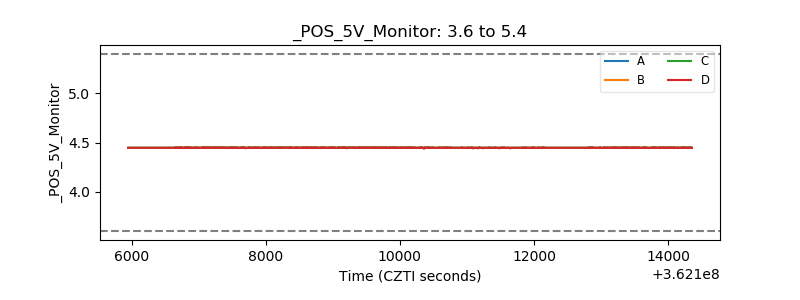 |
| _ROLL_ROT | 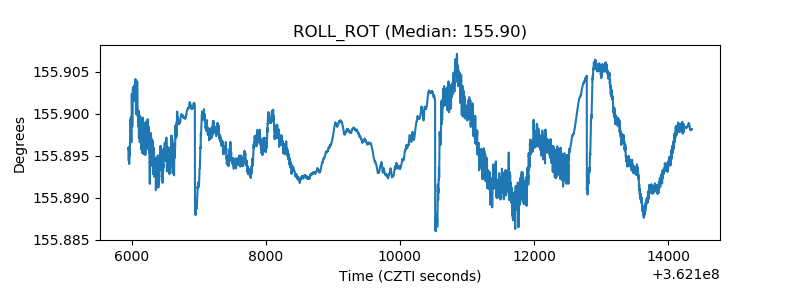 |
| _Roll_DEC | 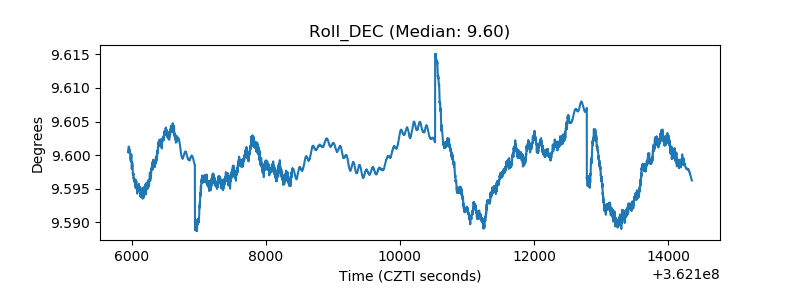 |
| _Roll_RA | 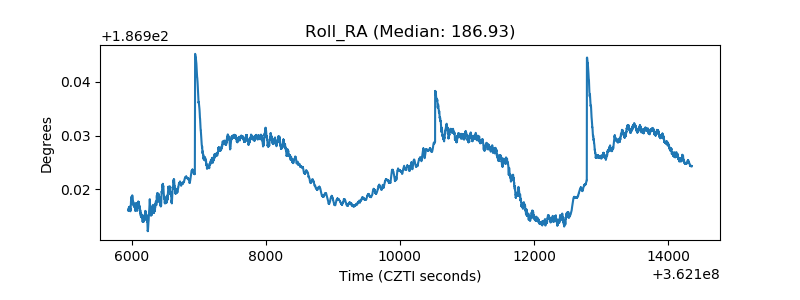 |
| Veto Counter | 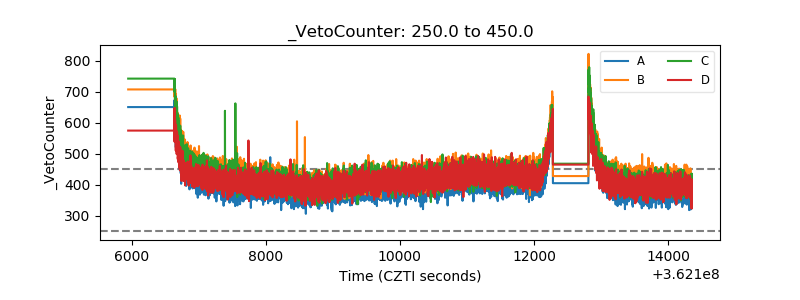 |