| Param | Original file | Final file |
|---|---|---|
| Filename | modeM0/AS1A10_071T52_9000004480_31010cztM0_level2.evt | modeM0/AS1A10_071T52_9000004480_31010cztM0_level2_quad_clean.evt |
| Size (bytes) | 710,349,120 | 74,459,520 |
| Size | 677.4 MB | 71.0 MB |
| Events in quadrant A | 3,666,254 | 471,659 |
| Events in quadrant B | 5,871,586 | 471,908 |
| Events in quadrant C | 4,120,942 | 451,814 |
| Events in quadrant D | 7,348,089 | 338,265 |
| Mode M0 | |||
|---|---|---|---|
| Quadrant | BADHDUFLAG | Total packets | Discarded packets |
| A | 0 | 15645 | 0 |
| B | 0 | 22929 | 0 |
| C | 0 | 16870 | 0 |
| D | 0 | 26699 | 0 |
| Mode SS | |||
|---|---|---|---|
| Quadrant | BADHDUFLAG | Total packets | Discarded packets |
| A | 0 | 150 | 0 |
| B | 0 | 150 | 0 |
| C | 0 | 150 | 0 |
| D | 0 | 148 | 0 |
| Quadrant | Total seconds | Saturated seconds | Saturation percentage |
|---|---|---|---|
| A | 7476 | 270 | 3.611557% |
| B | 7476 | 392 | 5.243446% |
| C | 7477 | 308 | 4.119299% |
| D | 7476 | 1758 | 23.515249% |
Noise dominated data is calculated using 1-second bins in cleaned event files. If a bin has >2000 counts, and if more than 50% of those come from <1% of pixels, then it is considered to be noise-dominated and hence unusable.
| Quadrant | # 1 sec bins | Bins with >0 counts | Bins with >2000 counts | High rate bins dominated by noise | Noise dominated (total time) | Noise dominated (detector-on time) | Marked lightcurve |
|---|---|---|---|---|---|---|---|
| A | 7476 | 7476 | 0 | 0 | 0.00% | 0.00% | 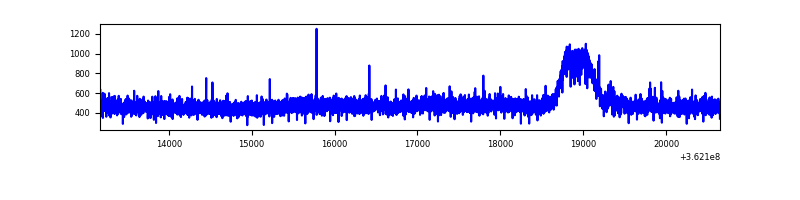 |
| B | 7476 | 7476 | 4 | 4 | 0.05% | 0.05% | 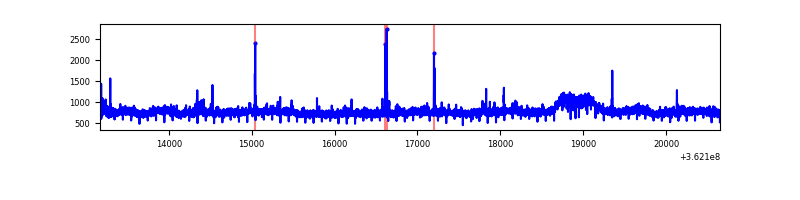 |
| C | 7477 | 7477 | 22 | 22 | 0.29% | 0.29% | 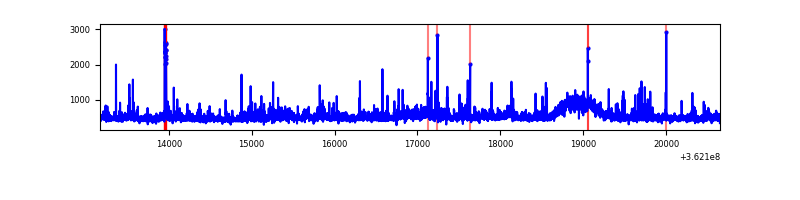 |
| D | 7476 | 7476 | 1343 | 1343 | 17.96% | 17.96% | 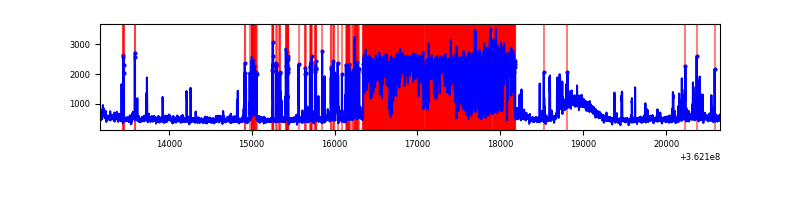 |
Top three noisy pixels from each quadrant. If the there are fewer than three noisy pixels in the level2.evt file, extra rows are filled as -1
| Pixel properties | Quadrant properties | ||||||
|---|---|---|---|---|---|---|---|
| Quadrant | DetID | PixID | Counts | Sigma | Mean | Median | Sigma |
| A | 13 | 254 | 14357 | 69.0 | 947 | 926 | 194.7 |
| A | 11 | 47 | 10221 | 47.75 | 947 | 926 | 194.7 |
| A | 3 | 137 | 10057 | 46.91 | 947 | 926 | 194.7 |
| B | 6 | 159 | 2061417 | 11172.78 | 929 | 900 | 184.4 |
| B | 0 | 183 | 61848 | 330.48 | 929 | 900 | 184.4 |
| B | 0 | 190 | 37051 | 196.02 | 929 | 900 | 184.4 |
| C | 0 | 10 | 419460 | 1945.07 | 904 | 909 | 215.2 |
| C | 14 | 238 | 142568 | 658.31 | 904 | 909 | 215.2 |
| C | 2 | 114 | 17455 | 76.89 | 904 | 909 | 215.2 |
| D | 12 | 218 | 2555281 | 12969.28 | 821 | 797 | 197.0 |
| D | 12 | 250 | 555558 | 2816.55 | 821 | 797 | 197.0 |
| D | 8 | 195 | 470011 | 2382.23 | 821 | 797 | 197.0 |
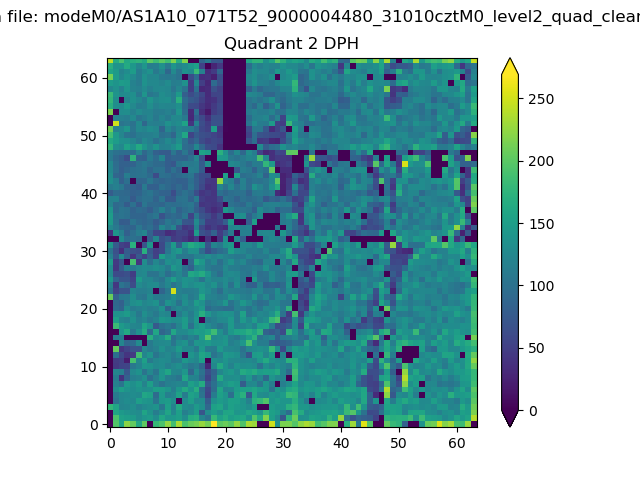
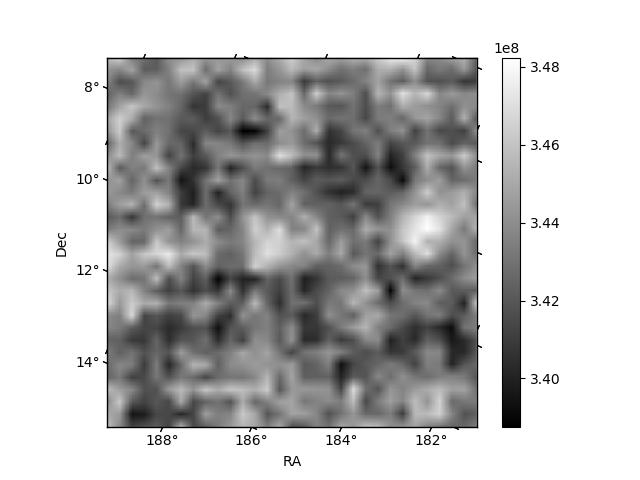
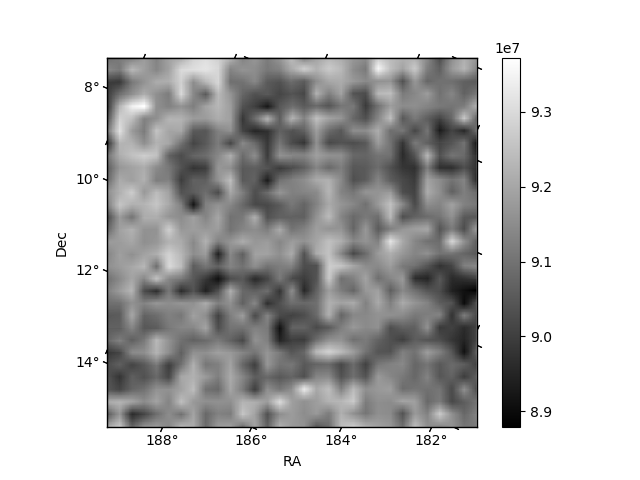
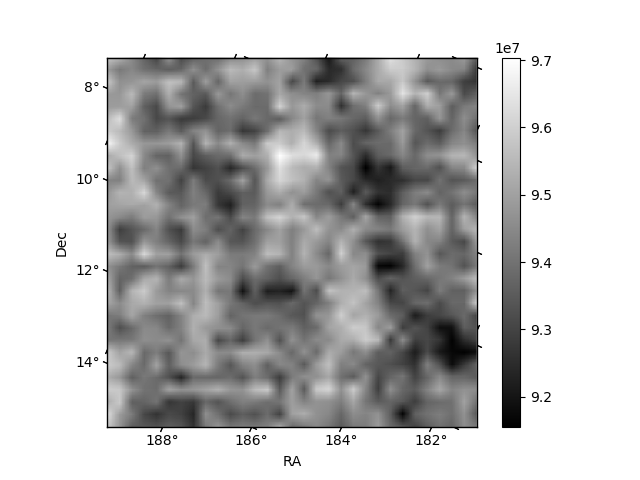
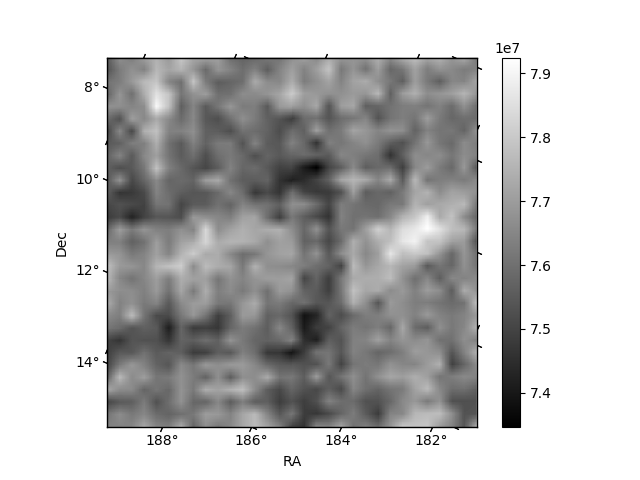
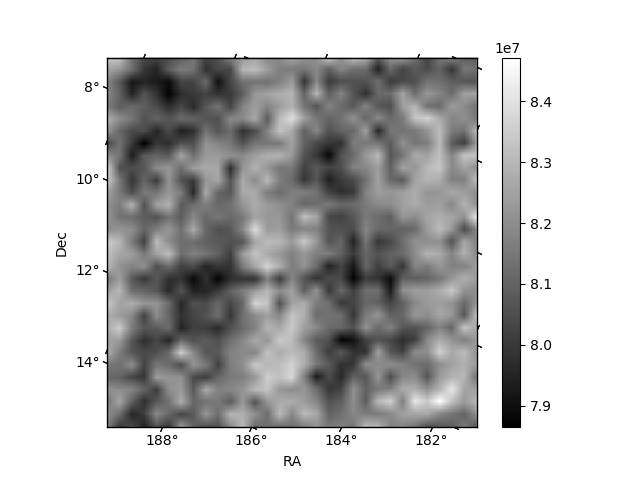
Histogram calculated using DETX and DETY for each event in the final _common_clean file
| Quadrant A | 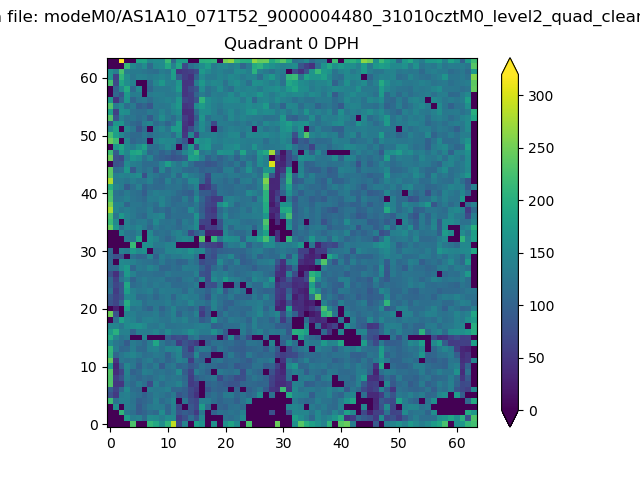 |
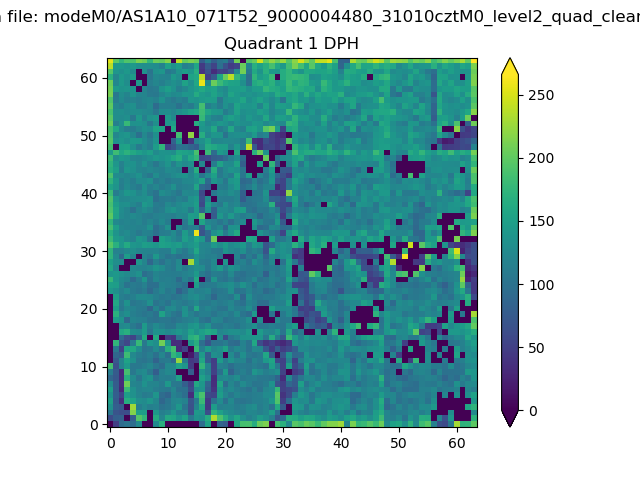 |
Quadrant B |
|---|---|---|---|
| Quadrant D | 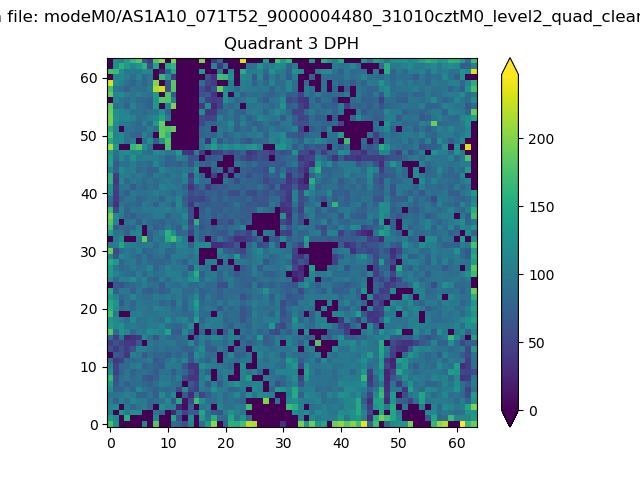 |
 |
Quadrant C |
| Plot type | Count rate plots | Images |
|---|---|---|
| Comparison with Poisson distribution Blue bars denote a histogram of data divided into 1 sec bins. Red curve is a Poisson curve with rate = median count rate of data. |
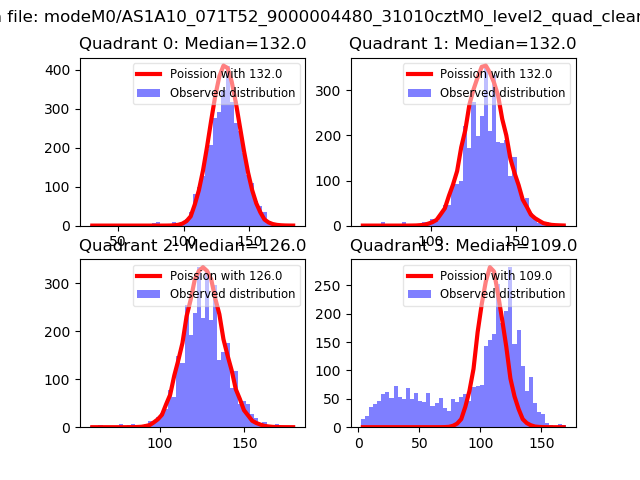 |
 |
| Quadrant-wise count rates Data is divided into 100 sec bins |
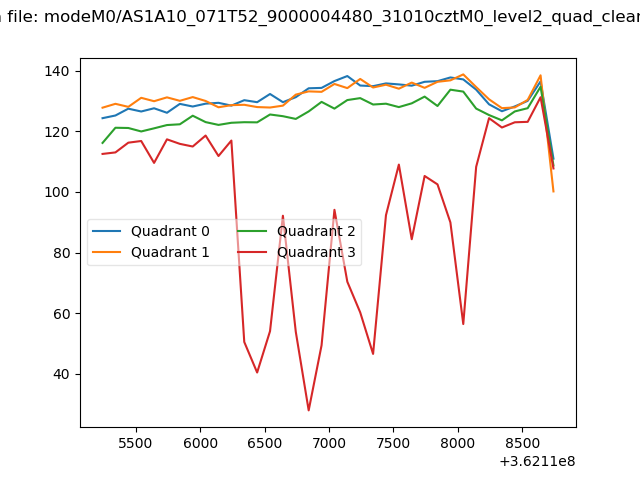 |
|
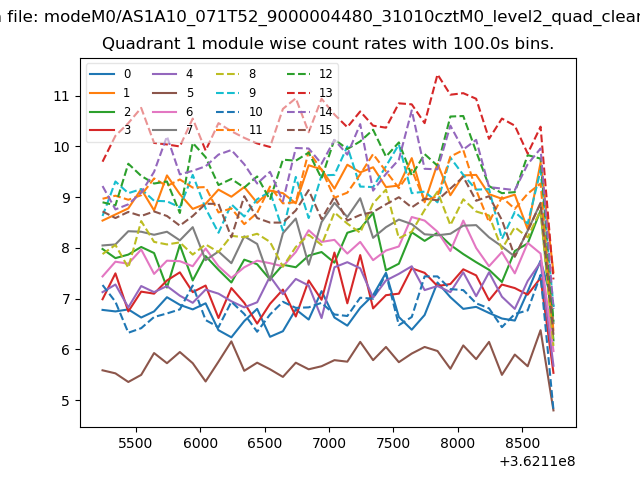
| Module-wise count rates for Quadrant A Data is divided into 100 sec bins |
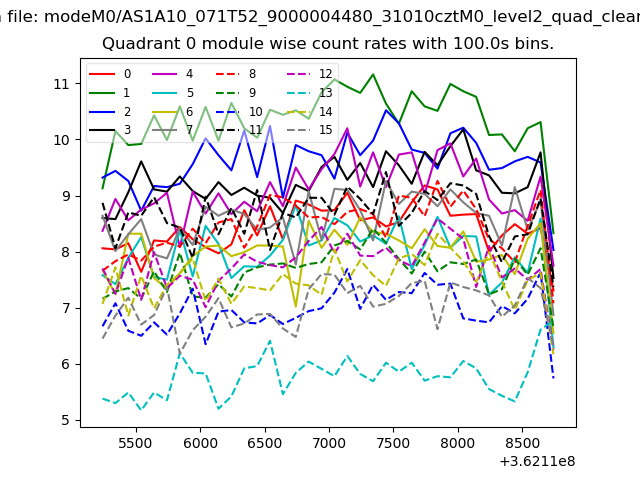 |
 |
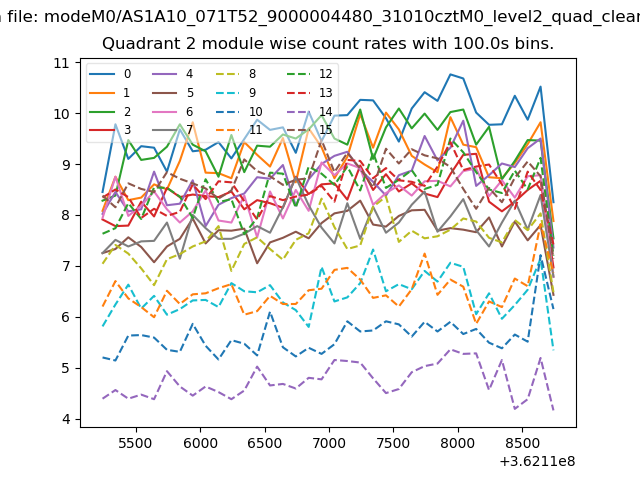
| Module-wise count rates for Quadrant B Data is divided into 100 sec bins |
 |
 |
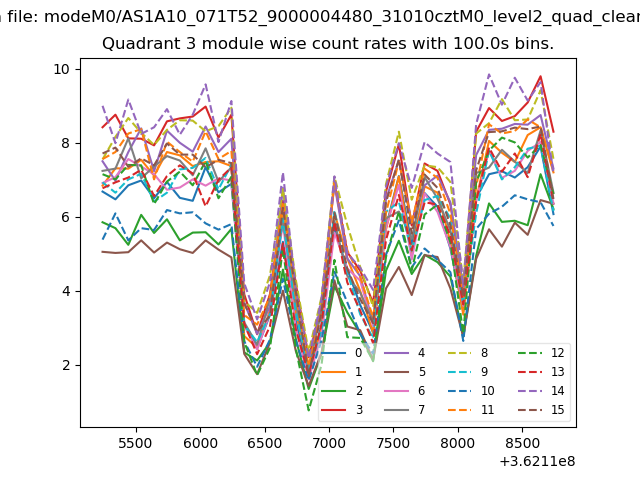
| Module-wise count rates for Quadrant C Data is divided into 100 sec bins |
 |
 |
| Module-wise count rates for Quadrant D Data is divided into 100 sec bins |
 |
 |
| Parameter | Plot |
|---|---|
| CZT HV Monitor | 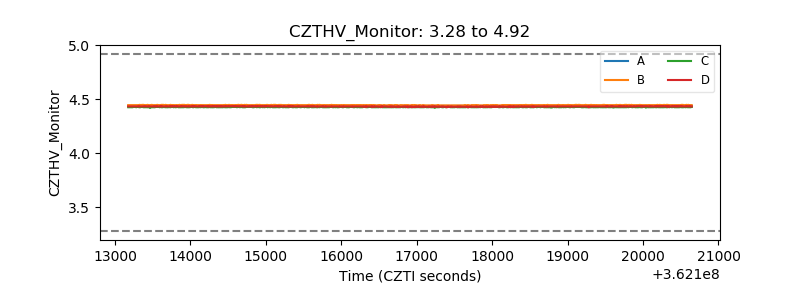 |
| D_VDD | 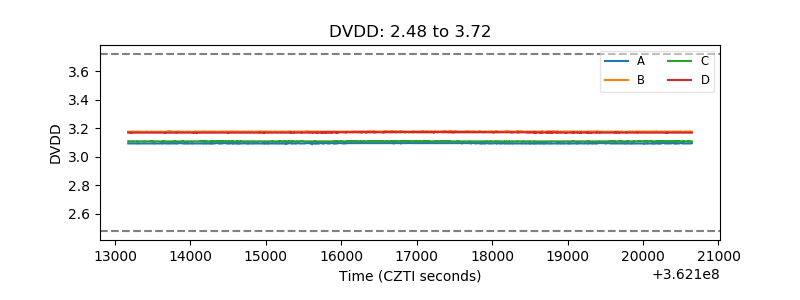 |
| Temperature 1 | 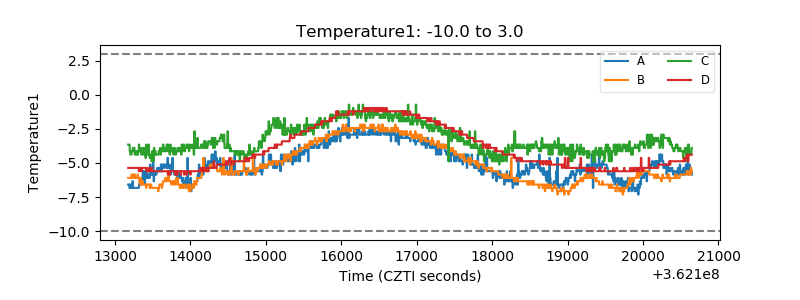 |
| Veto HV Monitor | 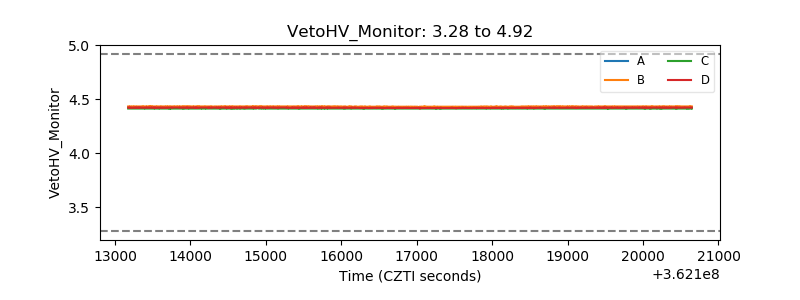 |
| Veto LLD |  |
| Alpha Counter | 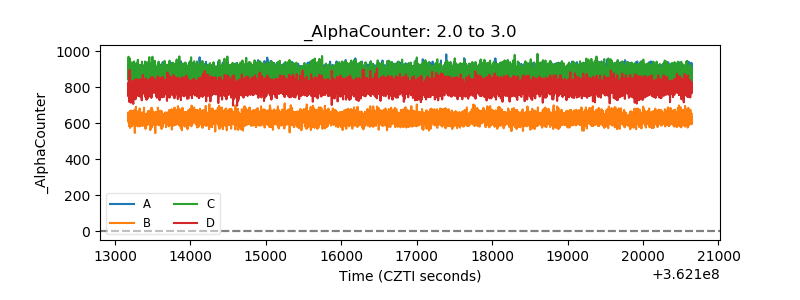 |
| _CPM_Rate | 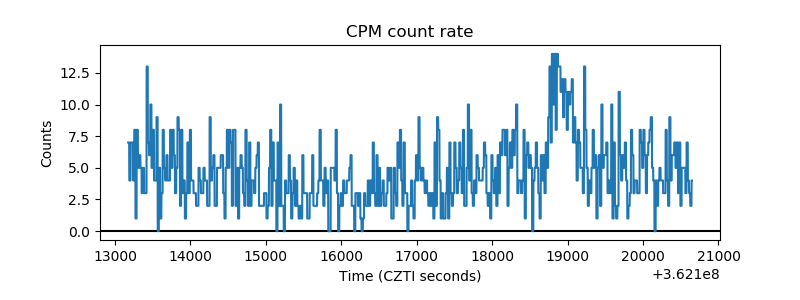 |
| CZT Counter | 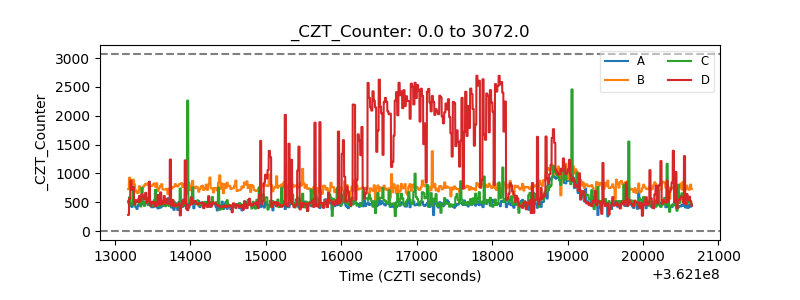 |
| +2.5 Volts monitor |  |
| +5 Volts monitor |  |
| _ROLL_ROT | 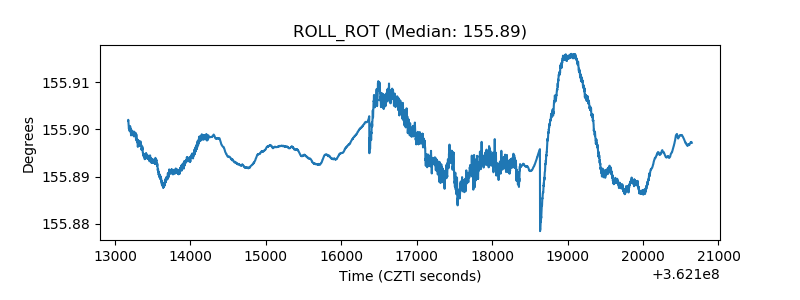 |
| _Roll_DEC | 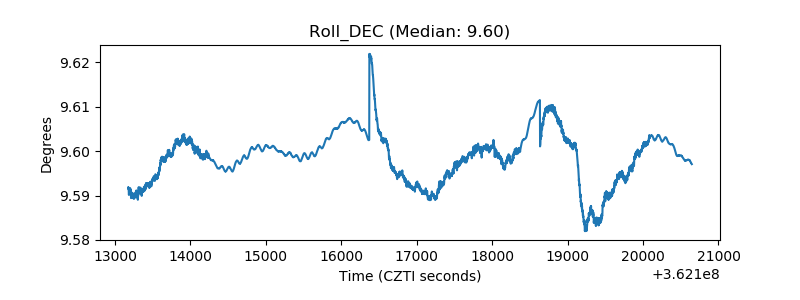 |
| _Roll_RA | 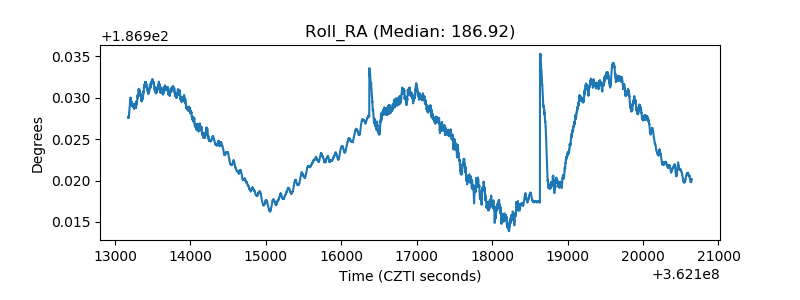 |
| Veto Counter | 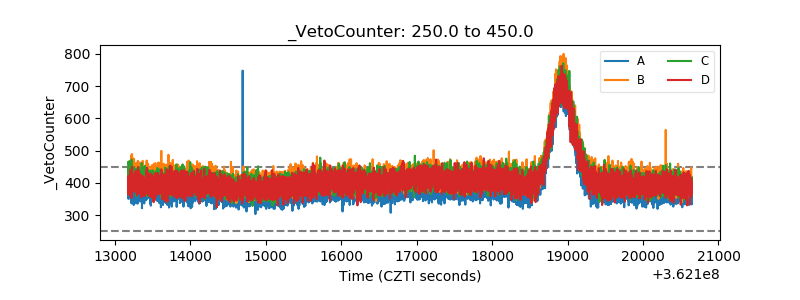 |