| Param | Original file | Final file |
|---|---|---|
| Filename | modeM0/AS1A10_071T52_9000004480_31011cztM0_level2.evt | modeM0/AS1A10_071T52_9000004480_31011cztM0_level2_quad_clean.evt |
| Size (bytes) | 653,273,280 | 77,405,760 |
| Size | 623.0 MB | 73.8 MB |
| Events in quadrant A | 3,648,691 | 476,370 |
| Events in quadrant B | 5,915,208 | 476,674 |
| Events in quadrant C | 3,933,545 | 456,578 |
| Events in quadrant D | 5,771,457 | 404,127 |
| Mode M0 | |||
|---|---|---|---|
| Quadrant | BADHDUFLAG | Total packets | Discarded packets |
| A | 0 | 15621 | 2 |
| B | 0 | 23150 | 2 |
| C | 0 | 16310 | 2 |
| D | 0 | 21982 | 2 |
| Mode M9 | |||
|---|---|---|---|
| Quadrant | BADHDUFLAG | Total packets | Discarded packets |
| A | 0 | 1 | 0 |
| B | 0 | 1 | 0 |
| C | 0 | 1 | 0 |
| D | 0 | 1 | 0 |
| Mode SS | |||
|---|---|---|---|
| Quadrant | BADHDUFLAG | Total packets | Discarded packets |
| A | 0 | 154 | 0 |
| B | 0 | 154 | 0 |
| C | 0 | 154 | 0 |
| D | 0 | 154 | 0 |
| Quadrant | Total seconds | Saturated seconds | Saturation percentage |
|---|---|---|---|
| A | 7617 | 172 | 2.258107% |
| B | 7618 | 260 | 3.412969% |
| C | 7618 | 239 | 3.137306% |
| D | 7618 | 760 | 9.976372% |
Noise dominated data is calculated using 1-second bins in cleaned event files. If a bin has >2000 counts, and if more than 50% of those come from <1% of pixels, then it is considered to be noise-dominated and hence unusable.
| Quadrant | # 1 sec bins | Bins with >0 counts | Bins with >2000 counts | High rate bins dominated by noise | Noise dominated (total time) | Noise dominated (detector-on time) | Marked lightcurve |
|---|---|---|---|---|---|---|---|
| A | 7782 | 7617 | 0 | 0 | 0.00% | 0.00% | 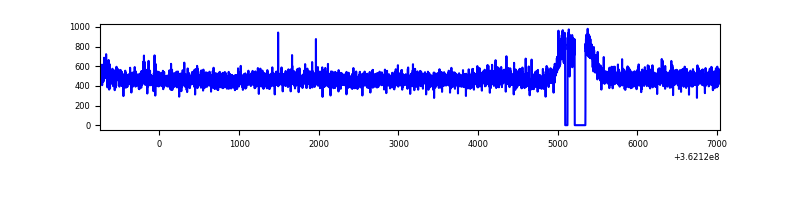 |
| B | 7783 | 7618 | 4 | 4 | 0.05% | 0.05% | 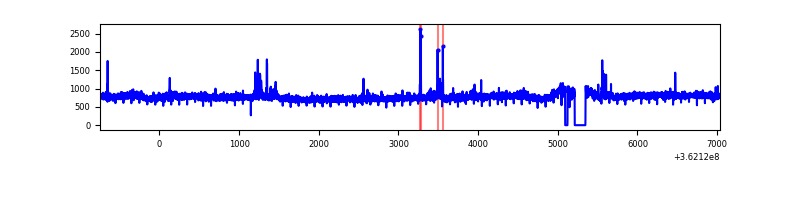 |
| C | 7783 | 7618 | 11 | 11 | 0.14% | 0.14% | 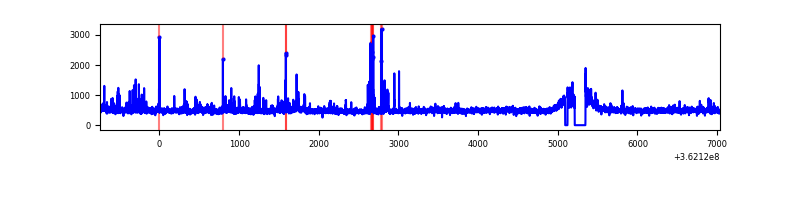 |
| D | 7783 | 7619 | 470 | 470 | 6.04% | 6.17% | 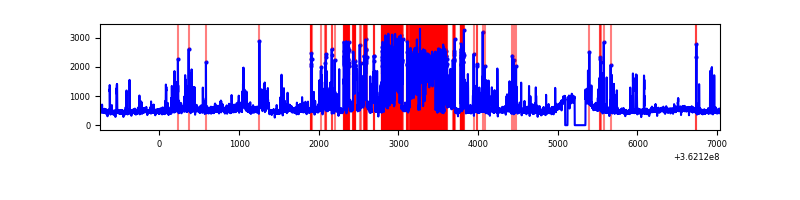 |
Top three noisy pixels from each quadrant. If the there are fewer than three noisy pixels in the level2.evt file, extra rows are filled as -1
| Pixel properties | Quadrant properties | ||||||
|---|---|---|---|---|---|---|---|
| Quadrant | DetID | PixID | Counts | Sigma | Mean | Median | Sigma |
| A | 13 | 254 | 14021 | 67.71 | 942 | 918 | 193.5 |
| A | 11 | 47 | 13227 | 63.6 | 942 | 918 | 193.5 |
| A | 3 | 137 | 9945 | 46.65 | 942 | 918 | 193.5 |
| B | 6 | 159 | 2114880 | 11679.03 | 927 | 901 | 181.0 |
| B | 0 | 190 | 63830 | 347.66 | 927 | 901 | 181.0 |
| B | 0 | 230 | 37801 | 203.86 | 927 | 901 | 181.0 |
| C | 0 | 10 | 242147 | 1133.64 | 899 | 904 | 212.8 |
| C | 14 | 238 | 143888 | 671.91 | 899 | 904 | 212.8 |
| C | 10 | 22 | 20538 | 92.26 | 899 | 904 | 212.8 |
| D | 12 | 218 | 1560576 | 7391.71 | 870 | 845 | 211.0 |
| D | 8 | 195 | 554968 | 2626.04 | 870 | 845 | 211.0 |
| D | 12 | 250 | 145898 | 687.42 | 870 | 845 | 211.0 |
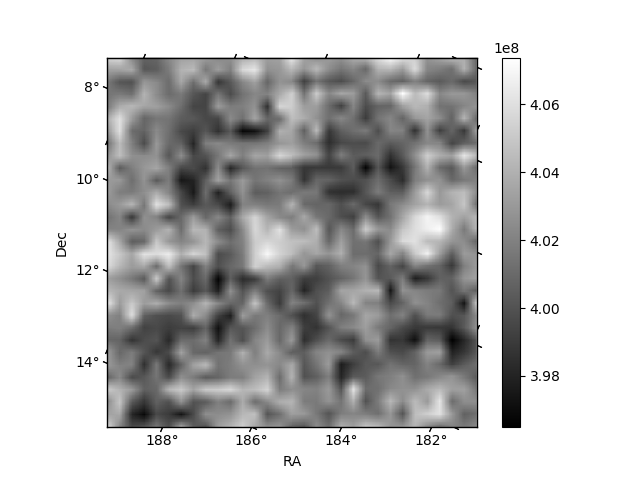
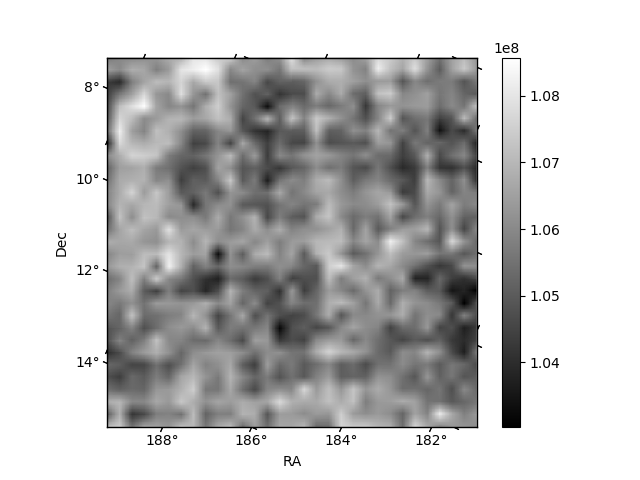
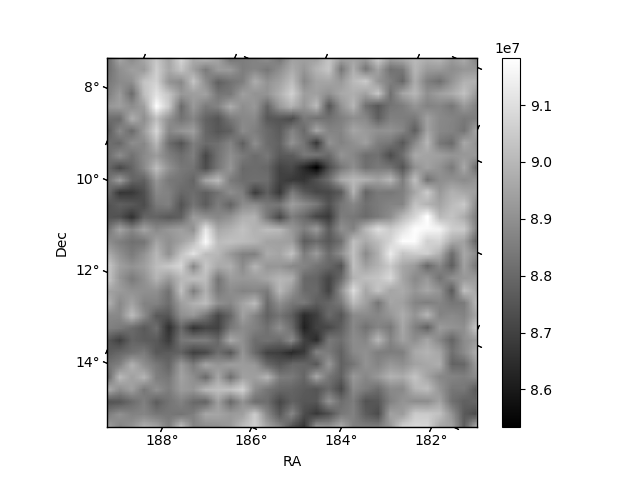
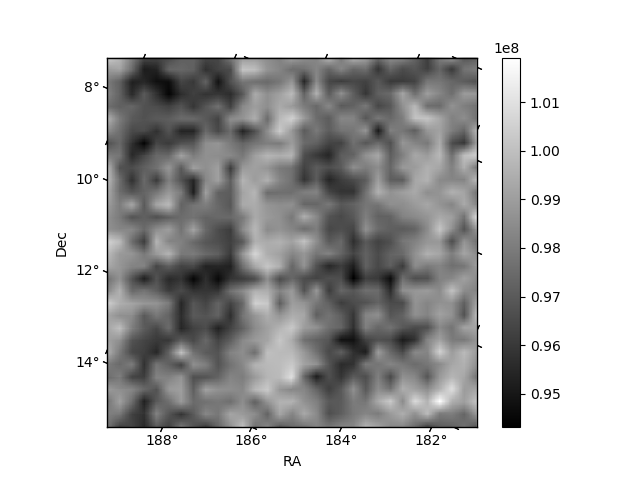
Histogram calculated using DETX and DETY for each event in the final _common_clean file
| Quadrant A | 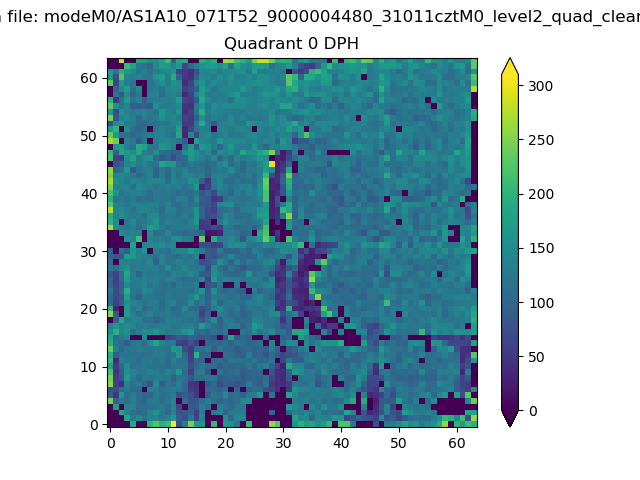 |
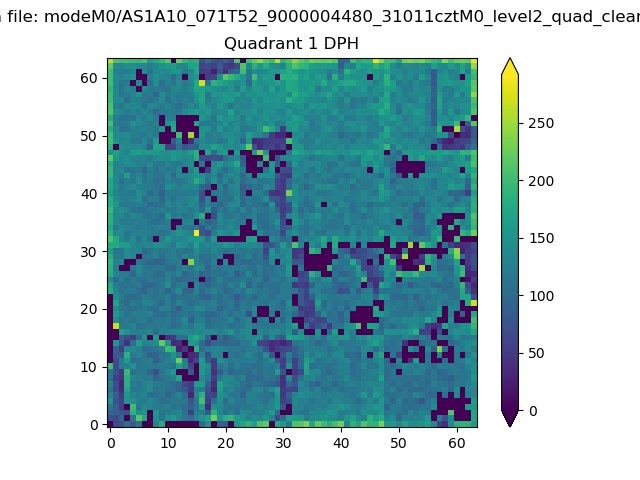 |
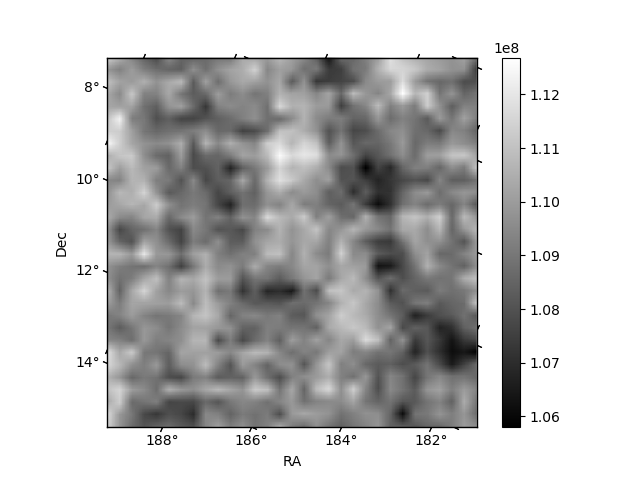
Quadrant B |
|---|---|---|---|
| Quadrant D | 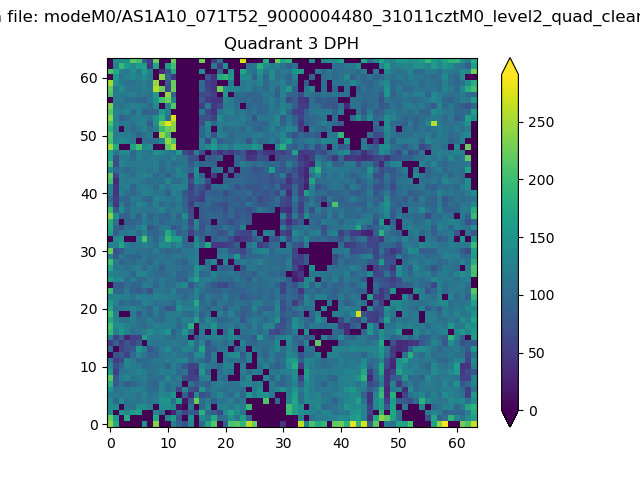 |
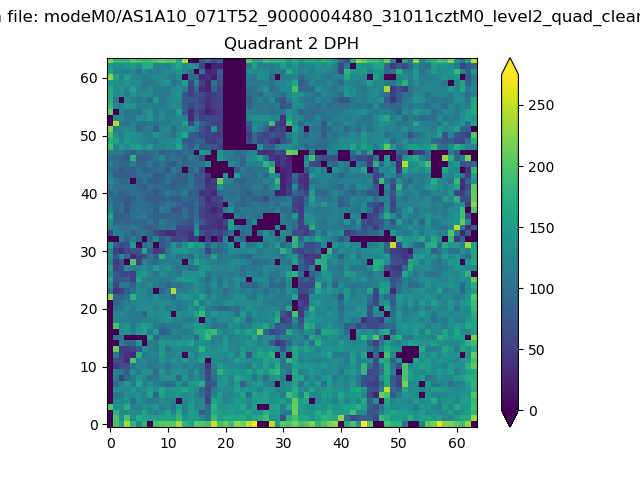 |
Quadrant C |
| Plot type | Count rate plots | Images |
|---|---|---|
| Comparison with Poisson distribution Blue bars denote a histogram of data divided into 1 sec bins. Red curve is a Poisson curve with rate = median count rate of data. |
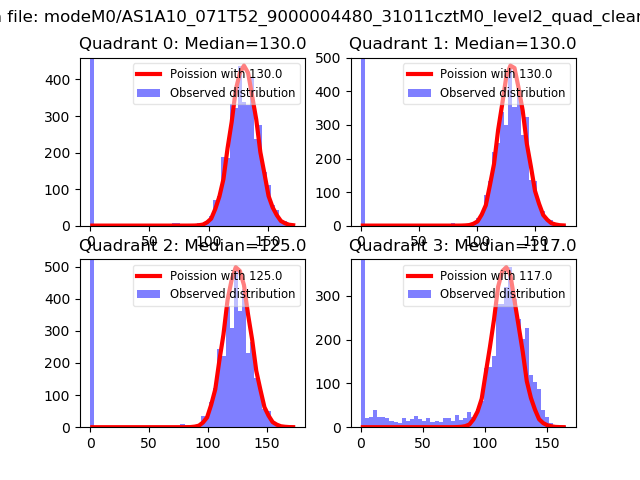 |
 |
| Quadrant-wise count rates Data is divided into 100 sec bins |
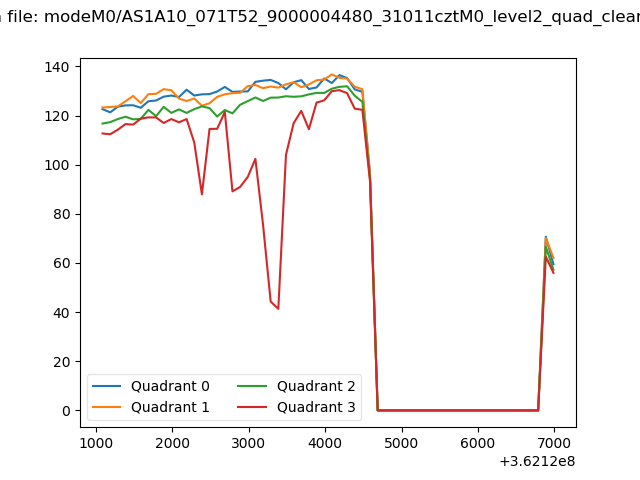 |
|
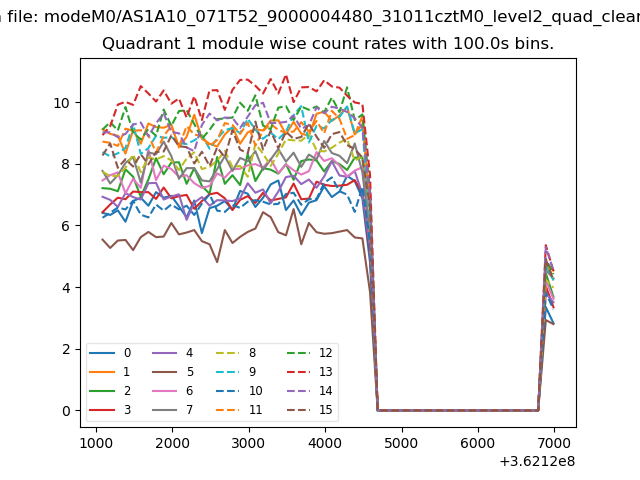
| Module-wise count rates for Quadrant A Data is divided into 100 sec bins |
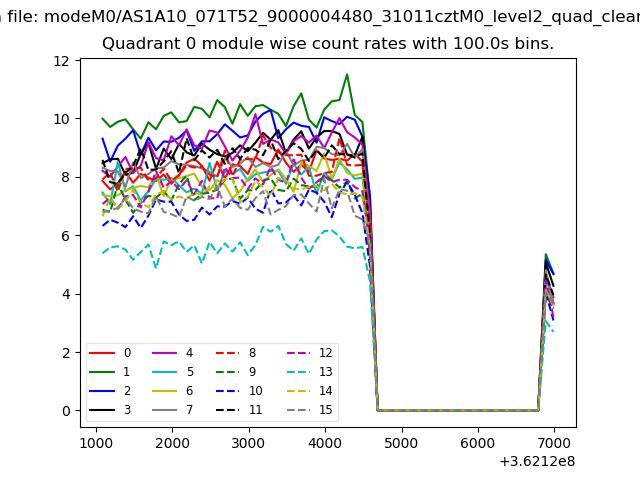 |
 |
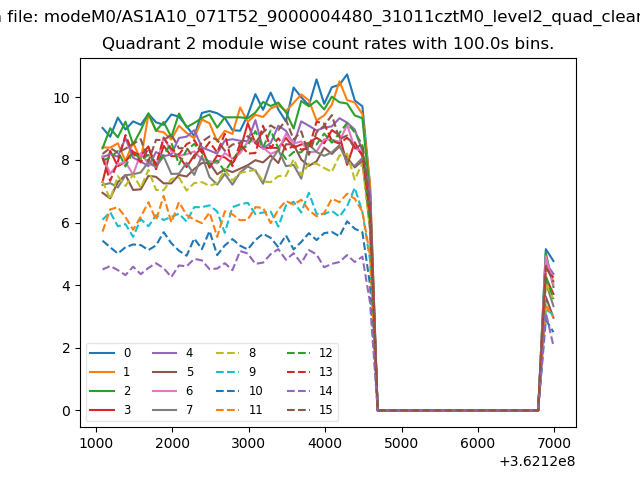
| Module-wise count rates for Quadrant B Data is divided into 100 sec bins |
 |
 |
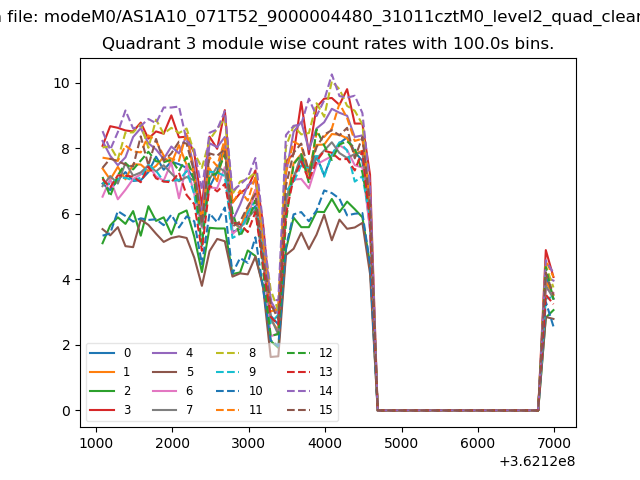
| Module-wise count rates for Quadrant C Data is divided into 100 sec bins |
 |
 |
| Module-wise count rates for Quadrant D Data is divided into 100 sec bins |
 |
 |
| Parameter | Plot |
|---|---|
| CZT HV Monitor | 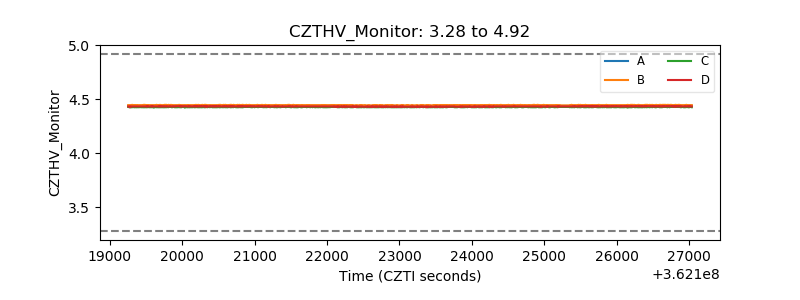 |
| D_VDD | 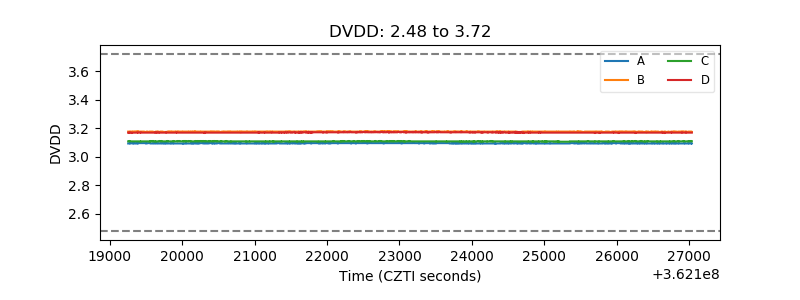 |
| Temperature 1 | 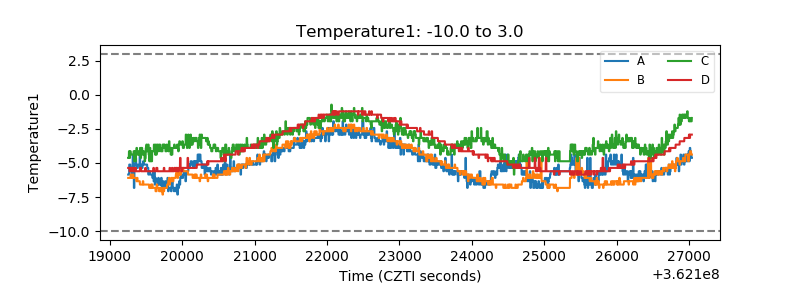 |
| Veto HV Monitor | 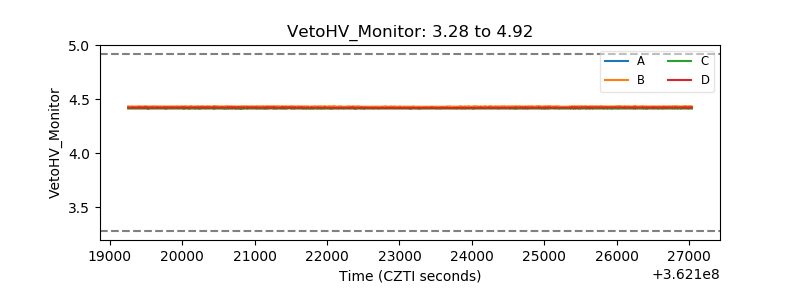 |
| Veto LLD |  |
| Alpha Counter | 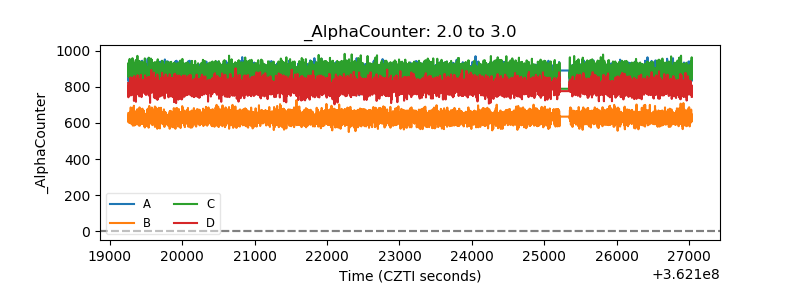 |
| _CPM_Rate | 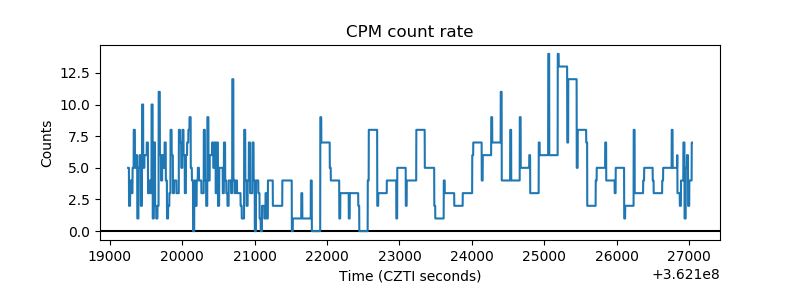 |
| CZT Counter | 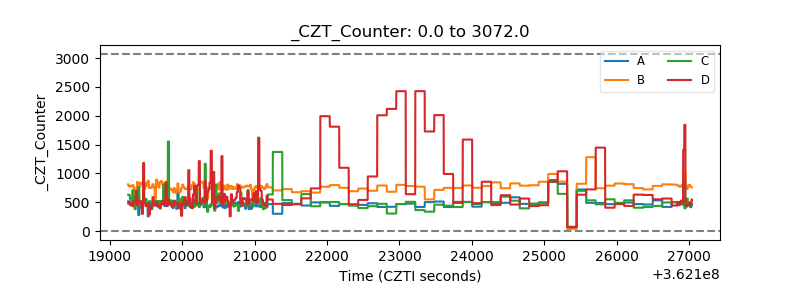 |
| +2.5 Volts monitor |  |
| +5 Volts monitor |  |
| _ROLL_ROT | 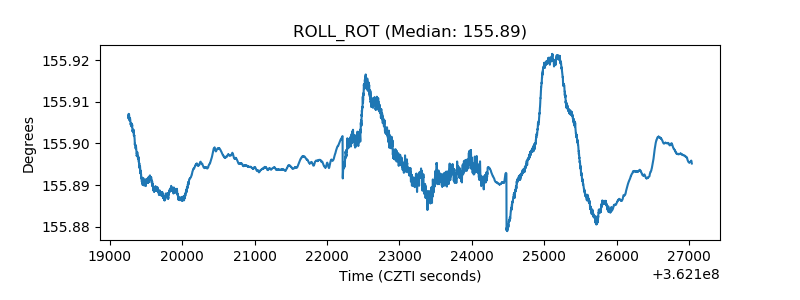 |
| _Roll_DEC | 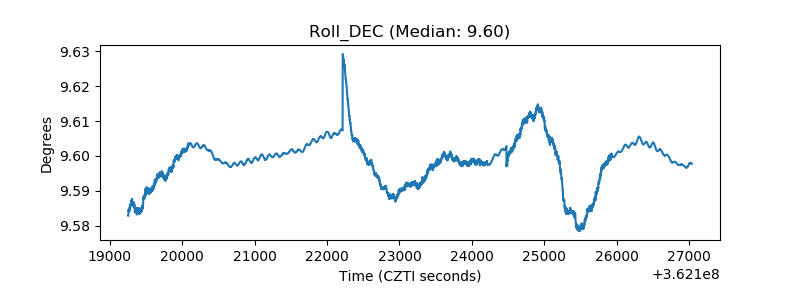 |
| _Roll_RA | 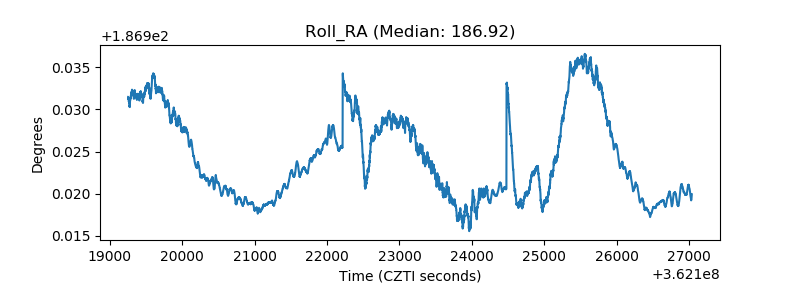 |
| Veto Counter | 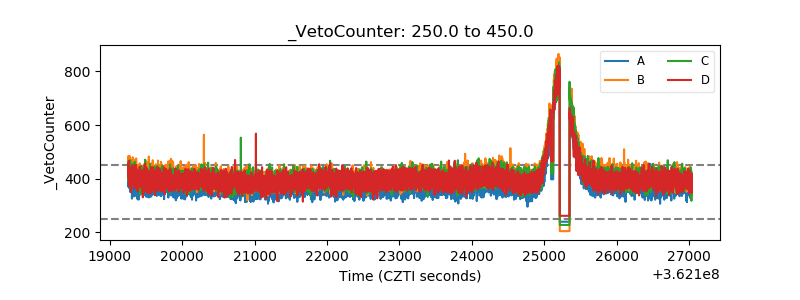 |