| Param | Original file | Final file |
|---|---|---|
| Filename | modeM0/AS1A10_071T52_9000004480_31014cztM0_level2.evt | modeM0/AS1A10_071T52_9000004480_31014cztM0_level2_quad_clean.evt |
| Size (bytes) | 1,548,339,840 | 241,551,360 |
| Size | 1.4 GB | 230.4 MB |
| Events in quadrant A | 9,132,772 | 1,547,760 |
| Events in quadrant B | 14,921,960 | 1,531,779 |
| Events in quadrant C | 10,042,262 | 1,475,533 |
| Events in quadrant D | 11,508,130 | 1,446,804 |
| Mode M0 | |||
|---|---|---|---|
| Quadrant | BADHDUFLAG | Total packets | Discarded packets |
| A | 0 | 39288 | 4 |
| B | 0 | 58162 | 4 |
| C | 0 | 41584 | 4 |
| D | 0 | 46267 | 4 |
| Mode M9 | |||
|---|---|---|---|
| Quadrant | BADHDUFLAG | Total packets | Discarded packets |
| A | 0 | 20 | 0 |
| B | 0 | 20 | 0 |
| C | 0 | 20 | 0 |
| D | 0 | 20 | 0 |
| Mode SS | |||
|---|---|---|---|
| Quadrant | BADHDUFLAG | Total packets | Discarded packets |
| A | 0 | 388 | 0 |
| B | 0 | 388 | 0 |
| C | 0 | 388 | 0 |
| D | 0 | 388 | 0 |
| Quadrant | Total seconds | Saturated seconds | Saturation percentage |
|---|---|---|---|
| A | 19084 | 434 | 2.274156% |
| B | 19085 | 673 | 3.526330% |
| C | 19085 | 721 | 3.777836% |
| D | 19085 | 480 | 2.515064% |
Noise dominated data is calculated using 1-second bins in cleaned event files. If a bin has >2000 counts, and if more than 50% of those come from <1% of pixels, then it is considered to be noise-dominated and hence unusable.
| Quadrant | # 1 sec bins | Bins with >0 counts | Bins with >2000 counts | High rate bins dominated by noise | Noise dominated (total time) | Noise dominated (detector-on time) | Marked lightcurve |
|---|---|---|---|---|---|---|---|
| A | 21039 | 19085 | 0 | 0 | 0.00% | 0.00% | 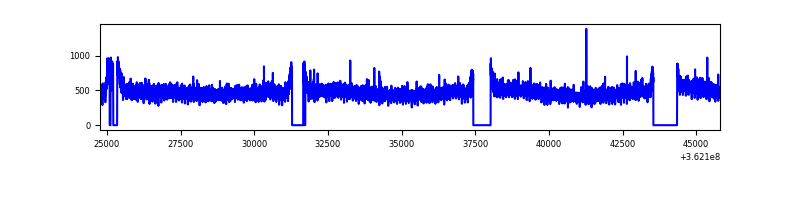 |
| B | 21040 | 19086 | 8 | 8 | 0.04% | 0.04% | 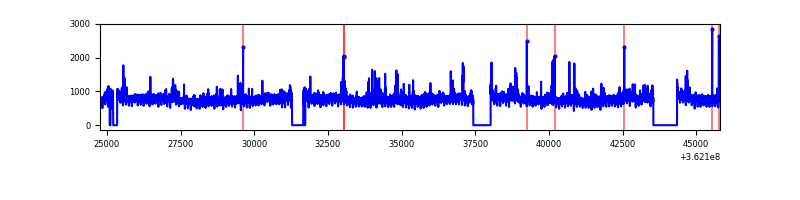 |
| C | 21040 | 19085 | 73 | 73 | 0.35% | 0.38% | 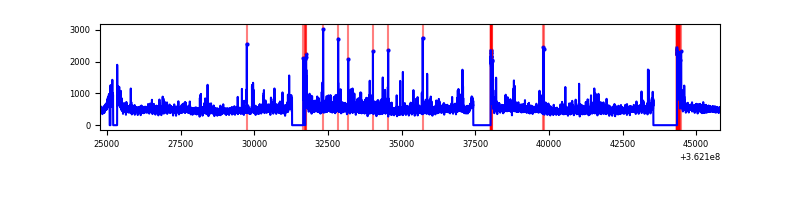 |
| D | 21040 | 19087 | 137 | 137 | 0.65% | 0.72% | 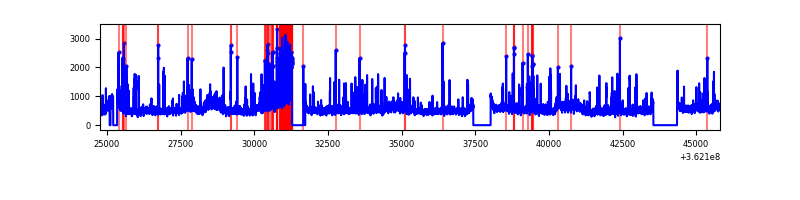 |
Top three noisy pixels from each quadrant. If the there are fewer than three noisy pixels in the level2.evt file, extra rows are filled as -1
| Pixel properties | Quadrant properties | ||||||
|---|---|---|---|---|---|---|---|
| Quadrant | DetID | PixID | Counts | Sigma | Mean | Median | Sigma |
| A | 13 | 254 | 34371 | 67.32 | 2367 | 2316 | 476.2 |
| A | 3 | 137 | 24617 | 46.83 | 2367 | 2316 | 476.2 |
| A | 0 | 226 | 20006 | 37.15 | 2367 | 2316 | 476.2 |
| B | 6 | 159 | 5281276 | 11785.89 | 2322 | 2260 | 447.9 |
| B | 0 | 190 | 151666 | 333.56 | 2322 | 2260 | 447.9 |
| B | 0 | 183 | 119928 | 262.7 | 2322 | 2260 | 447.9 |
| C | 0 | 10 | 866198 | 1637.1 | 2244 | 2256 | 527.7 |
| C | 14 | 238 | 357240 | 672.66 | 2244 | 2256 | 527.7 |
| C | 2 | 114 | 44222 | 79.52 | 2244 | 2256 | 527.7 |
| D | 8 | 195 | 1946078 | 3586.01 | 2275 | 2215 | 542.1 |
| D | 12 | 218 | 548433 | 1007.66 | 2275 | 2215 | 542.1 |
| D | 2 | 250 | 285164 | 521.98 | 2275 | 2215 | 542.1 |
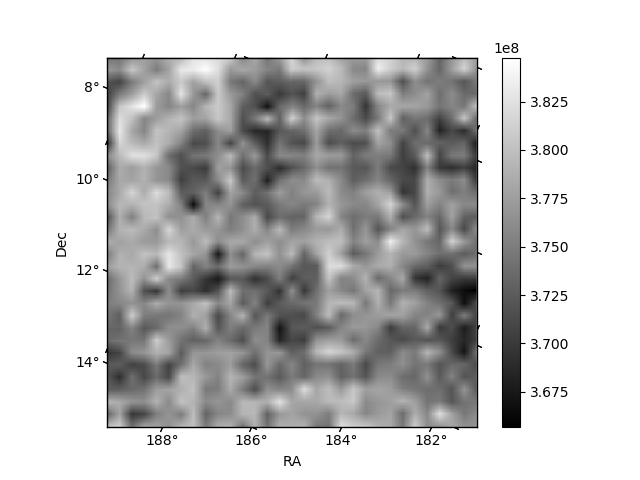
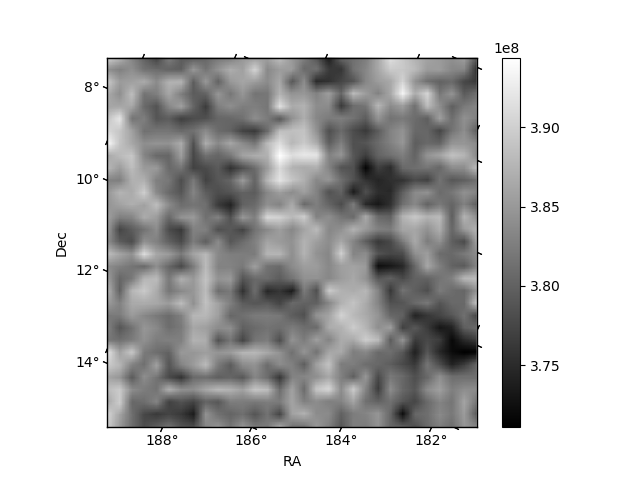
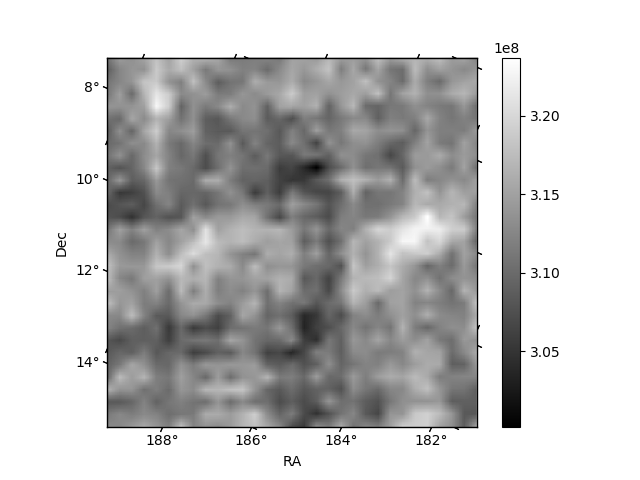
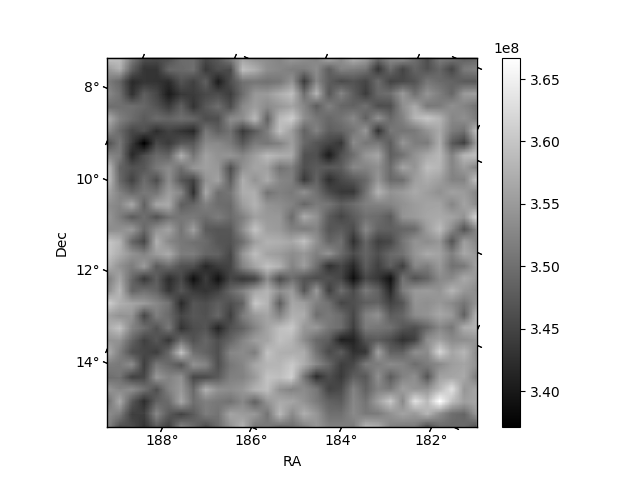
Histogram calculated using DETX and DETY for each event in the final _common_clean file
| Quadrant A |  |
 |
Quadrant B |
|---|---|---|---|
| Quadrant D | 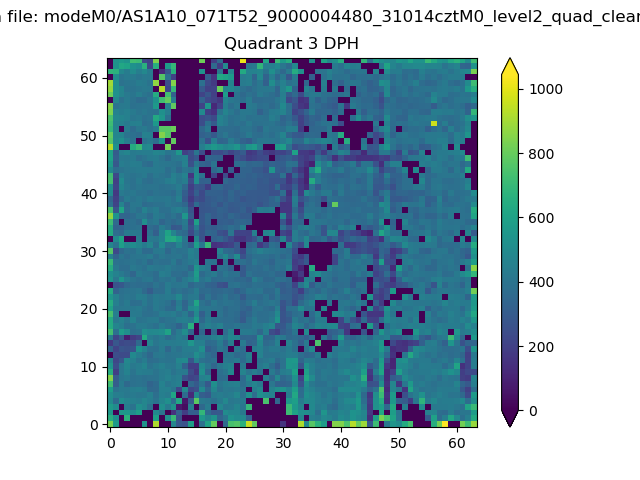 |
 |
Quadrant C |
| Plot type | Count rate plots | Images |
|---|---|---|
| Comparison with Poisson distribution Blue bars denote a histogram of data divided into 1 sec bins. Red curve is a Poisson curve with rate = median count rate of data. |
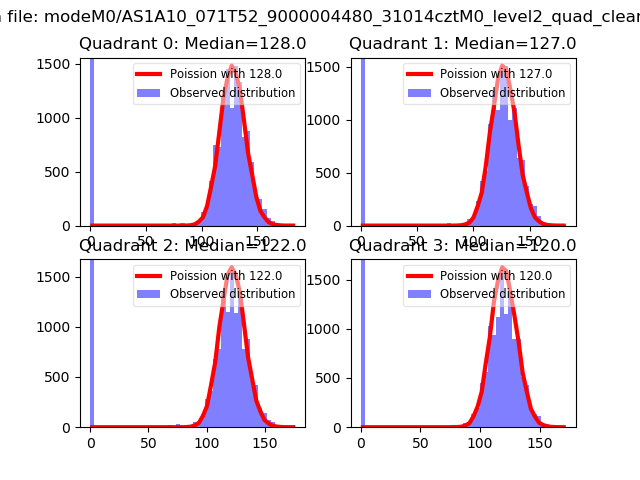 |
 |
| Quadrant-wise count rates Data is divided into 100 sec bins |
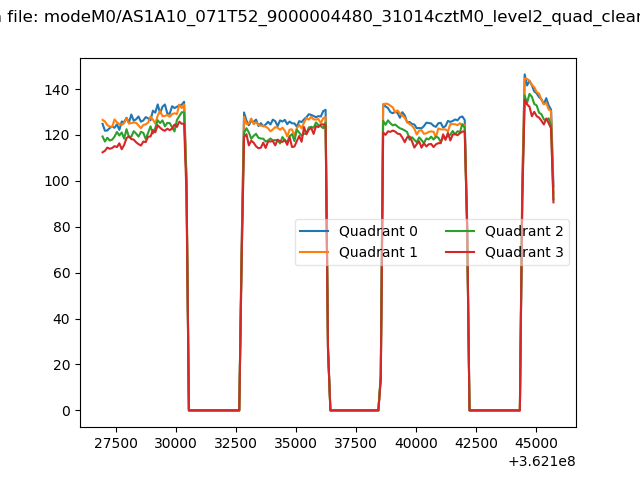 |
|
| Module-wise count rates for Quadrant A Data is divided into 100 sec bins |
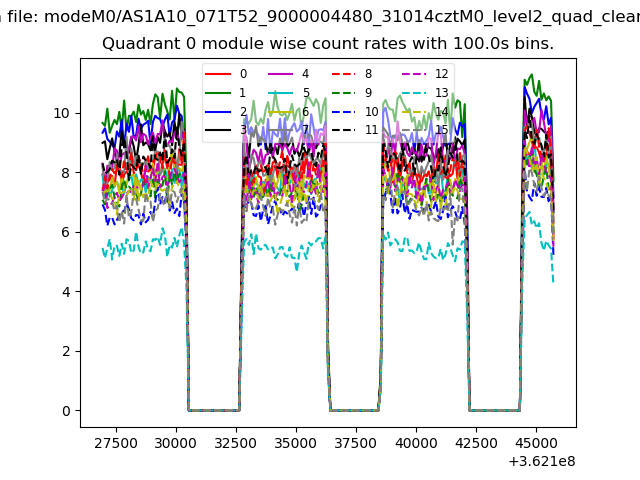 |
 |
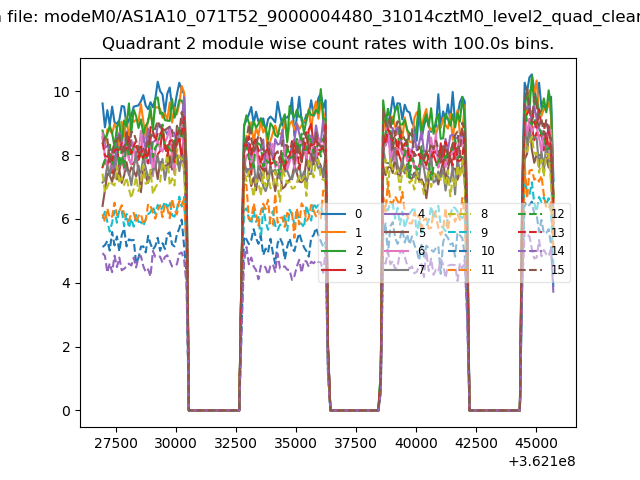
| Module-wise count rates for Quadrant B Data is divided into 100 sec bins |
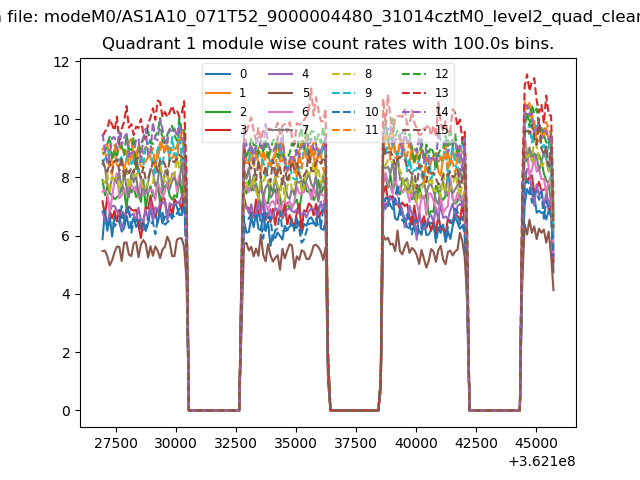 |
 |
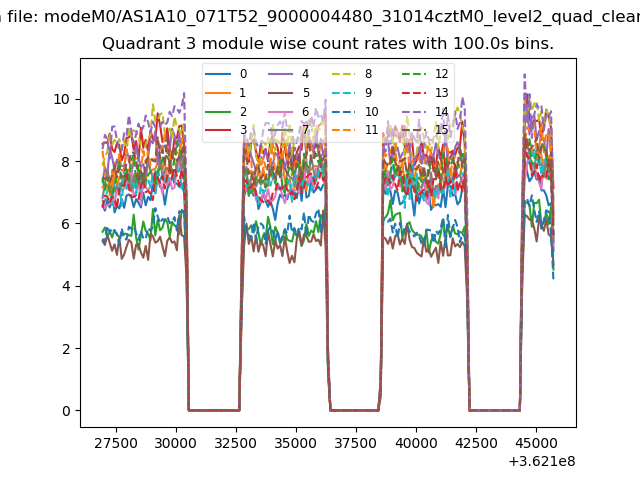
| Module-wise count rates for Quadrant C Data is divided into 100 sec bins |
 |
 |
| Module-wise count rates for Quadrant D Data is divided into 100 sec bins |
 |
 |
| Parameter | Plot |
|---|---|
| CZT HV Monitor |  |
| D_VDD | 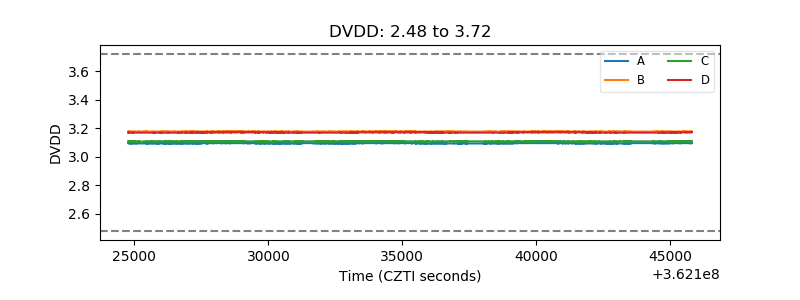 |
| Temperature 1 | 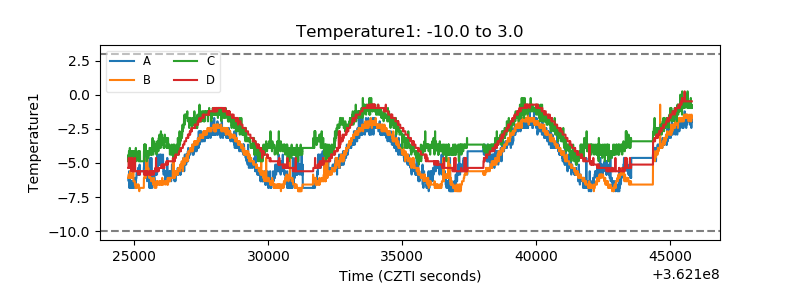 |
| Veto HV Monitor | 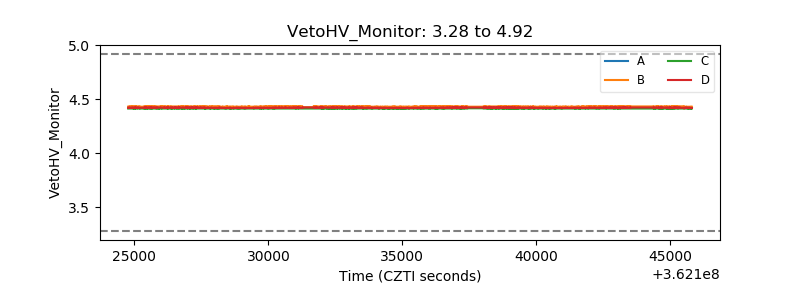 |
| Veto LLD | 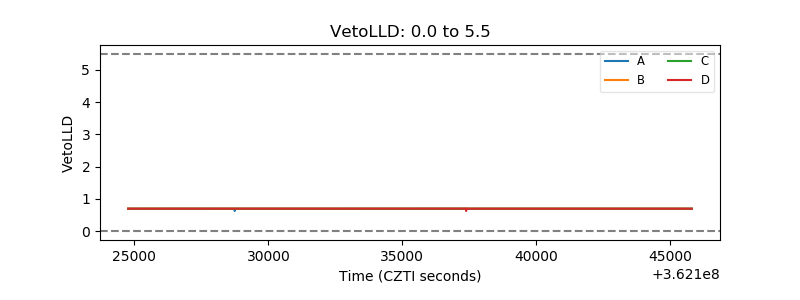 |
| Alpha Counter | 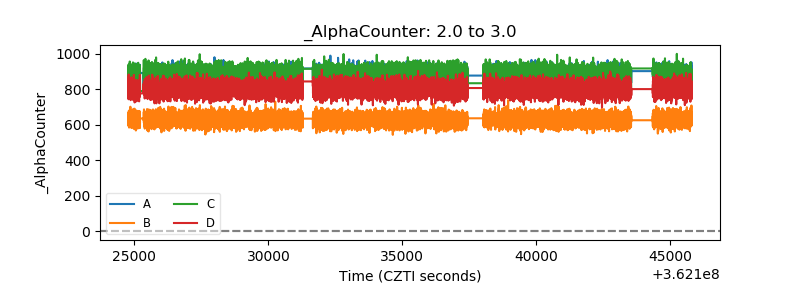 |
| _CPM_Rate | 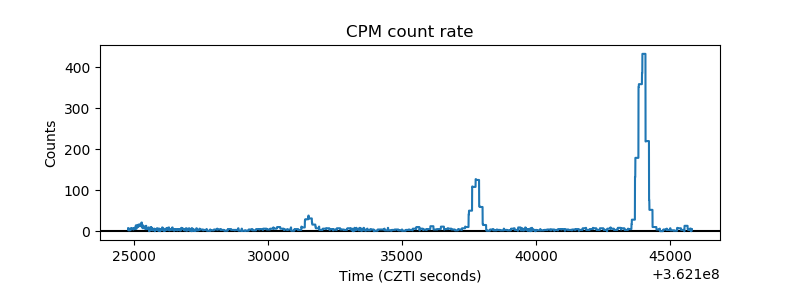 |
| CZT Counter | 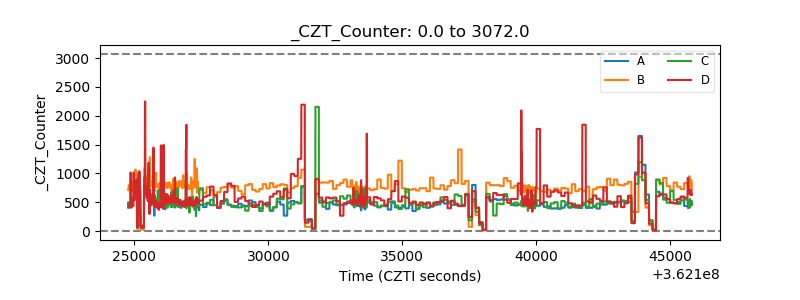 |
| +2.5 Volts monitor |  |
| +5 Volts monitor |  |
| _ROLL_ROT | 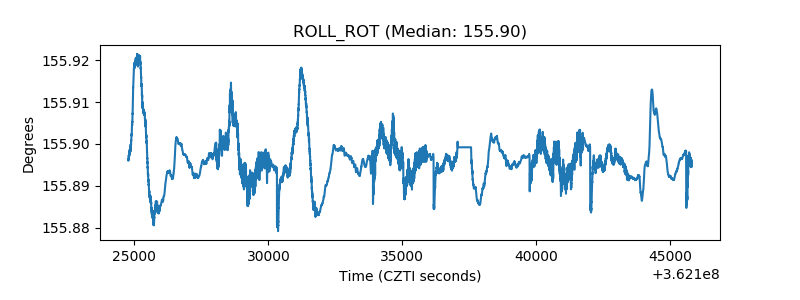 |
| _Roll_DEC | 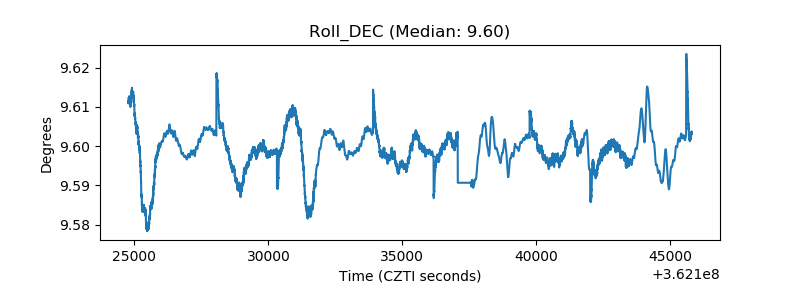 |
| _Roll_RA | 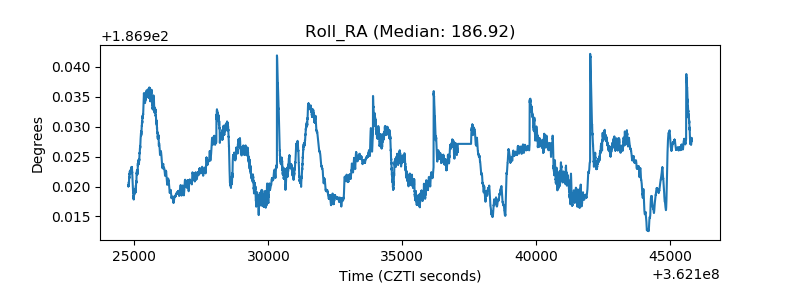 |
| Veto Counter | 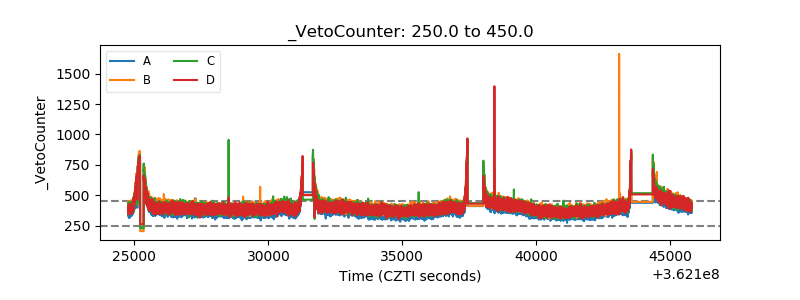 |