| Param | Original file | Final file |
|---|---|---|
| Filename | modeM0/AS1A10_071T52_9000004480_31015cztM0_level2.evt | modeM0/AS1A10_071T52_9000004480_31015cztM0_level2_quad_clean.evt |
| Size (bytes) | 497,946,240 | 90,823,680 |
| Size | 474.9 MB | 86.6 MB |
| Events in quadrant A | 2,921,736 | 603,496 |
| Events in quadrant B | 4,817,136 | 592,595 |
| Events in quadrant C | 3,016,638 | 571,044 |
| Events in quadrant D | 3,913,191 | 559,181 |
| Mode M0 | |||
|---|---|---|---|
| Quadrant | BADHDUFLAG | Total packets | Discarded packets |
| A | 0 | 12672 | 1 |
| B | 0 | 18646 | 1 |
| C | 0 | 12852 | 1 |
| D | 0 | 15584 | 1 |
| Mode M9 | |||
|---|---|---|---|
| Quadrant | BADHDUFLAG | Total packets | Discarded packets |
| A | 0 | 10 | 0 |
| B | 0 | 10 | 0 |
| C | 0 | 10 | 0 |
| D | 0 | 10 | 0 |
| Mode SS | |||
|---|---|---|---|
| Quadrant | BADHDUFLAG | Total packets | Discarded packets |
| A | 0 | 122 | 0 |
| B | 0 | 122 | 0 |
| C | 0 | 122 | 0 |
| D | 0 | 122 | 0 |
| Quadrant | Total seconds | Saturated seconds | Saturation percentage |
|---|---|---|---|
| A | 6077 | 59 | 0.970874% |
| B | 6078 | 113 | 1.859164% |
| C | 6078 | 130 | 2.138861% |
| D | 6078 | 108 | 1.776900% |
Noise dominated data is calculated using 1-second bins in cleaned event files. If a bin has >2000 counts, and if more than 50% of those come from <1% of pixels, then it is considered to be noise-dominated and hence unusable.
| Quadrant | # 1 sec bins | Bins with >0 counts | Bins with >2000 counts | High rate bins dominated by noise | Noise dominated (total time) | Noise dominated (detector-on time) | Marked lightcurve |
|---|---|---|---|---|---|---|---|
| A | 7052 | 6077 | 0 | 0 | 0.00% | 0.00% | 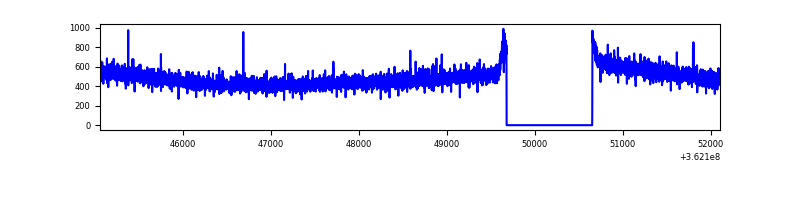 |
| B | 7053 | 6078 | 9 | 9 | 0.13% | 0.15% | 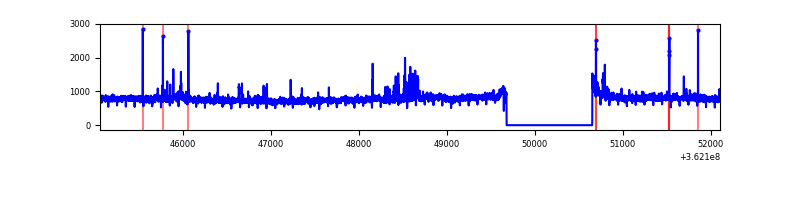 |
| C | 7053 | 6078 | 16 | 16 | 0.23% | 0.26% | 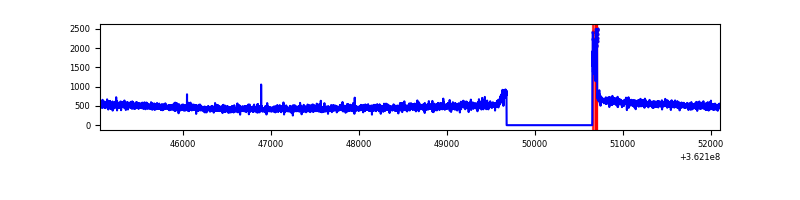 |
| D | 7053 | 6078 | 68 | 68 | 0.96% | 1.12% | 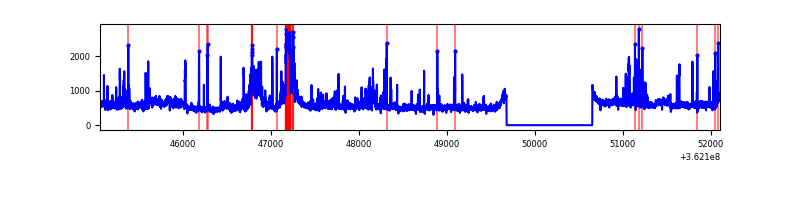 |
Top three noisy pixels from each quadrant. If the there are fewer than three noisy pixels in the level2.evt file, extra rows are filled as -1
| Pixel properties | Quadrant properties | ||||||
|---|---|---|---|---|---|---|---|
| Quadrant | DetID | PixID | Counts | Sigma | Mean | Median | Sigma |
| A | 13 | 254 | 10785 | 65.73 | 757 | 741 | 152.8 |
| A | 3 | 137 | 7365 | 43.35 | 757 | 741 | 152.8 |
| A | 0 | 226 | 6555 | 38.05 | 757 | 741 | 152.8 |
| B | 6 | 159 | 1715002 | 11953.16 | 740 | 723 | 143.4 |
| B | 0 | 190 | 58527 | 403.05 | 740 | 723 | 143.4 |
| B | 4 | 80 | 37366 | 255.5 | 740 | 723 | 143.4 |
| C | 14 | 238 | 114737 | 669.23 | 720 | 724 | 170.4 |
| C | 0 | 10 | 66953 | 388.75 | 720 | 724 | 170.4 |
| C | 2 | 114 | 14312 | 79.76 | 720 | 724 | 170.4 |
| D | 8 | 195 | 633609 | 3625.91 | 729 | 712 | 174.5 |
| D | 12 | 33 | 306571 | 1752.29 | 729 | 712 | 174.5 |
| D | 2 | 250 | 86969 | 494.17 | 729 | 712 | 174.5 |
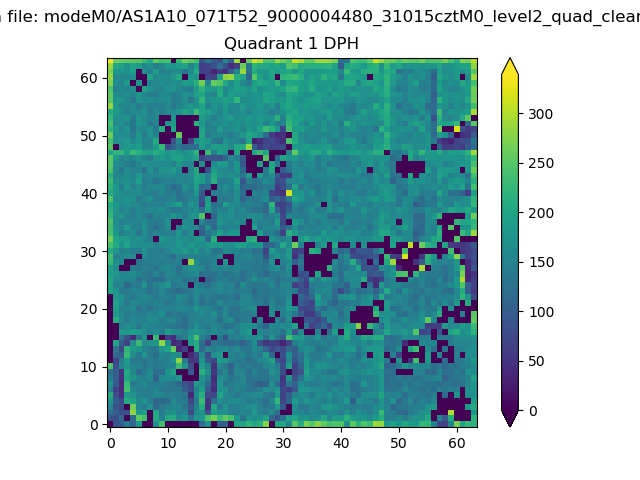
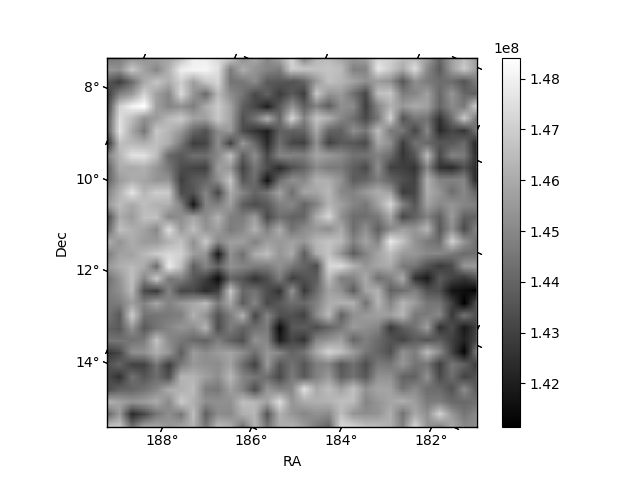
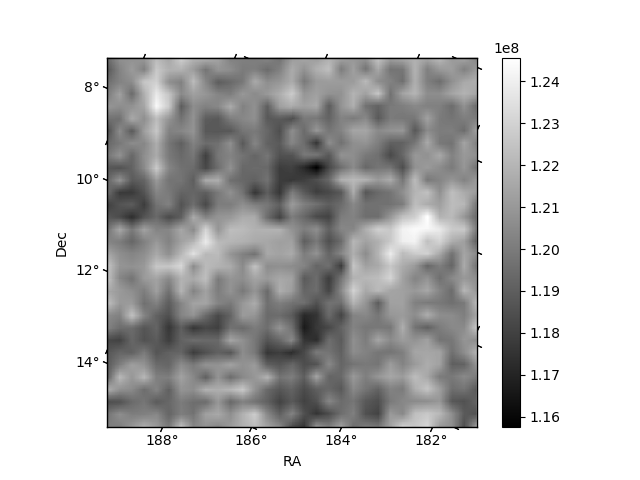
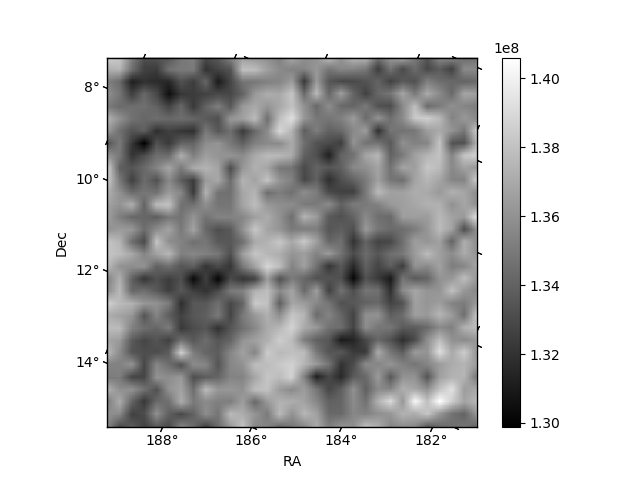
Histogram calculated using DETX and DETY for each event in the final _common_clean file
| Quadrant A |  |
 |
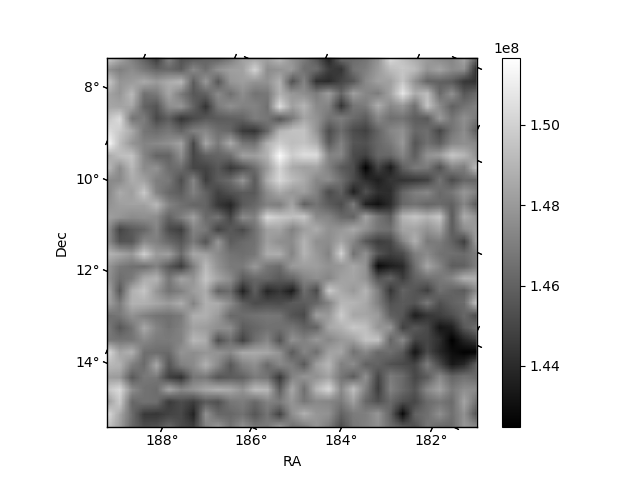
Quadrant B |
|---|---|---|---|
| Quadrant D | 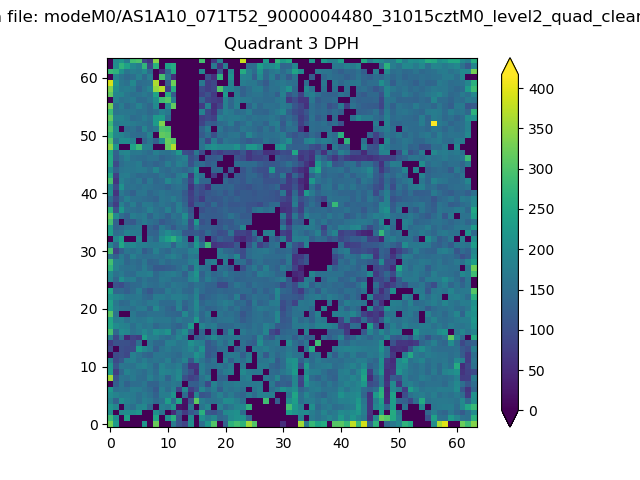 |
 |
Quadrant C |
| Plot type | Count rate plots | Images |
|---|---|---|
| Comparison with Poisson distribution Blue bars denote a histogram of data divided into 1 sec bins. Red curve is a Poisson curve with rate = median count rate of data. |
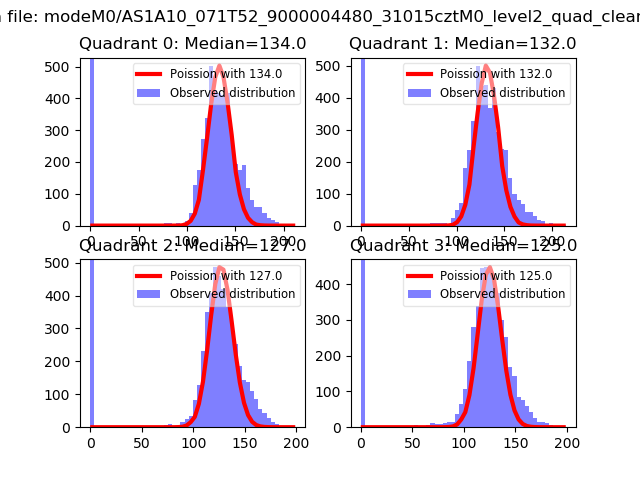 |
 |
| Quadrant-wise count rates Data is divided into 100 sec bins |
 |
|
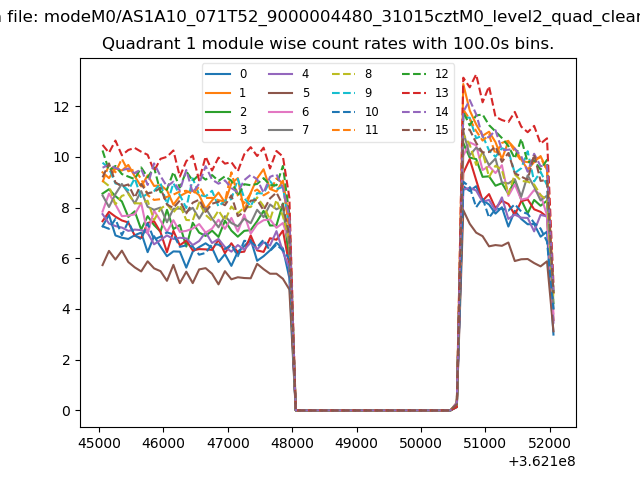
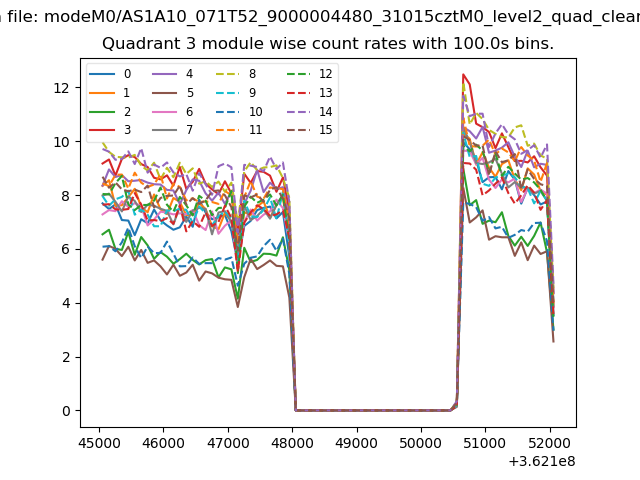
| Module-wise count rates for Quadrant A Data is divided into 100 sec bins |
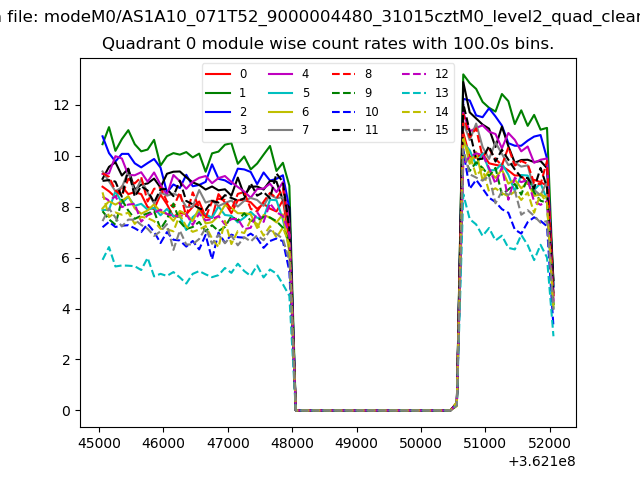 |
 |
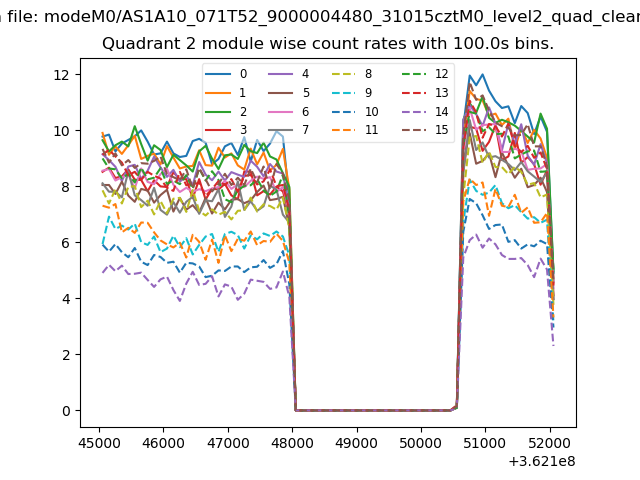
| Module-wise count rates for Quadrant B Data is divided into 100 sec bins |
 |
 |
| Module-wise count rates for Quadrant C Data is divided into 100 sec bins |
 |
 |
| Module-wise count rates for Quadrant D Data is divided into 100 sec bins |
 |
 |
| Parameter | Plot |
|---|---|
| CZT HV Monitor | 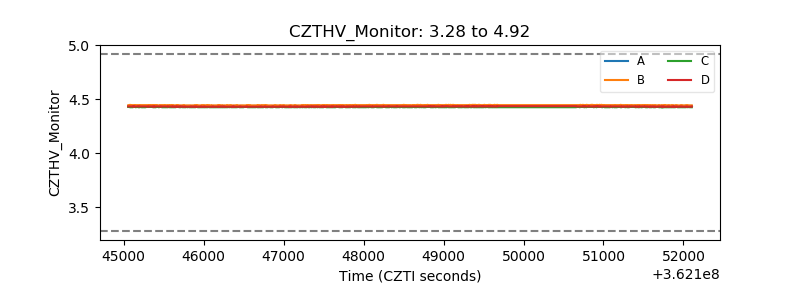 |
| D_VDD | 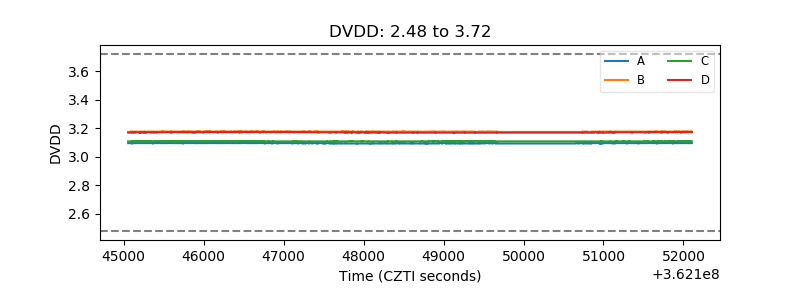 |
| Temperature 1 | 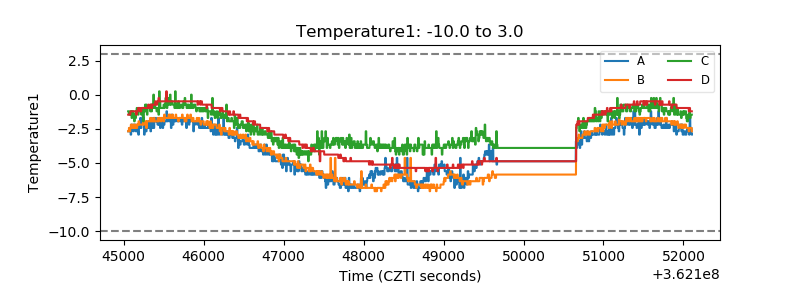 |
| Veto HV Monitor | 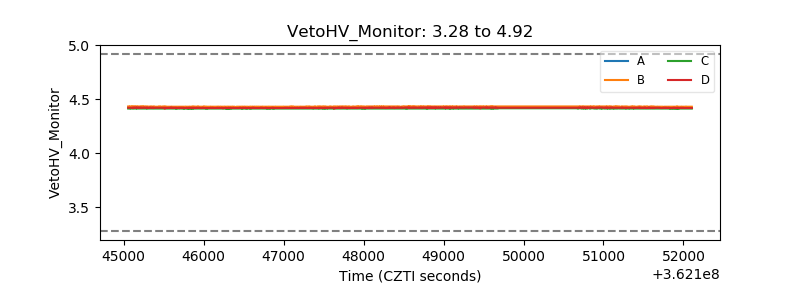 |
| Veto LLD | 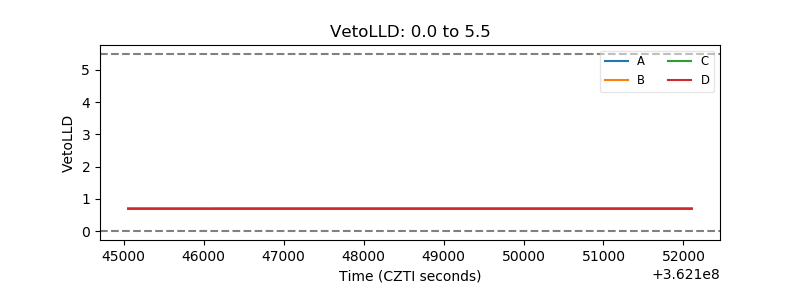 |
| Alpha Counter | 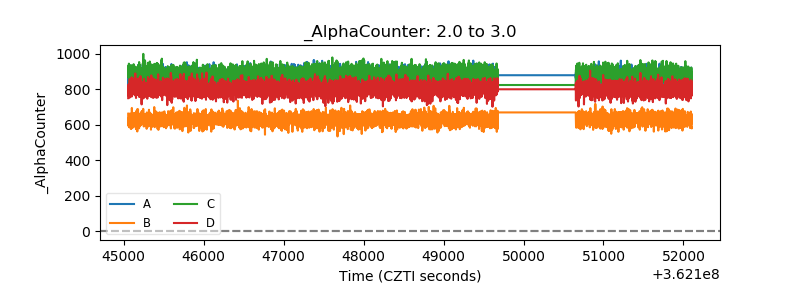 |
| _CPM_Rate | 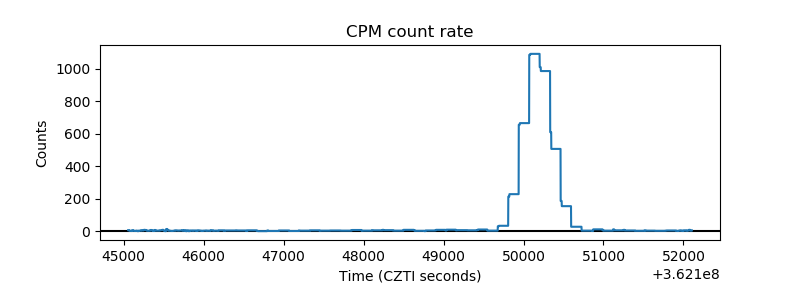 |
| CZT Counter |  |
| +2.5 Volts monitor |  |
| +5 Volts monitor |  |
| _ROLL_ROT | 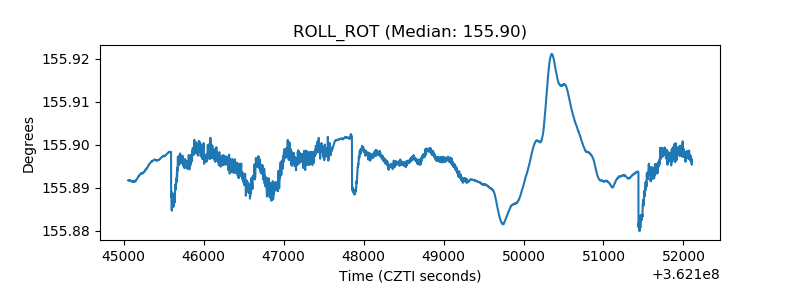 |
| _Roll_DEC | 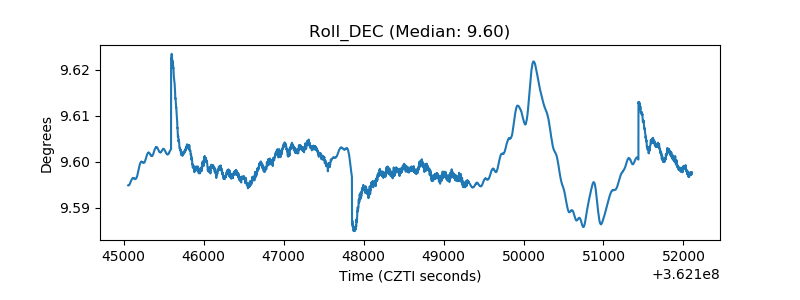 |
| _Roll_RA |  |
| Veto Counter | 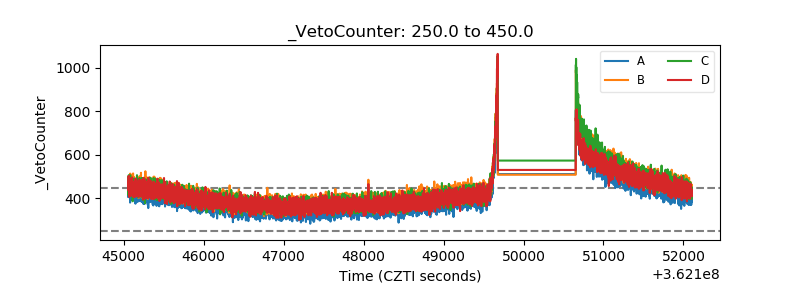 |