| Param | Original file | Final file |
|---|---|---|
| Filename | modeM0/AS1A10_071T52_9000004480_31017cztM0_level2.evt | modeM0/AS1A10_071T52_9000004480_31017cztM0_level2_quad_clean.evt |
| Size (bytes) | 522,990,720 | 94,705,920 |
| Size | 498.8 MB | 90.3 MB |
| Events in quadrant A | 3,107,829 | 630,571 |
| Events in quadrant B | 5,019,392 | 622,420 |
| Events in quadrant C | 3,236,762 | 594,817 |
| Events in quadrant D | 4,052,136 | 584,729 |
| Mode M0 | |||
|---|---|---|---|
| Quadrant | BADHDUFLAG | Total packets | Discarded packets |
| A | 0 | 13282 | 1 |
| B | 0 | 19254 | 1 |
| C | 0 | 13567 | 1 |
| D | 0 | 16254 | 1 |
| Mode M9 | |||
|---|---|---|---|
| Quadrant | BADHDUFLAG | Total packets | Discarded packets |
| A | 0 | 11 | 0 |
| B | 0 | 11 | 0 |
| C | 0 | 11 | 0 |
| D | 0 | 11 | 0 |
| Mode SS | |||
|---|---|---|---|
| Quadrant | BADHDUFLAG | Total packets | Discarded packets |
| A | 0 | 126 | 0 |
| B | 0 | 126 | 0 |
| C | 0 | 126 | 0 |
| D | 0 | 126 | 0 |
| Quadrant | Total seconds | Saturated seconds | Saturation percentage |
|---|---|---|---|
| A | 6243 | 60 | 0.961076% |
| B | 6244 | 120 | 1.921845% |
| C | 6244 | 134 | 2.146060% |
| D | 6244 | 80 | 1.281230% |
Noise dominated data is calculated using 1-second bins in cleaned event files. If a bin has >2000 counts, and if more than 50% of those come from <1% of pixels, then it is considered to be noise-dominated and hence unusable.
| Quadrant | # 1 sec bins | Bins with >0 counts | Bins with >2000 counts | High rate bins dominated by noise | Noise dominated (total time) | Noise dominated (detector-on time) | Marked lightcurve |
|---|---|---|---|---|---|---|---|
| A | 7363 | 6243 | 3 | 3 | 0.04% | 0.05% | 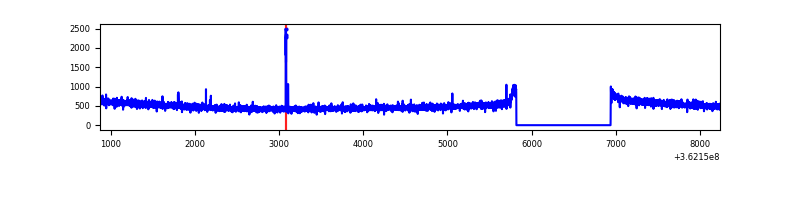 |
| B | 7364 | 6244 | 9 | 9 | 0.12% | 0.14% | 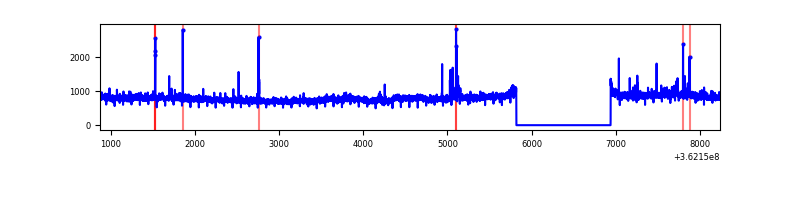 |
| C | 7364 | 6244 | 27 | 27 | 0.37% | 0.43% | 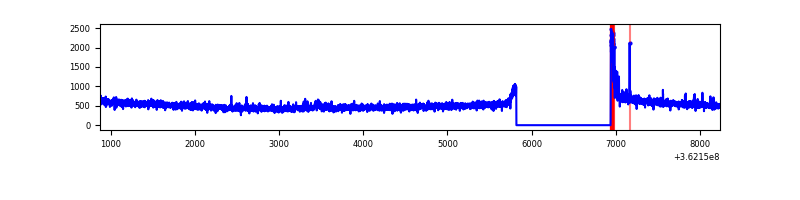 |
| D | 7364 | 6244 | 34 | 34 | 0.46% | 0.54% | 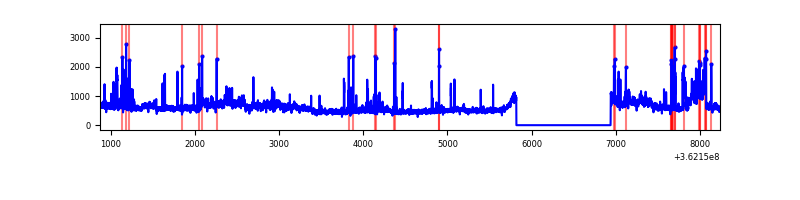 |
Top three noisy pixels from each quadrant. If the there are fewer than three noisy pixels in the level2.evt file, extra rows are filled as -1
| Pixel properties | Quadrant properties | ||||||
|---|---|---|---|---|---|---|---|
| Quadrant | DetID | PixID | Counts | Sigma | Mean | Median | Sigma |
| A | 5 | 168 | 15183 | 90.36 | 801 | 786 | 159.3 |
| A | 13 | 254 | 12185 | 71.55 | 801 | 786 | 159.3 |
| A | 3 | 137 | 7724 | 43.55 | 801 | 786 | 159.3 |
| B | 6 | 159 | 1764151 | 11627.03 | 790 | 770 | 151.7 |
| B | 0 | 190 | 54079 | 351.5 | 790 | 770 | 151.7 |
| B | 0 | 183 | 25107 | 160.47 | 790 | 770 | 151.7 |
| C | 14 | 238 | 122939 | 681.89 | 762 | 768 | 179.2 |
| C | 0 | 10 | 89231 | 493.75 | 762 | 768 | 179.2 |
| C | 3 | 233 | 20471 | 109.97 | 762 | 768 | 179.2 |
| D | 8 | 195 | 773140 | 4157.17 | 776 | 756 | 185.8 |
| D | 13 | 174 | 158947 | 851.43 | 776 | 756 | 185.8 |
| D | 2 | 250 | 88431 | 471.89 | 776 | 756 | 185.8 |
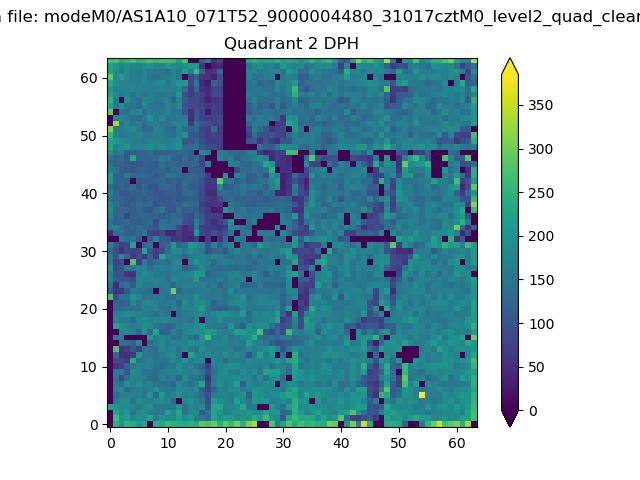
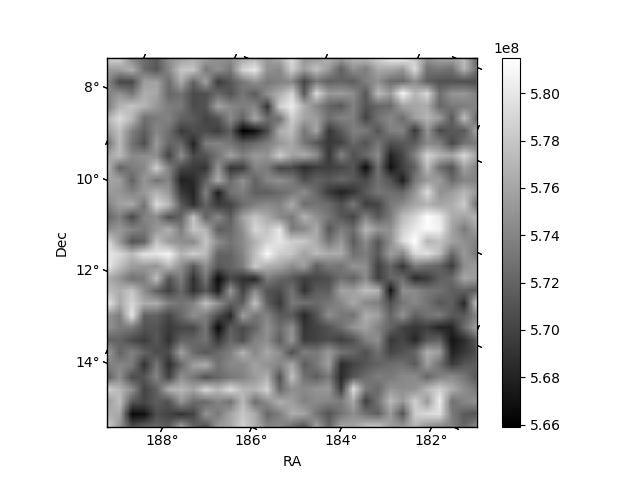
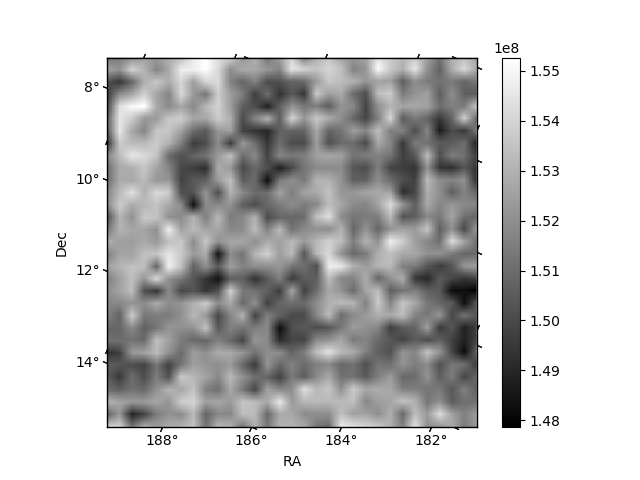
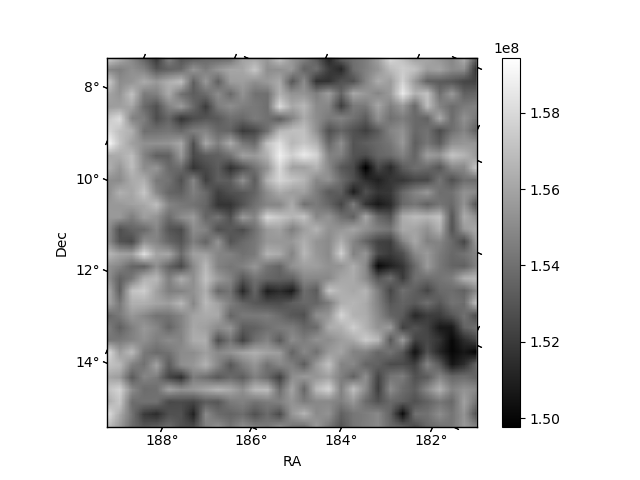
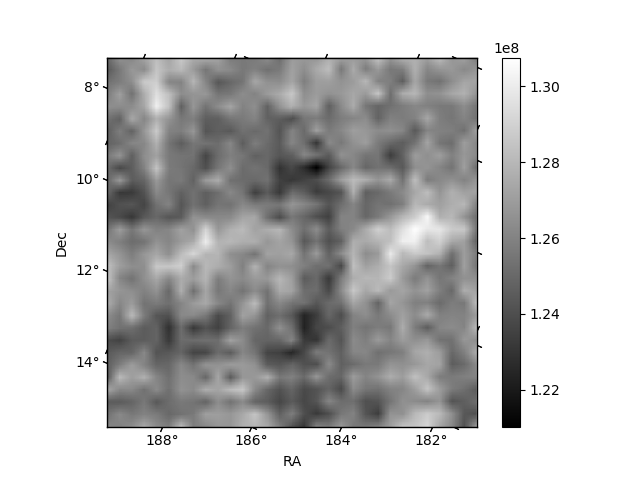
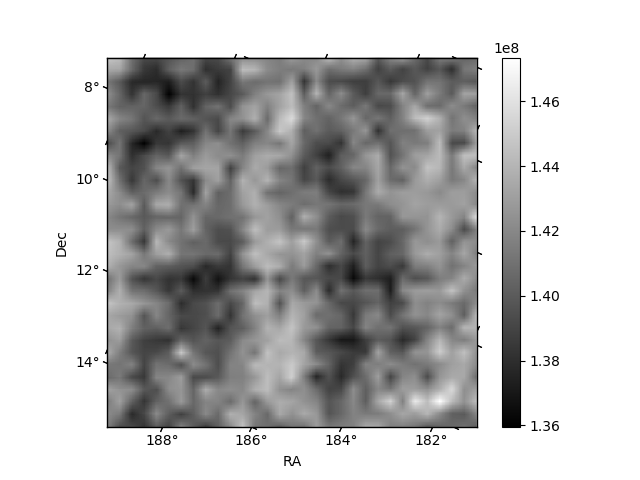
Histogram calculated using DETX and DETY for each event in the final _common_clean file
| Quadrant A | 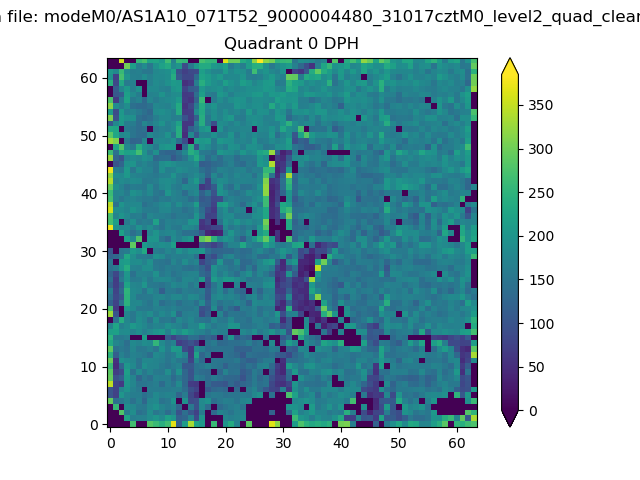 |
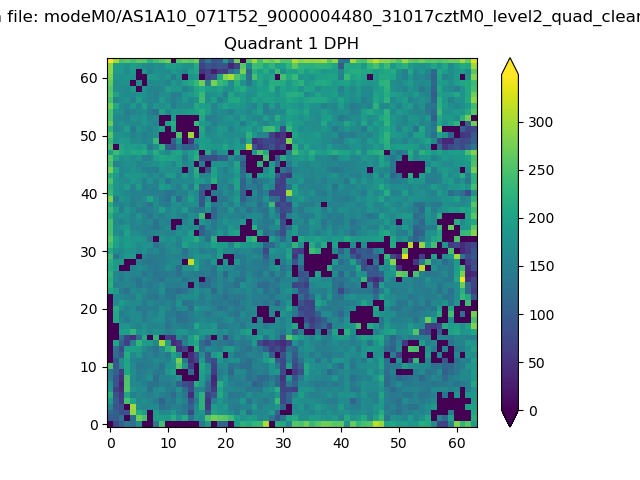 |
Quadrant B |
|---|---|---|---|
| Quadrant D | 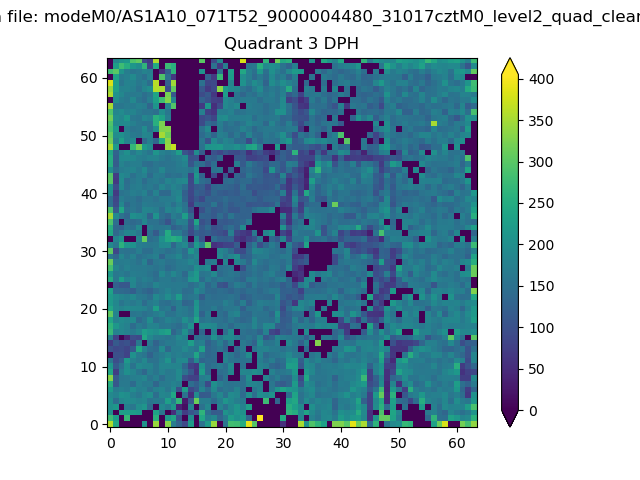 |
 |
Quadrant C |
| Plot type | Count rate plots | Images |
|---|---|---|
| Comparison with Poisson distribution Blue bars denote a histogram of data divided into 1 sec bins. Red curve is a Poisson curve with rate = median count rate of data. |
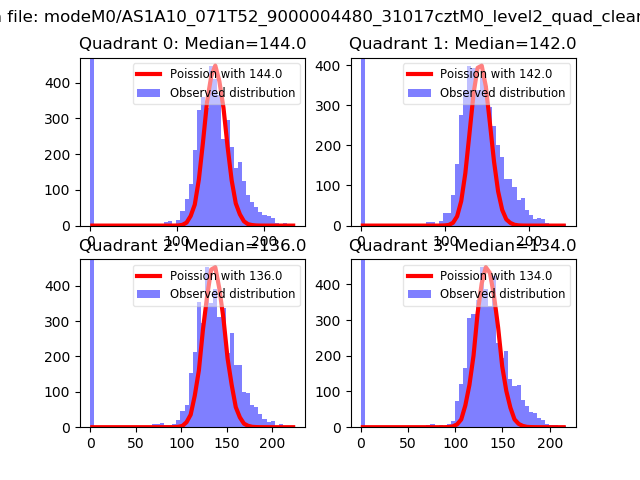 |
 |
| Quadrant-wise count rates Data is divided into 100 sec bins |
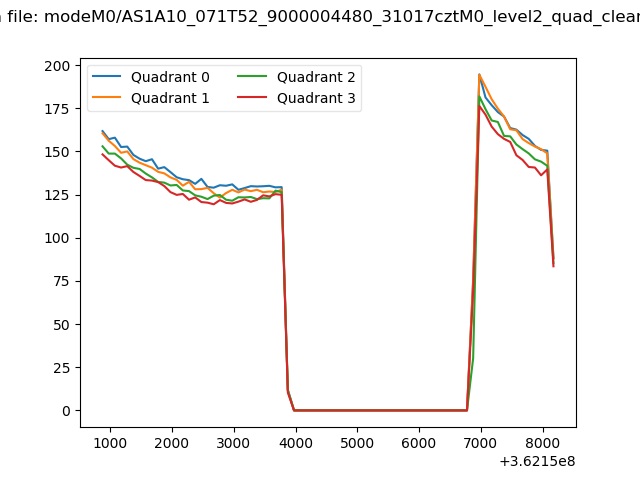 |
|
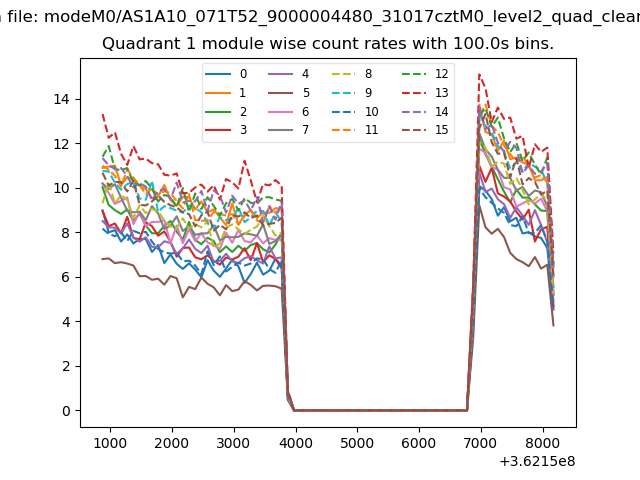
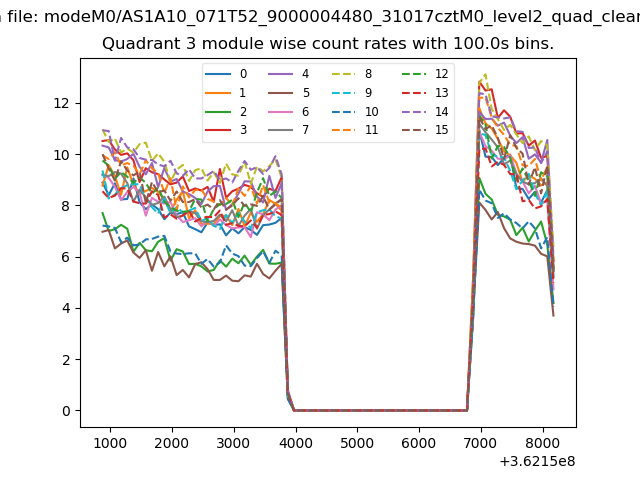
| Module-wise count rates for Quadrant A Data is divided into 100 sec bins |
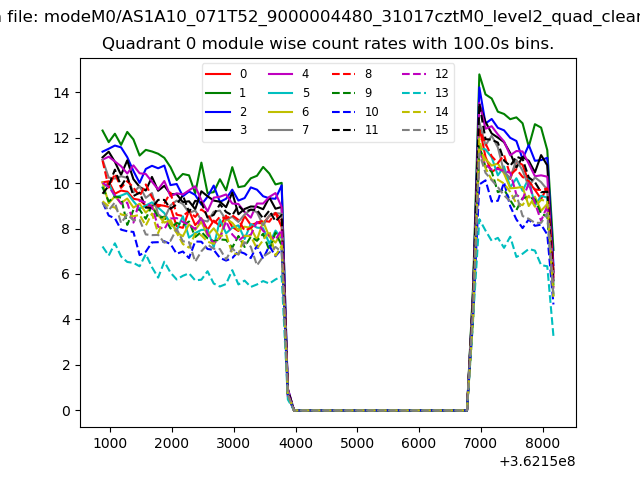 |
 |
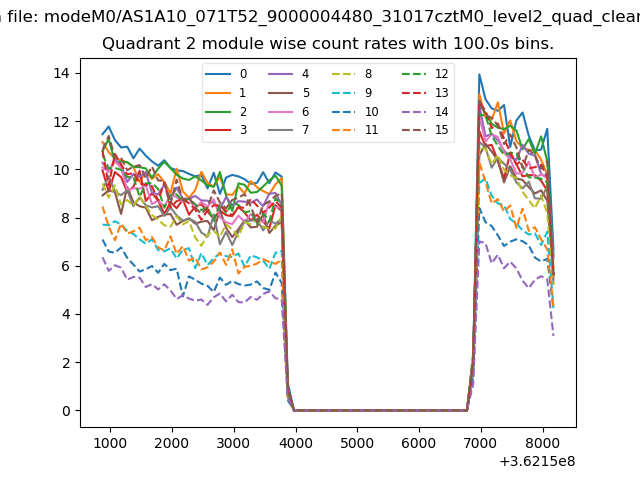
| Module-wise count rates for Quadrant B Data is divided into 100 sec bins |
 |
 |
| Module-wise count rates for Quadrant C Data is divided into 100 sec bins |
 |
 |
| Module-wise count rates for Quadrant D Data is divided into 100 sec bins |
 |
 |
| Parameter | Plot |
|---|---|
| CZT HV Monitor | 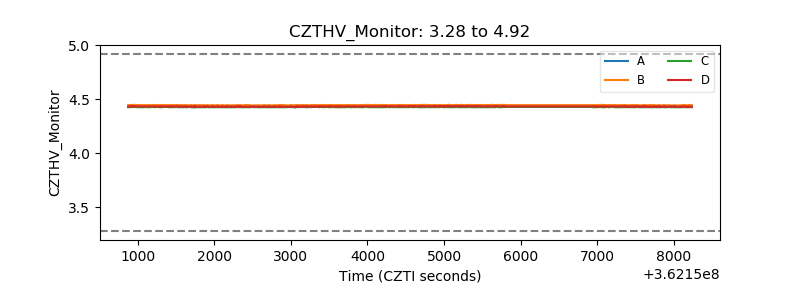 |
| D_VDD | 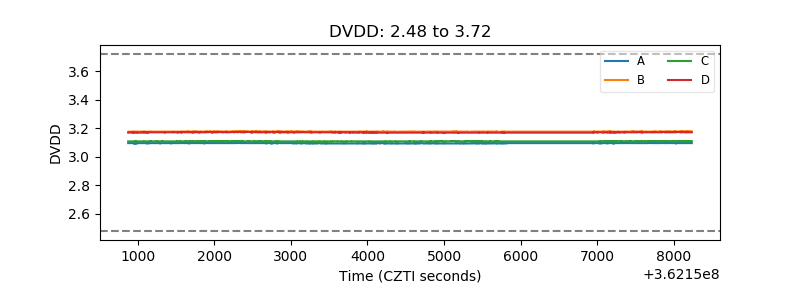 |
| Temperature 1 | 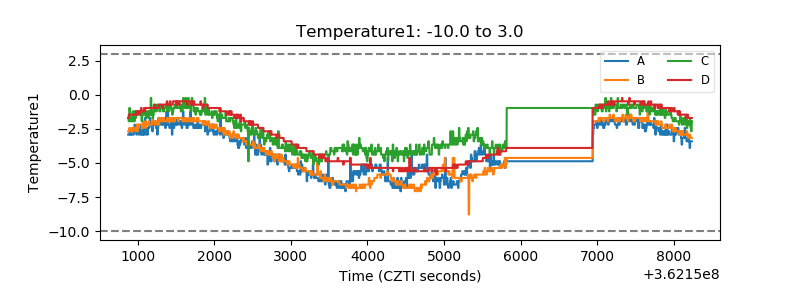 |
| Veto HV Monitor |  |
| Veto LLD | 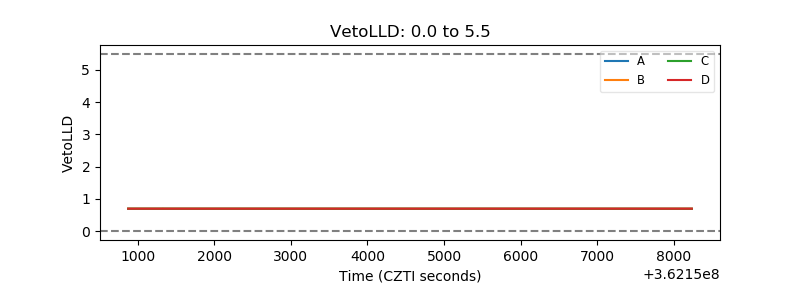 |
| Alpha Counter | 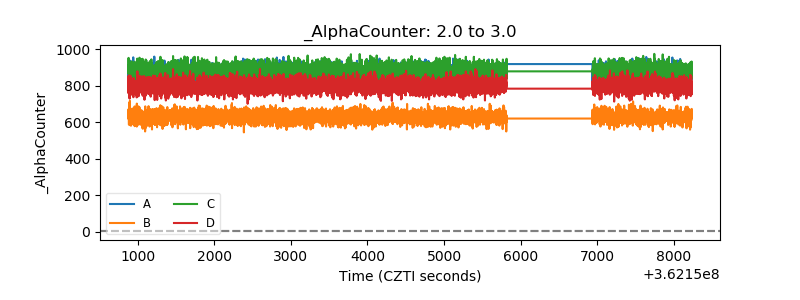 |
| _CPM_Rate | 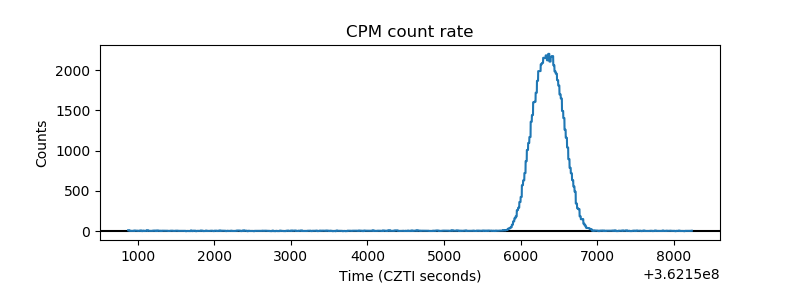 |
| CZT Counter | 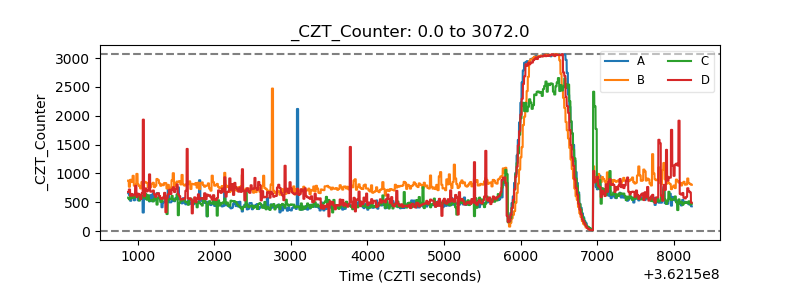 |
| +2.5 Volts monitor |  |
| +5 Volts monitor |  |
| _ROLL_ROT | 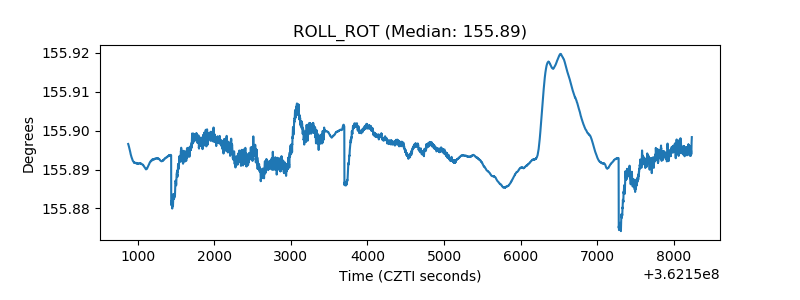 |
| _Roll_DEC | 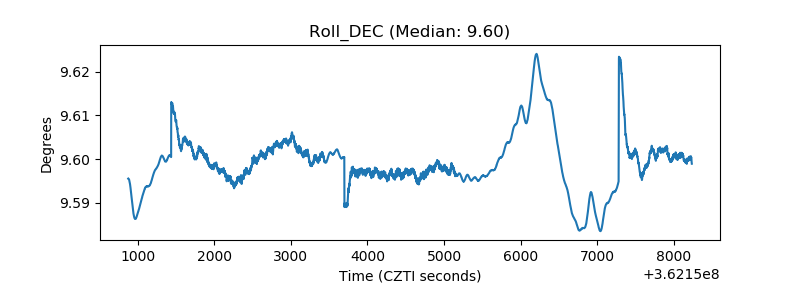 |
| _Roll_RA | 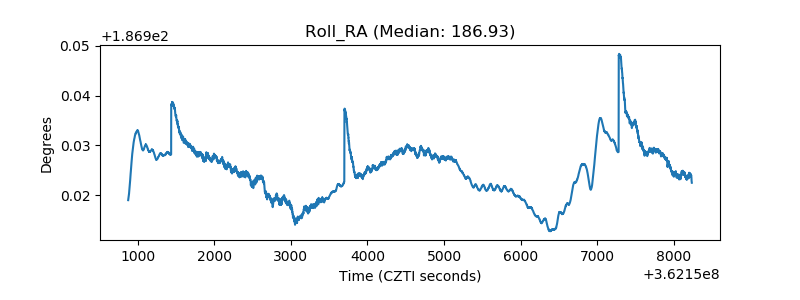 |
| Veto Counter | 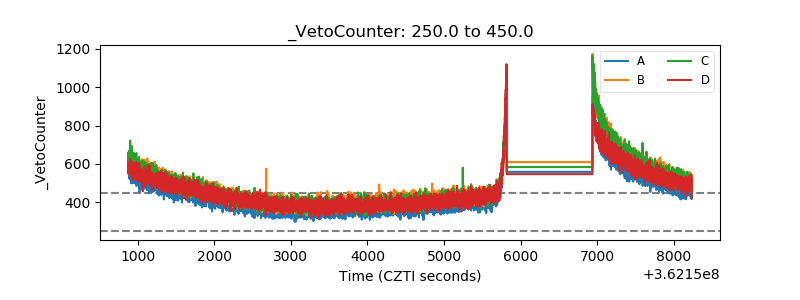 |