| Param | Original file | Final file |
|---|---|---|
| Filename | modeM0/AS1A10_071T52_9000004480_31018cztM0_level2.evt | modeM0/AS1A10_071T52_9000004480_31018cztM0_level2_quad_clean.evt |
| Size (bytes) | 590,169,600 | 95,290,560 |
| Size | 562.8 MB | 90.9 MB |
| Events in quadrant A | 3,232,298 | 641,554 |
| Events in quadrant B | 5,257,489 | 641,851 |
| Events in quadrant C | 3,722,690 | 590,249 |
| Events in quadrant D | 5,235,944 | 573,431 |
| Mode M0 | |||
|---|---|---|---|
| Quadrant | BADHDUFLAG | Total packets | Discarded packets |
| A | 0 | 13631 | 2 |
| B | 0 | 19855 | 2 |
| C | 0 | 15102 | 2 |
| D | 0 | 19847 | 2 |
| Mode M9 | |||
|---|---|---|---|
| Quadrant | BADHDUFLAG | Total packets | Discarded packets |
| A | 0 | 14 | 0 |
| B | 0 | 15 | 0 |
| C | 0 | 15 | 0 |
| D | 0 | 15 | 0 |
| Mode SS | |||
|---|---|---|---|
| Quadrant | BADHDUFLAG | Total packets | Discarded packets |
| A | 0 | 130 | 0 |
| B | 0 | 130 | 0 |
| C | 0 | 130 | 0 |
| D | 0 | 130 | 0 |
| Quadrant | Total seconds | Saturated seconds | Saturation percentage |
|---|---|---|---|
| A | 6275 | 55 | 0.876494% |
| B | 6275 | 134 | 2.135458% |
| C | 6274 | 238 | 3.793433% |
| D | 6274 | 375 | 5.977048% |
Noise dominated data is calculated using 1-second bins in cleaned event files. If a bin has >2000 counts, and if more than 50% of those come from <1% of pixels, then it is considered to be noise-dominated and hence unusable.
| Quadrant | # 1 sec bins | Bins with >0 counts | Bins with >2000 counts | High rate bins dominated by noise | Noise dominated (total time) | Noise dominated (detector-on time) | Marked lightcurve |
|---|---|---|---|---|---|---|---|
| A | 7530 | 6275 | 0 | 0 | 0.00% | 0.00% |  |
| B | 7530 | 6275 | 4 | 4 | 0.05% | 0.06% |  |
| C | 7529 | 6274 | 111 | 111 | 1.47% | 1.77% |  |
| D | 7529 | 6274 | 329 | 329 | 4.37% | 5.24% | 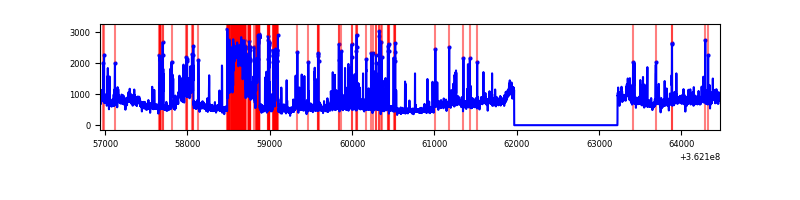 |
Top three noisy pixels from each quadrant. If the there are fewer than three noisy pixels in the level2.evt file, extra rows are filled as -1
| Pixel properties | Quadrant properties | ||||||
|---|---|---|---|---|---|---|---|
| Quadrant | DetID | PixID | Counts | Sigma | Mean | Median | Sigma |
| A | 13 | 254 | 12375 | 70.16 | 837 | 821 | 164.7 |
| A | 3 | 137 | 7935 | 43.2 | 837 | 821 | 164.7 |
| A | 0 | 226 | 7320 | 39.47 | 837 | 821 | 164.7 |
| B | 6 | 159 | 1834471 | 11749.87 | 827 | 808 | 156.1 |
| B | 0 | 155 | 69409 | 439.59 | 827 | 808 | 156.1 |
| B | 0 | 190 | 32903 | 205.66 | 827 | 808 | 156.1 |
| C | 0 | 10 | 498425 | 2709.64 | 783 | 791 | 183.7 |
| C | 14 | 238 | 126937 | 686.87 | 783 | 791 | 183.7 |
| C | 4 | 175 | 20782 | 108.85 | 783 | 791 | 183.7 |
| D | 13 | 174 | 1377288 | 7297.57 | 792 | 772 | 188.6 |
| D | 8 | 195 | 700685 | 3710.57 | 792 | 772 | 188.6 |
| D | 2 | 250 | 94021 | 494.36 | 792 | 772 | 188.6 |
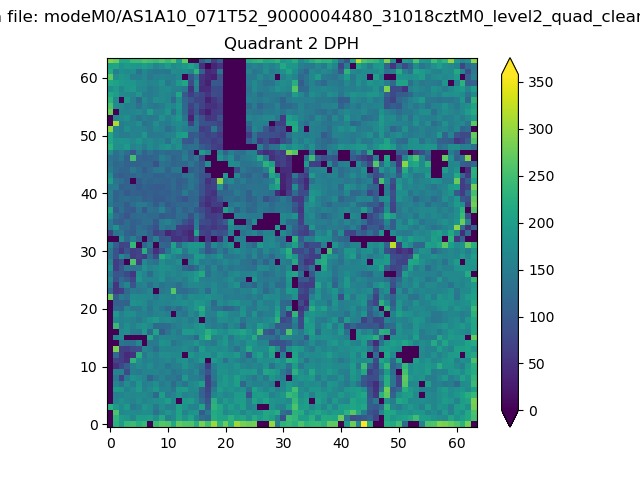
Histogram calculated using DETX and DETY for each event in the final _common_clean file
| Quadrant A | 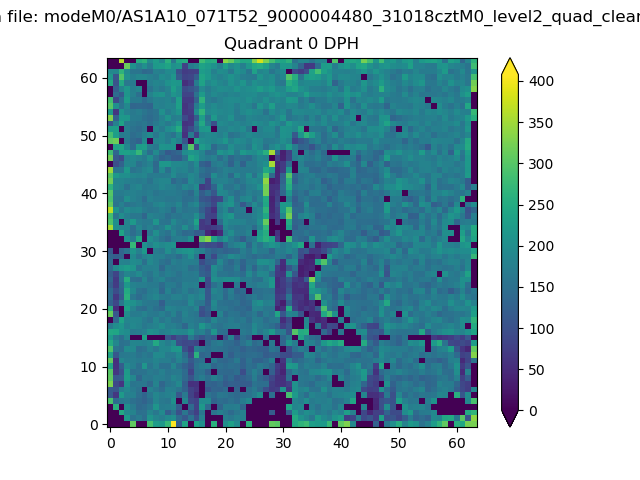 |
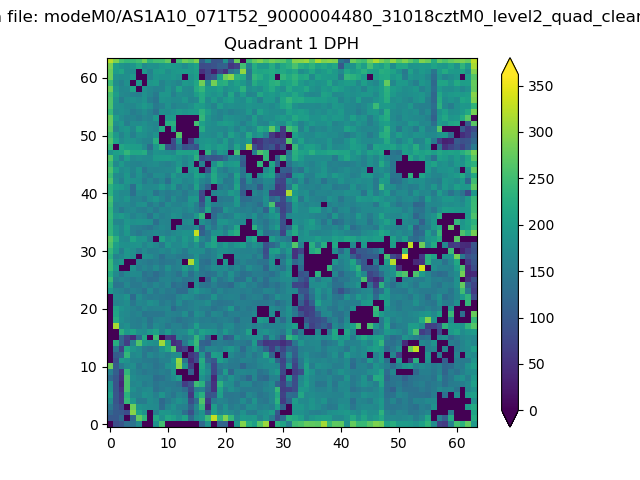 |
Quadrant B |
|---|---|---|---|
| Quadrant D | 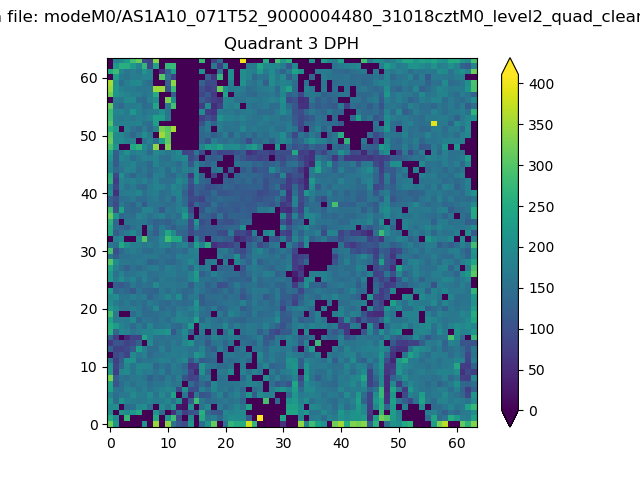 |
 |
Quadrant C |
| Plot type | Count rate plots | Images |
|---|---|---|
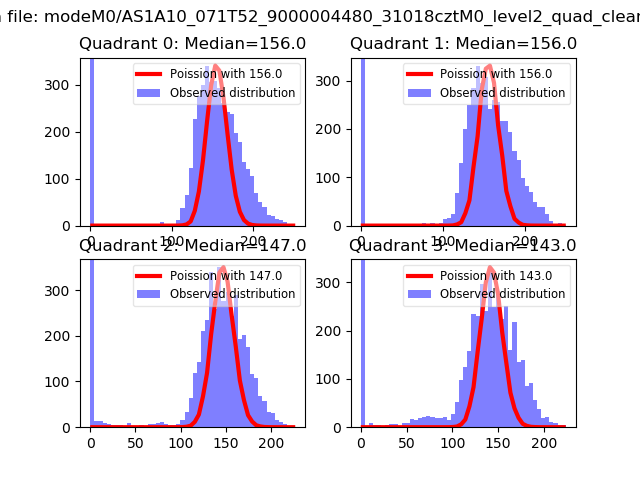
| Comparison with Poisson distribution Blue bars denote a histogram of data divided into 1 sec bins. Red curve is a Poisson curve with rate = median count rate of data. |
 |
 |
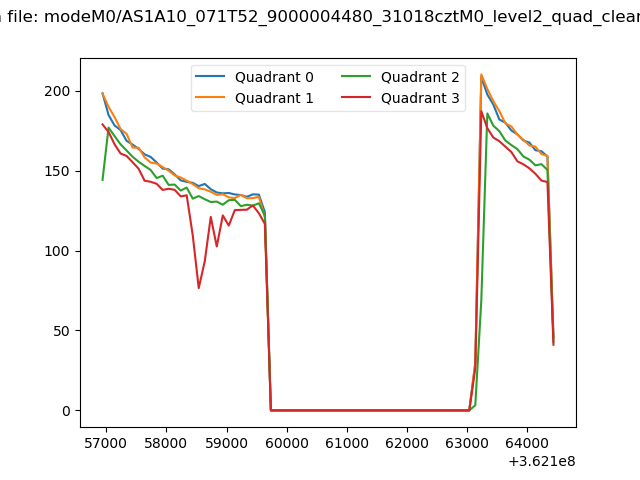
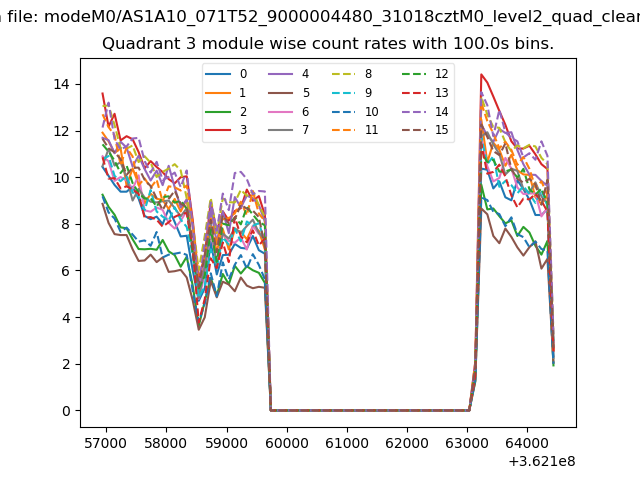
| Quadrant-wise count rates Data is divided into 100 sec bins |
 |
|
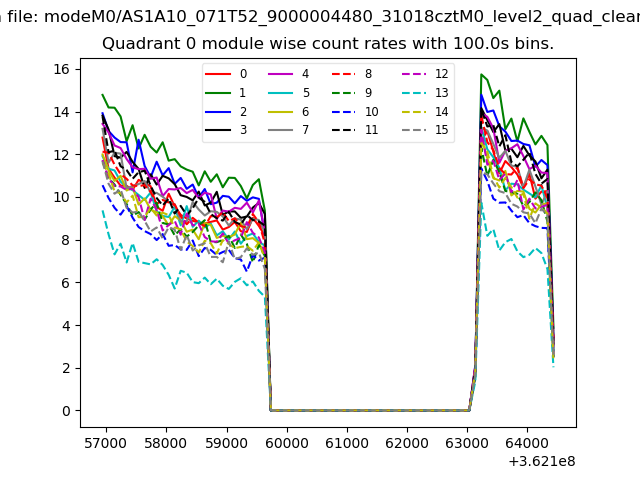
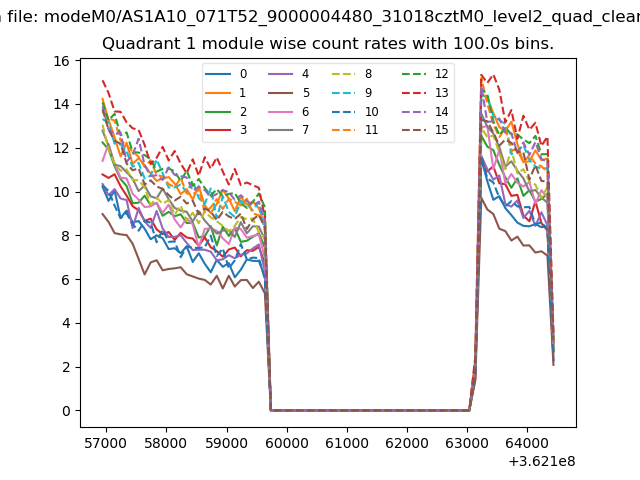
| Module-wise count rates for Quadrant A Data is divided into 100 sec bins |
 |
 |
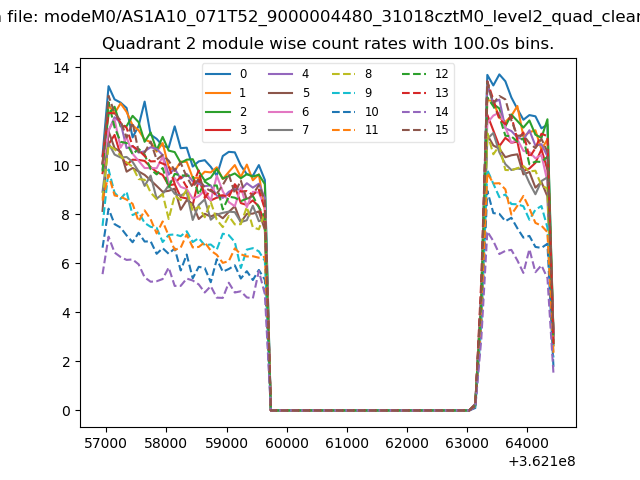
| Module-wise count rates for Quadrant B Data is divided into 100 sec bins |
 |
 |
| Module-wise count rates for Quadrant C Data is divided into 100 sec bins |
 |
 |
| Module-wise count rates for Quadrant D Data is divided into 100 sec bins |
 |
 |
| Parameter | Plot |
|---|---|
| CZT HV Monitor |  |
| D_VDD | 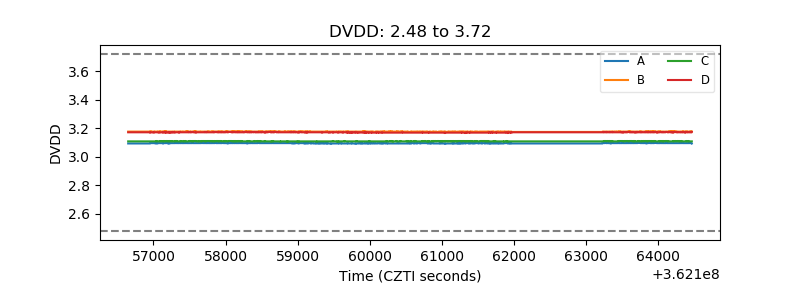 |
| Temperature 1 | 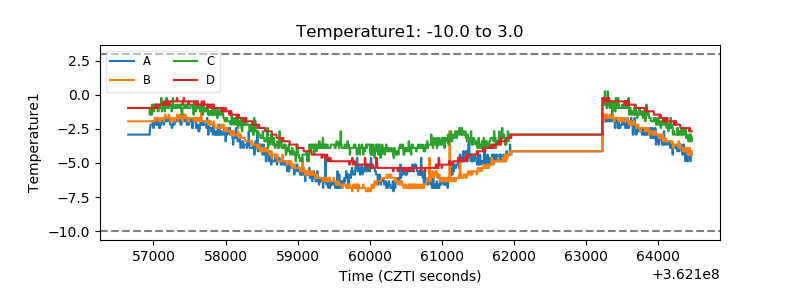 |
| Veto HV Monitor | 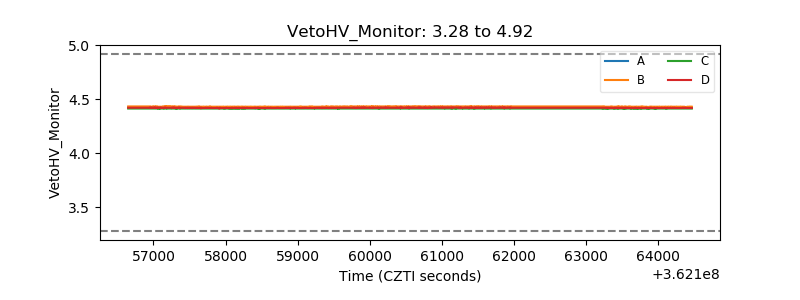 |
| Veto LLD | 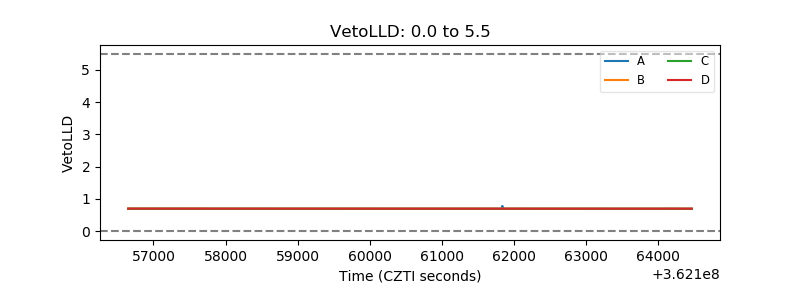 |
| Alpha Counter | 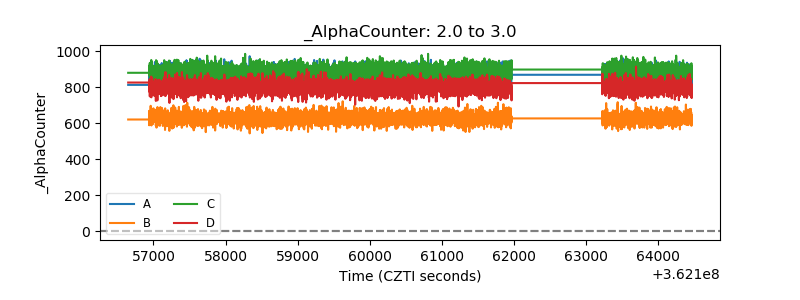 |
| _CPM_Rate | 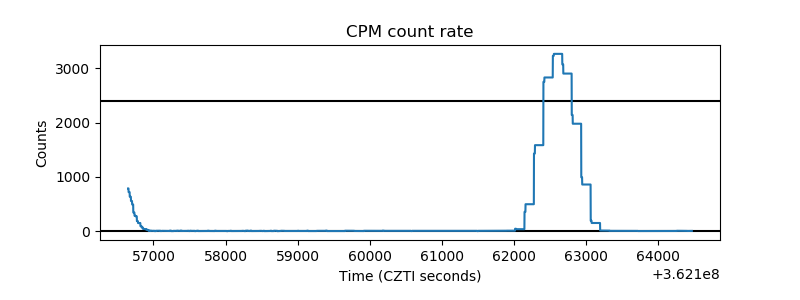 |
| CZT Counter | 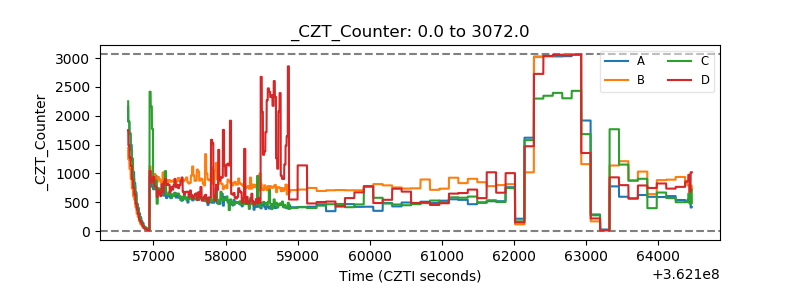 |
| +2.5 Volts monitor |  |
| +5 Volts monitor |  |
| _ROLL_ROT | 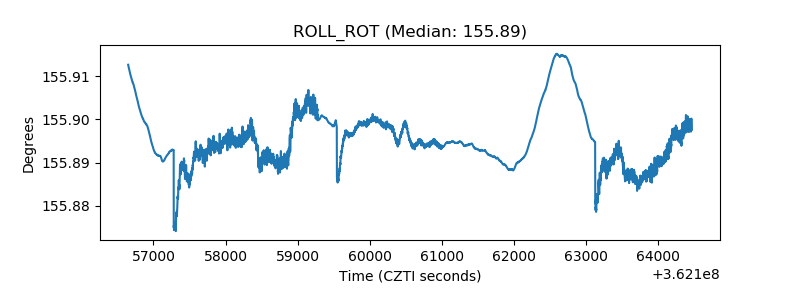 |
| _Roll_DEC | 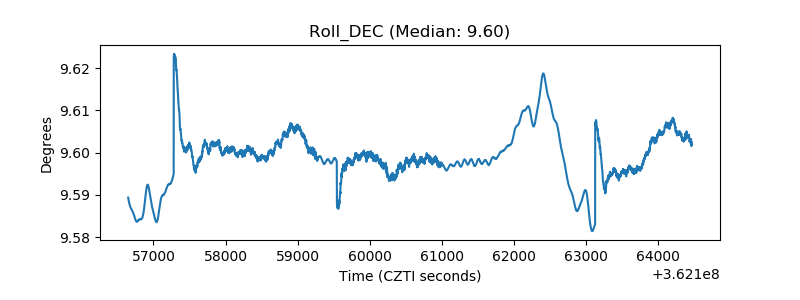 |
| _Roll_RA | 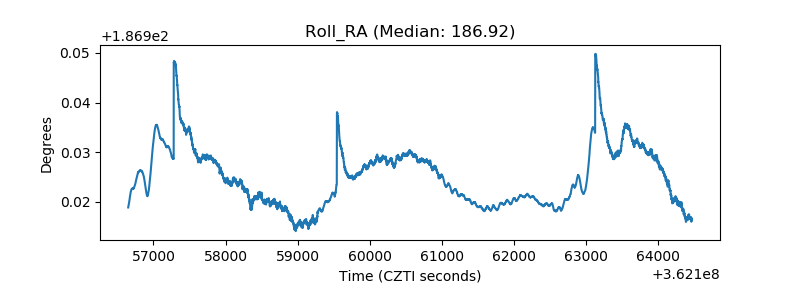 |
| Veto Counter | 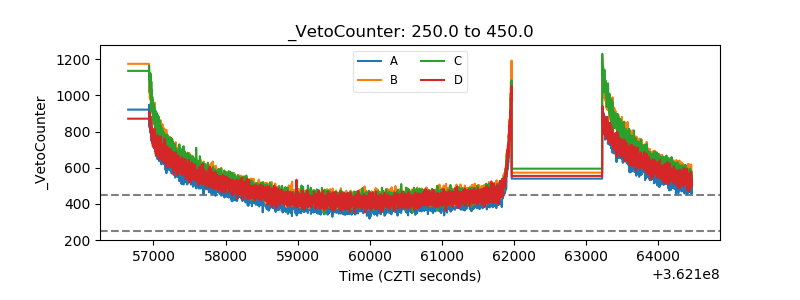 |