| Param | Original file | Final file |
|---|---|---|
| Filename | modeM0/AS1A10_071T54_9000004482cztM0_level2.fits | modeM0/AS1A10_071T54_9000004482cztM0_level2_quad_clean.evt |
| Size (bytes) | 575,916,480 | 429,344,640 |
| Size | 549.2 MB | 409.5 MB |
| Events in quadrant A | 3,617,062 | 2,412,349 |
| Events in quadrant B | 3,389,312 | 2,376,954 |
| Events in quadrant C | 3,465,974 | 2,260,509 |
| Events in quadrant D | 2,967,766 | 1,951,844 |
| Mode M0 | |||
|---|---|---|---|
| Quadrant | BADHDUFLAG | Total packets | Discarded packets |
| A | 0 | 121349 | 0 |
| B | 0 | 180242 | 0 |
| C | 0 | 126615 | 0 |
| D | 0 | 177388 | 0 |
| Mode M9 | |||
|---|---|---|---|
| Quadrant | BADHDUFLAG | Total packets | Discarded packets |
| A | 0 | 86 | 0 |
| B | 0 | 86 | 0 |
| C | 0 | 86 | 0 |
| D | 0 | 86 | 0 |
| Mode SS | |||
|---|---|---|---|
| Quadrant | BADHDUFLAG | Total packets | Discarded packets |
| A | 0 | 1188 | 0 |
| B | 0 | 1188 | 0 |
| C | 0 | 1188 | 0 |
| D | 0 | 1188 | 0 |
| Quadrant | Total seconds | Saturated seconds | Saturation percentage |
|---|---|---|---|
| A | 58290 | 958 | 1.643507% |
| B | 58290 | 1892 | 3.245840% |
| C | 58290 | 1729 | 2.966203% |
| D | 58290 | 4812 | 8.255275% |
Noise dominated data is calculated using 1-second bins in cleaned event files. If a bin has >2000 counts, and if more than 50% of those come from <1% of pixels, then it is considered to be noise-dominated and hence unusable.
| Quadrant | # 1 sec bins | Bins with >0 counts | Bins with >2000 counts | High rate bins dominated by noise | Noise dominated (total time) | Noise dominated (detector-on time) | Marked lightcurve |
|---|---|---|---|---|---|---|---|
| A | 66930 | 58283 | 0 | 0 | 0.00% | 0.00% |  |
| B | 66930 | 58281 | 0 | 0 | 0.00% | 0.00% |  |
| C | 66929 | 58255 | 0 | 0 | 0.00% | 0.00% |  |
| D | 66929 | 58276 | 0 | 0 | 0.00% | 0.00% | 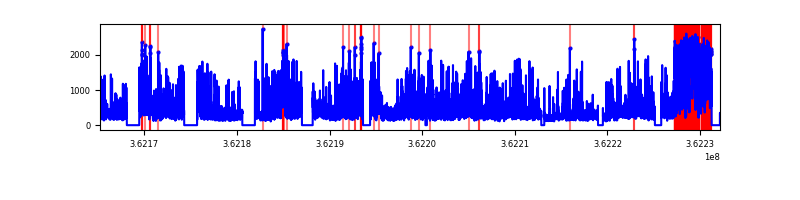 |
Top three noisy pixels from each quadrant. If the there are fewer than three noisy pixels in the level2.evt file, extra rows are filled as -1
| Pixel properties | Quadrant properties | ||||||
|---|---|---|---|---|---|---|---|
| Quadrant | DetID | PixID | Counts | Sigma | Mean | Median | Sigma |
| A | 0 | 29 | 3534 | 11.4 | 942 | 885 | 232.4 |
| A | 7 | 110 | 2878 | 8.57 | 942 | 885 | 232.4 |
| A | 0 | 30 | 2736 | 7.96 | 942 | 885 | 232.4 |
| B | 2 | 9 | 2750 | 10.72 | 895 | 853 | 177.0 |
| B | 3 | 80 | 2279 | 8.06 | 895 | 853 | 177.0 |
| B | 5 | 232 | 2268 | 8.0 | 895 | 853 | 177.0 |
| C | 1 | 81 | 2626 | 7.59 | 916 | 855 | 233.5 |
| C | 1 | 80 | 2554 | 7.28 | 916 | 855 | 233.5 |
| C | 12 | 241 | 2456 | 6.86 | 916 | 855 | 233.5 |
| D | 15 | 46 | 2211 | 6.42 | 847 | 770 | 224.5 |
| D | 6 | 231 | 2087 | 5.87 | 847 | 770 | 224.5 |
| D | 4 | 160 | 2049 | 5.7 | 847 | 770 | 224.5 |
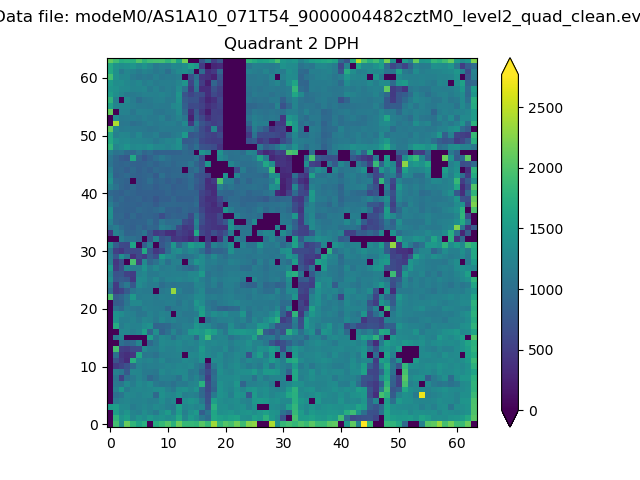
Histogram calculated using DETX and DETY for each event in the final _common_clean file
| Quadrant A |  |
 |
Quadrant B |
|---|---|---|---|
| Quadrant D | 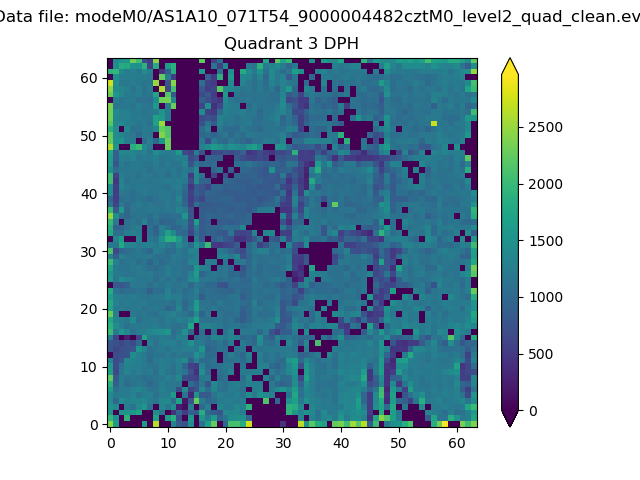 |
 |
Quadrant C |
| Plot type | Count rate plots | Images |
|---|---|---|
| Comparison with Poisson distribution Blue bars denote a histogram of data divided into 1 sec bins. Red curve is a Poisson curve with rate = median count rate of data. |
 |
 |
| Quadrant-wise count rates Data is divided into 100 sec bins |
 |
|
| Module-wise count rates for Quadrant A Data is divided into 100 sec bins |
 |
 |
| Module-wise count rates for Quadrant B Data is divided into 100 sec bins |
 |
 |
| Module-wise count rates for Quadrant C Data is divided into 100 sec bins |
 |
 |
| Module-wise count rates for Quadrant D Data is divided into 100 sec bins |
 |
 |
| Parameter | Plot |
|---|---|
| CZT HV Monitor | 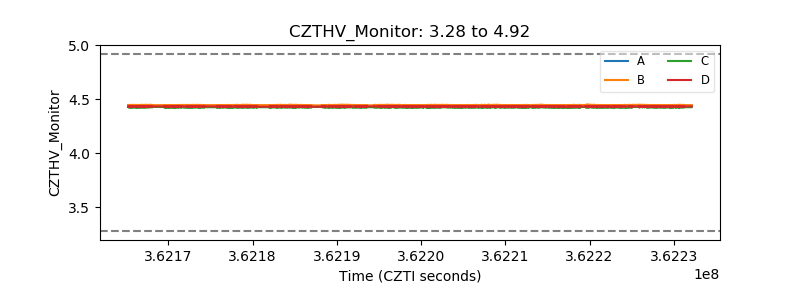 |
| D_VDD |  |
| Temperature 1 |  |
| Veto HV Monitor |  |
| Veto LLD | 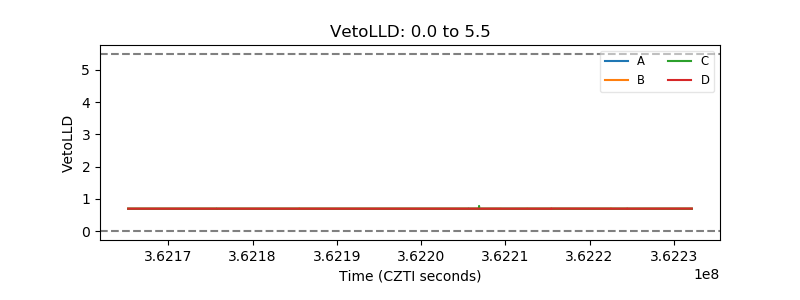 |
| Alpha Counter |  |
| _CPM_Rate |  |
| CZT Counter | 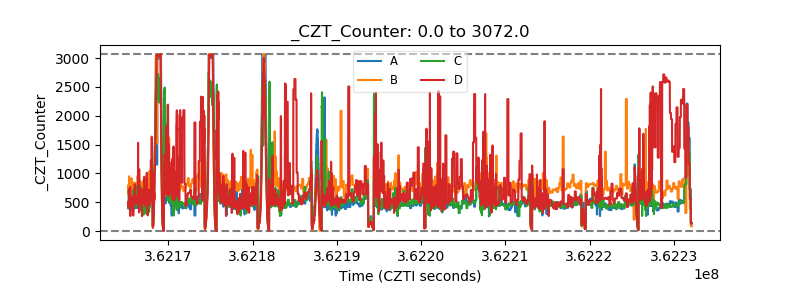 |
| +2.5 Volts monitor |  |
| +5 Volts monitor |  |
| _ROLL_ROT |  |
| _Roll_DEC |  |
| _Roll_RA |  |
| Veto Counter |  |