| Param | Original file | Final file |
|---|---|---|
| Filename | modeM0/AS1A10_071T54_9000004482_31019cztM0_level2.evt | modeM0/AS1A10_071T54_9000004482_31019cztM0_level2_quad_clean.evt |
| Size (bytes) | 384,261,120 | 50,783,040 |
| Size | 366.5 MB | 48.4 MB |
| Events in quadrant A | 2,191,708 | 326,191 |
| Events in quadrant B | 3,548,548 | 329,114 |
| Events in quadrant C | 2,694,414 | 291,919 |
| Events in quadrant D | 2,917,521 | 294,333 |
| Mode M0 | |||
|---|---|---|---|
| Quadrant | BADHDUFLAG | Total packets | Discarded packets |
| A | 0 | 9076 | 1 |
| B | 0 | 13202 | 1 |
| C | 0 | 10523 | 1 |
| D | 0 | 11381 | 1 |
| Mode M9 | |||
|---|---|---|---|
| Quadrant | BADHDUFLAG | Total packets | Discarded packets |
| A | 0 | 14 | 0 |
| B | 0 | 14 | 0 |
| C | 0 | 14 | 0 |
| D | 0 | 14 | 0 |
| Mode SS | |||
|---|---|---|---|
| Quadrant | BADHDUFLAG | Total packets | Discarded packets |
| A | 0 | 86 | 0 |
| B | 0 | 86 | 0 |
| C | 0 | 86 | 0 |
| D | 0 | 86 | 0 |
| Quadrant | Total seconds | Saturated seconds | Saturation percentage |
|---|---|---|---|
| A | 4198 | 40 | 0.952835% |
| B | 4198 | 113 | 2.691758% |
| C | 4198 | 221 | 5.264412% |
| D | 4198 | 85 | 2.024774% |
Noise dominated data is calculated using 1-second bins in cleaned event files. If a bin has >2000 counts, and if more than 50% of those come from <1% of pixels, then it is considered to be noise-dominated and hence unusable.
| Quadrant | # 1 sec bins | Bins with >0 counts | Bins with >2000 counts | High rate bins dominated by noise | Noise dominated (total time) | Noise dominated (detector-on time) | Marked lightcurve |
|---|---|---|---|---|---|---|---|
| A | 5538 | 4198 | 0 | 0 | 0.00% | 0.00% | 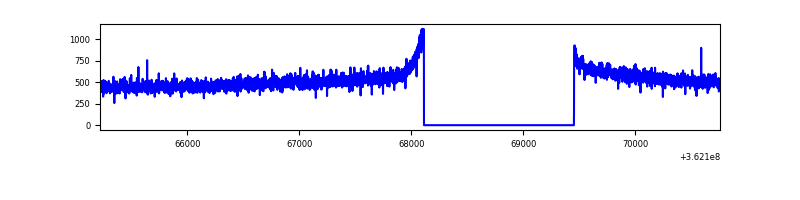 |
| B | 5538 | 4198 | 9 | 9 | 0.16% | 0.21% | 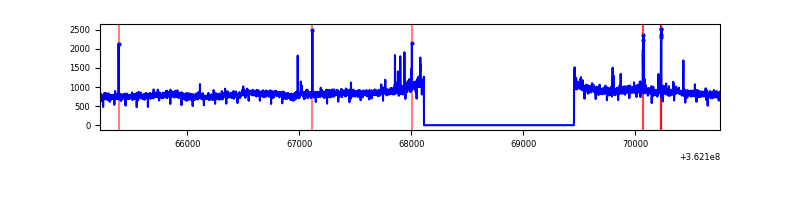 |
| C | 5538 | 4198 | 116 | 116 | 2.09% | 2.76% | 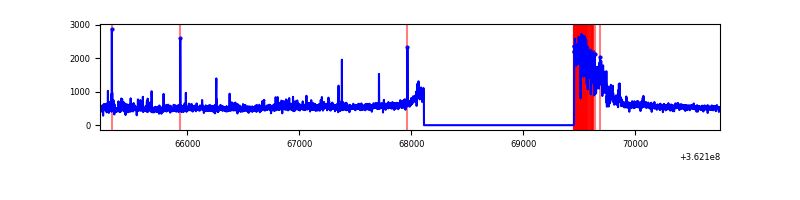 |
| D | 5538 | 4198 | 50 | 50 | 0.90% | 1.19% | 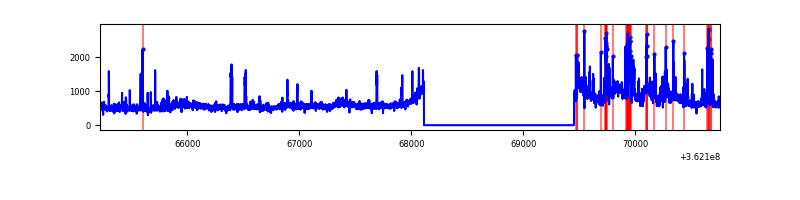 |
Top three noisy pixels from each quadrant. If the there are fewer than three noisy pixels in the level2.evt file, extra rows are filled as -1
| Pixel properties | Quadrant properties | ||||||
|---|---|---|---|---|---|---|---|
| Quadrant | DetID | PixID | Counts | Sigma | Mean | Median | Sigma |
| A | 13 | 254 | 7901 | 63.59 | 568 | 558 | 115.5 |
| A | 3 | 137 | 5450 | 42.37 | 568 | 558 | 115.5 |
| A | 0 | 226 | 4762 | 36.41 | 568 | 558 | 115.5 |
| B | 6 | 159 | 1244120 | 11540.74 | 564 | 551 | 107.8 |
| B | 0 | 183 | 30104 | 274.26 | 564 | 551 | 107.8 |
| B | 4 | 171 | 17661 | 158.79 | 564 | 551 | 107.8 |
| C | 0 | 10 | 526787 | 4257.34 | 526 | 531 | 123.6 |
| C | 14 | 238 | 85908 | 690.69 | 526 | 531 | 123.6 |
| C | 4 | 175 | 16540 | 129.51 | 526 | 531 | 123.6 |
| D | 8 | 195 | 399893 | 3106.4 | 540 | 526 | 128.6 |
| D | 13 | 174 | 337415 | 2620.42 | 540 | 526 | 128.6 |
| D | 13 | 249 | 73477 | 567.43 | 540 | 526 | 128.6 |
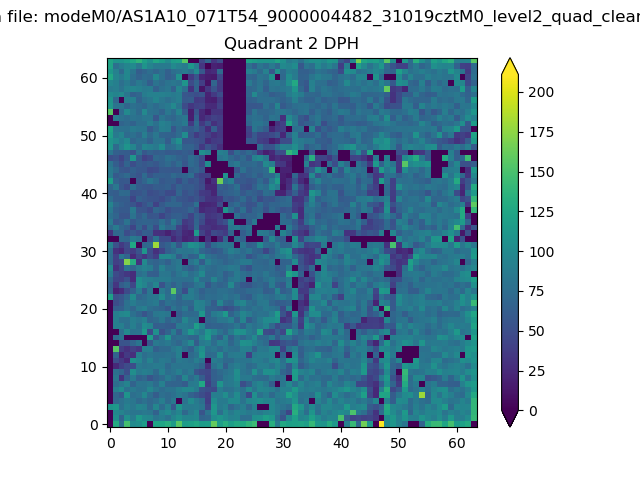
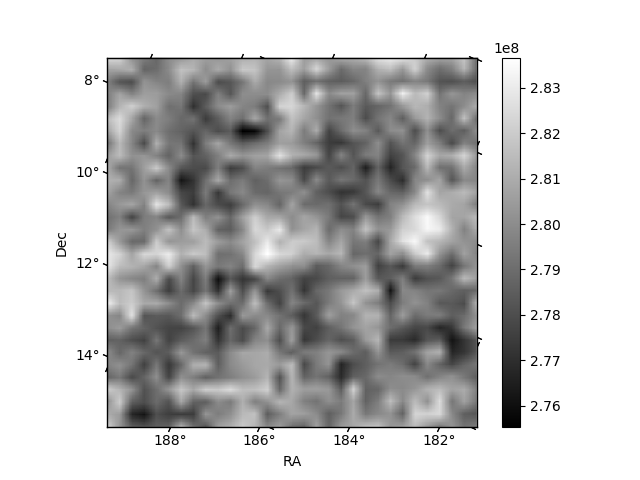
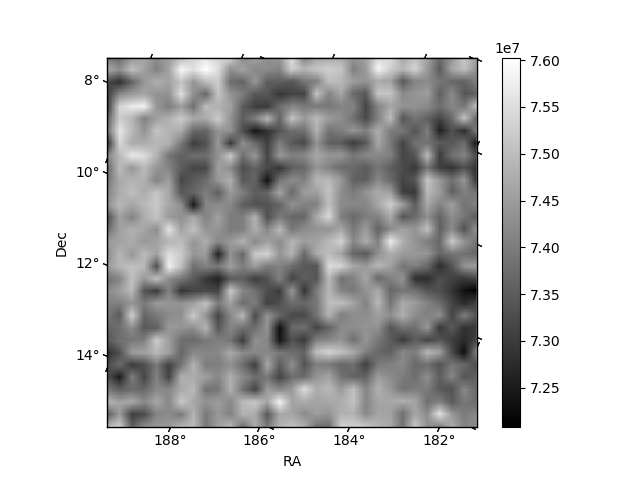
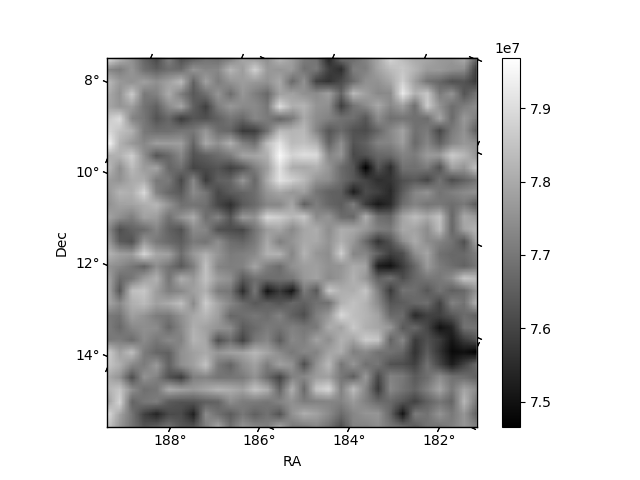
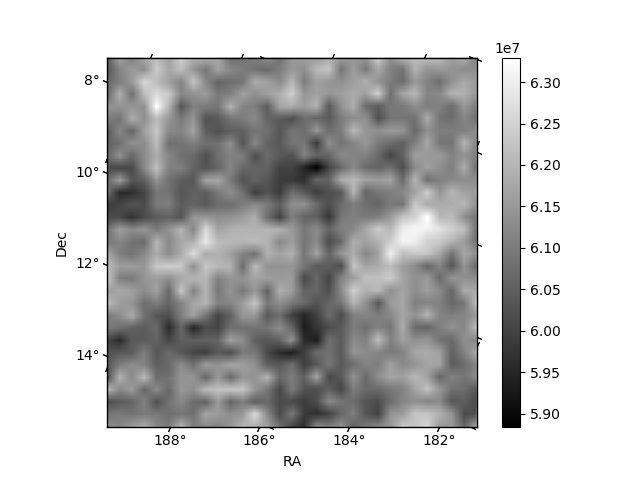
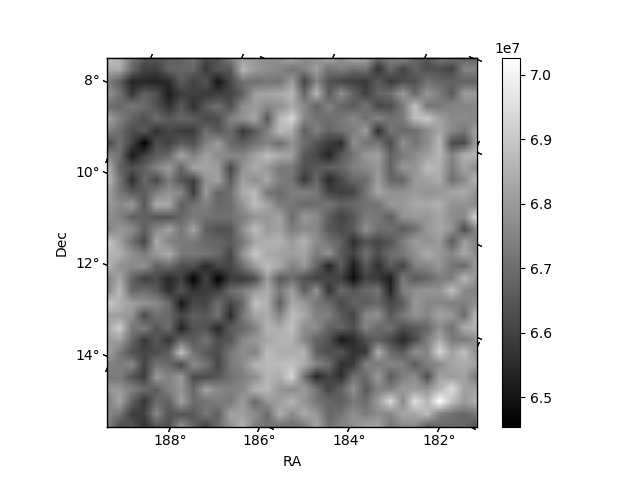
Histogram calculated using DETX and DETY for each event in the final _common_clean file
| Quadrant A | 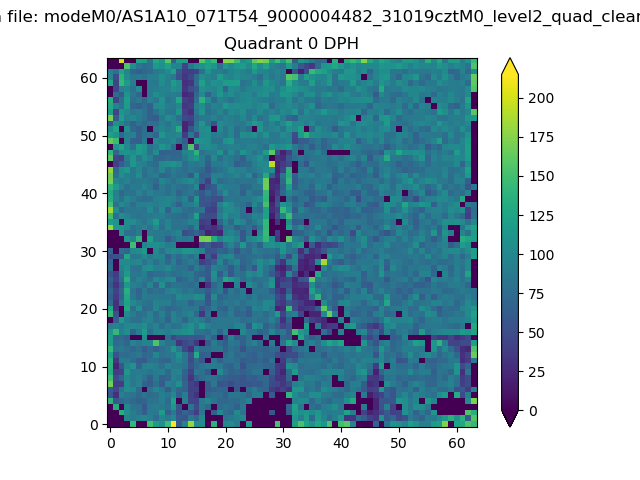 |
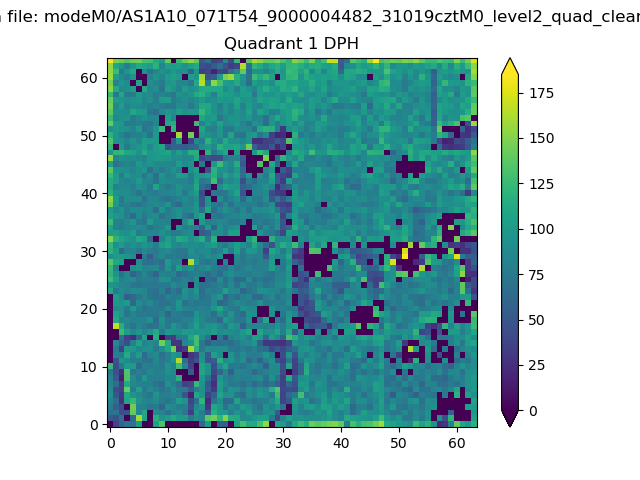 |
Quadrant B |
|---|---|---|---|
| Quadrant D | 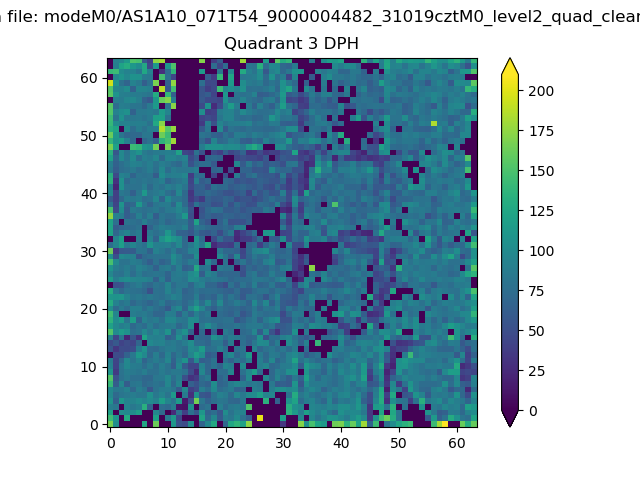 |
 |
Quadrant C |
| Plot type | Count rate plots | Images |
|---|---|---|
| Comparison with Poisson distribution Blue bars denote a histogram of data divided into 1 sec bins. Red curve is a Poisson curve with rate = median count rate of data. |
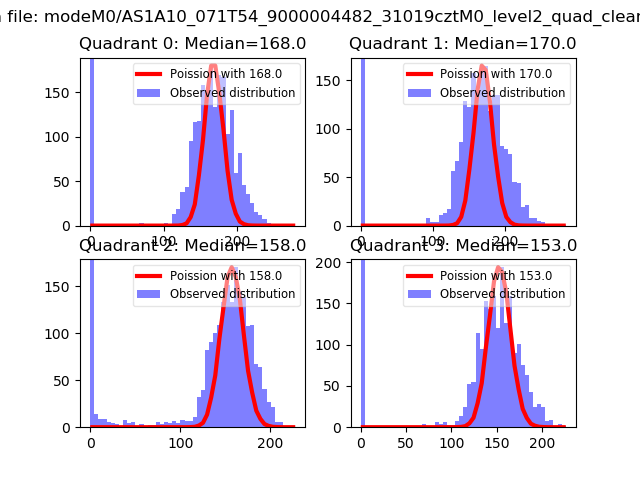 |
 |
| Quadrant-wise count rates Data is divided into 100 sec bins |
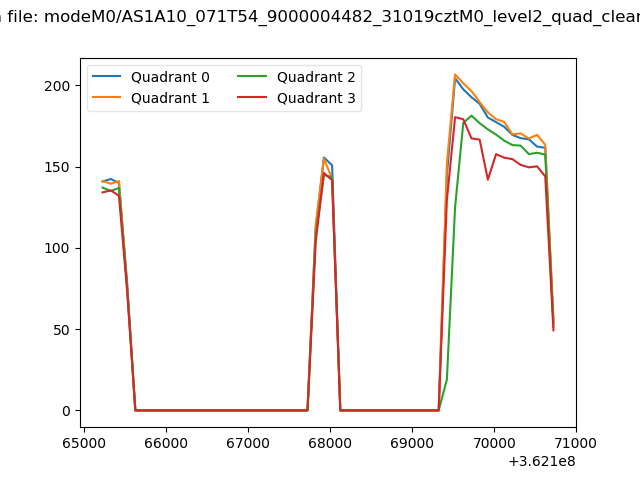 |
|
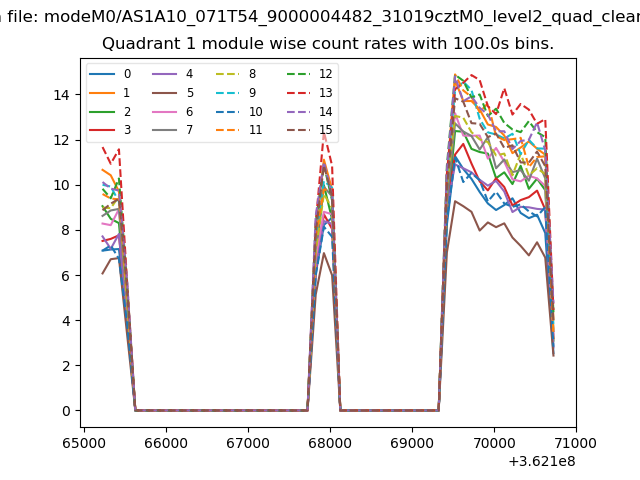
| Module-wise count rates for Quadrant A Data is divided into 100 sec bins |
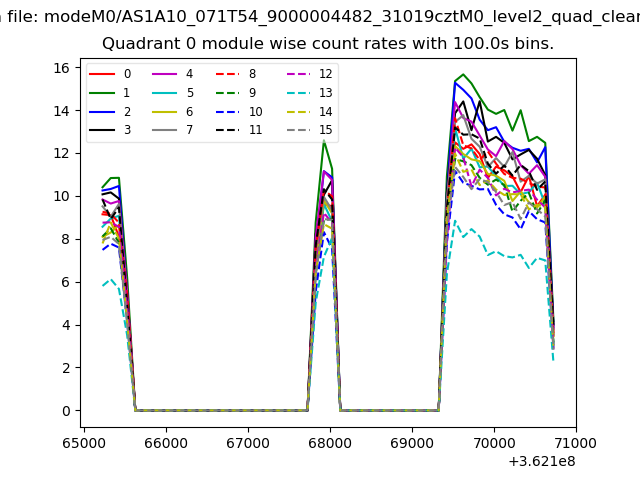 |
 |
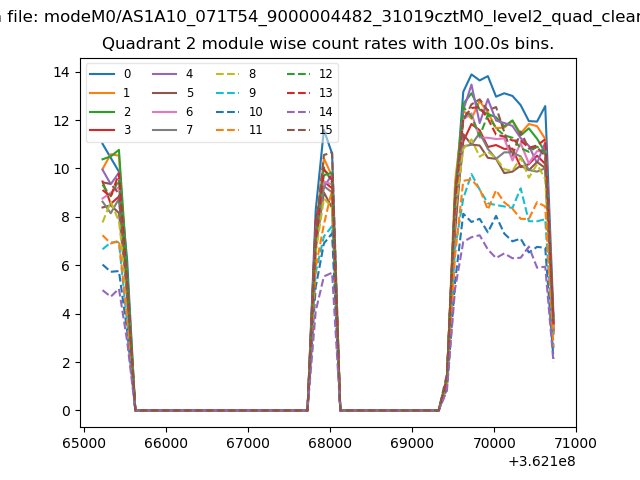
| Module-wise count rates for Quadrant B Data is divided into 100 sec bins |
 |
 |
| Module-wise count rates for Quadrant C Data is divided into 100 sec bins |
 |
 |
| Module-wise count rates for Quadrant D Data is divided into 100 sec bins |
 |
 |
| Parameter | Plot |
|---|---|
| CZT HV Monitor | 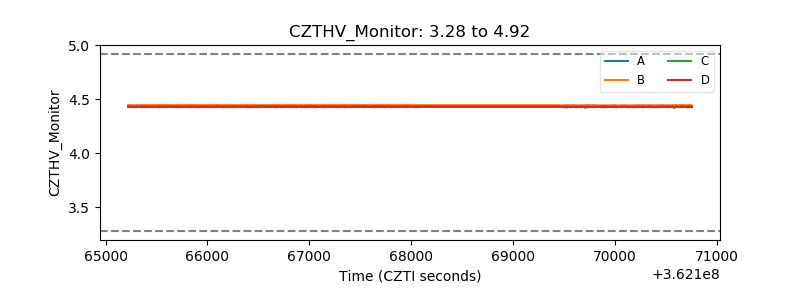 |
| D_VDD | 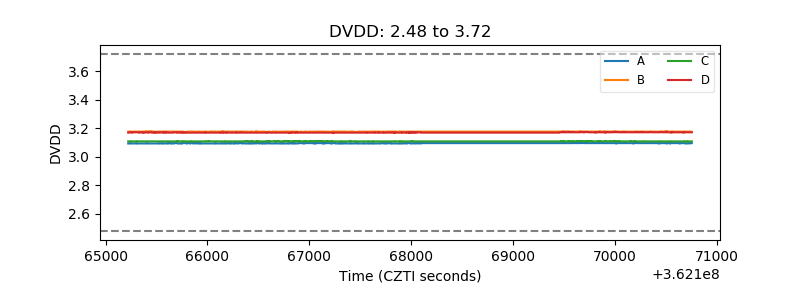 |
| Temperature 1 | 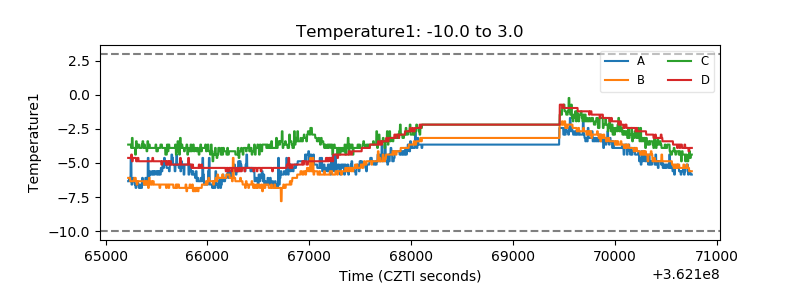 |
| Veto HV Monitor | 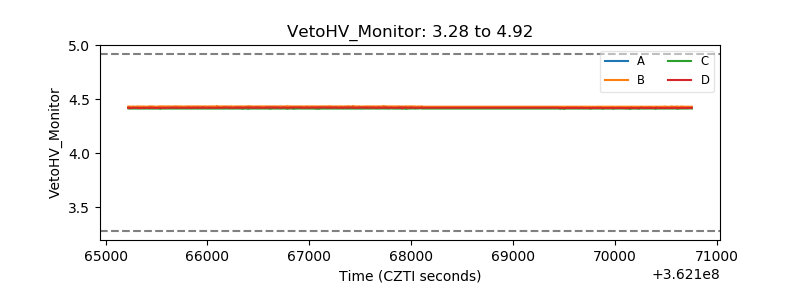 |
| Veto LLD | 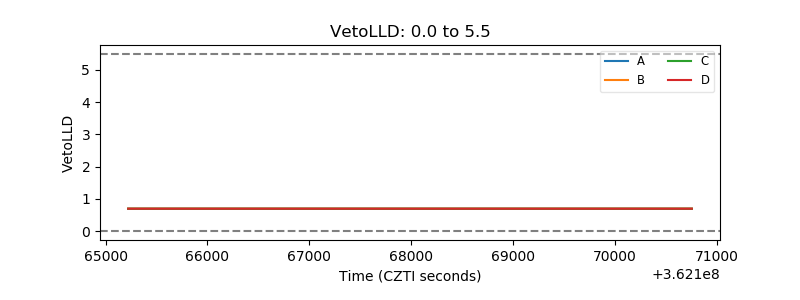 |
| Alpha Counter | 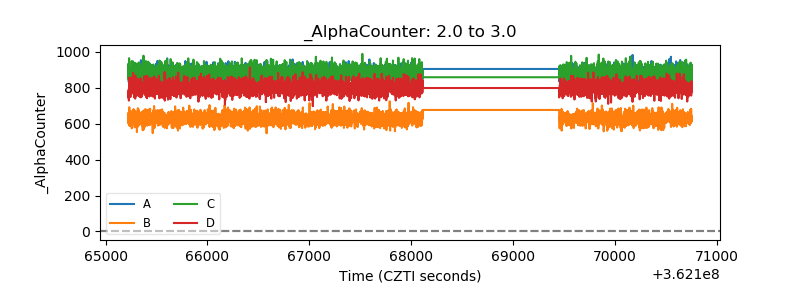 |
| _CPM_Rate | 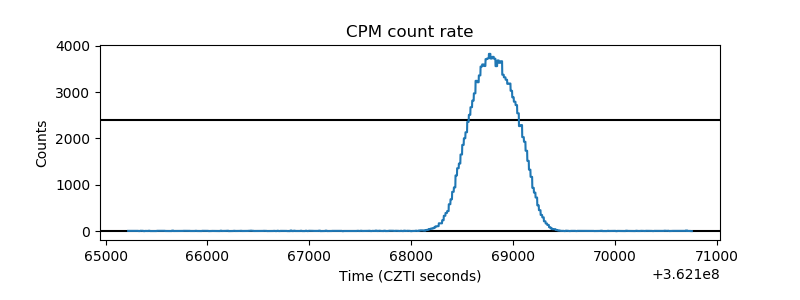 |
| CZT Counter | 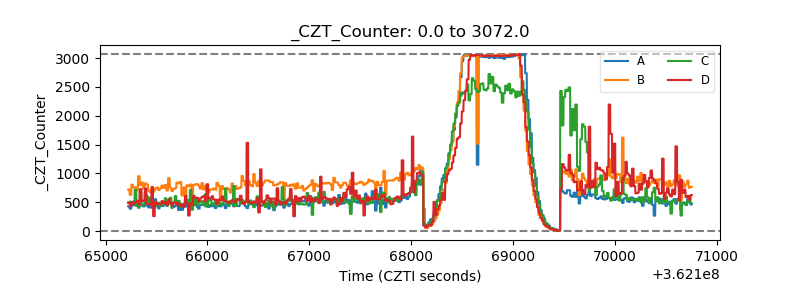 |
| +2.5 Volts monitor |  |
| +5 Volts monitor |  |
| _ROLL_ROT |  |
| _Roll_DEC | 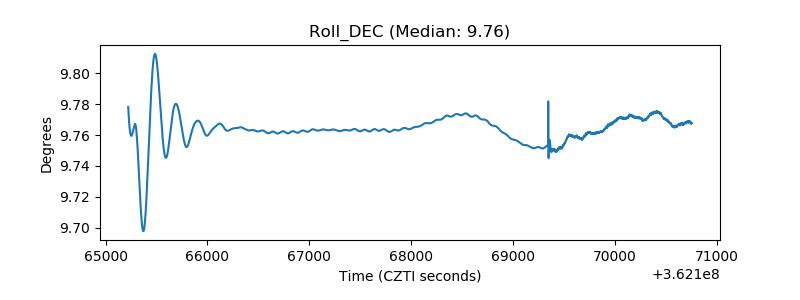 |
| _Roll_RA | 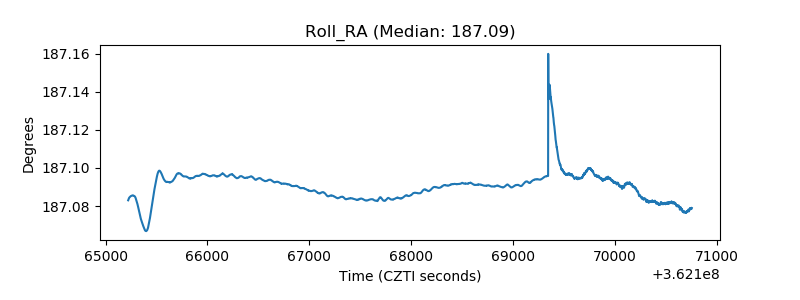 |
| Veto Counter | 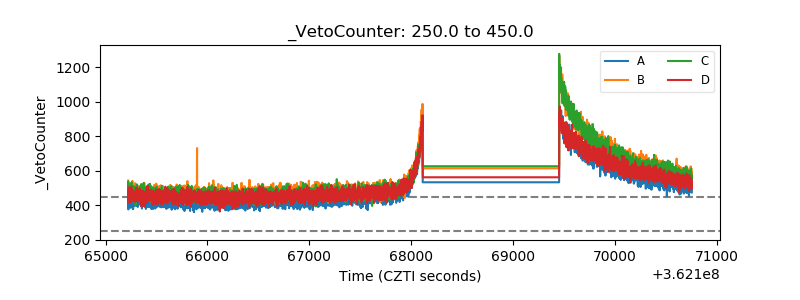 |