| Param | Original file | Final file |
|---|---|---|
| Filename | modeM0/AS1A10_071T54_9000004482_31023cztM0_level2.evt | modeM0/AS1A10_071T54_9000004482_31023cztM0_level2_quad_clean.evt |
| Size (bytes) | 600,117,120 | 79,666,560 |
| Size | 572.3 MB | 76.0 MB |
| Events in quadrant A | 3,340,409 | 503,198 |
| Events in quadrant B | 5,407,593 | 505,160 |
| Events in quadrant C | 4,002,456 | 464,731 |
| Events in quadrant D | 4,961,821 | 462,796 |
| Mode M0 | |||
|---|---|---|---|
| Quadrant | BADHDUFLAG | Total packets | Discarded packets |
| A | 0 | 14136 | 2 |
| B | 0 | 20940 | 2 |
| C | 0 | 16039 | 2 |
| D | 0 | 19189 | 2 |
| Mode M9 | |||
|---|---|---|---|
| Quadrant | BADHDUFLAG | Total packets | Discarded packets |
| A | 0 | 15 | 0 |
| B | 0 | 16 | 0 |
| C | 0 | 16 | 0 |
| D | 0 | 16 | 0 |
| Mode SS | |||
|---|---|---|---|
| Quadrant | BADHDUFLAG | Total packets | Discarded packets |
| A | 0 | 138 | 0 |
| B | 0 | 138 | 0 |
| C | 0 | 138 | 0 |
| D | 0 | 138 | 0 |
| Quadrant | Total seconds | Saturated seconds | Saturation percentage |
|---|---|---|---|
| A | 6839 | 36 | 0.526393% |
| B | 6839 | 102 | 1.491446% |
| C | 6839 | 264 | 3.860213% |
| D | 6839 | 100 | 1.462202% |
Noise dominated data is calculated using 1-second bins in cleaned event files. If a bin has >2000 counts, and if more than 50% of those come from <1% of pixels, then it is considered to be noise-dominated and hence unusable.
| Quadrant | # 1 sec bins | Bins with >0 counts | Bins with >2000 counts | High rate bins dominated by noise | Noise dominated (total time) | Noise dominated (detector-on time) | Marked lightcurve |
|---|---|---|---|---|---|---|---|
| A | 7609 | 6840 | 5 | 5 | 0.07% | 0.07% | 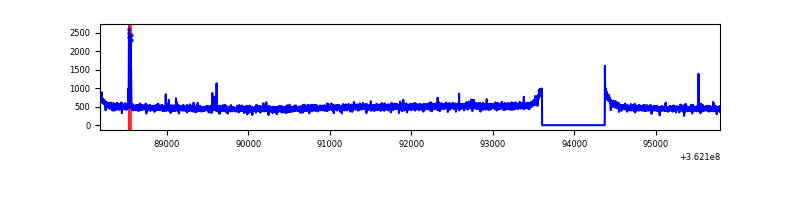 |
| B | 7609 | 6839 | 4 | 4 | 0.05% | 0.06% | 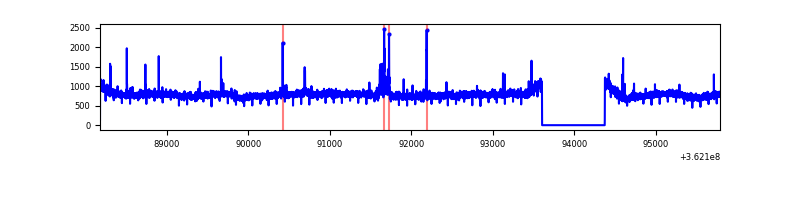 |
| C | 7609 | 6839 | 159 | 159 | 2.09% | 2.32% | 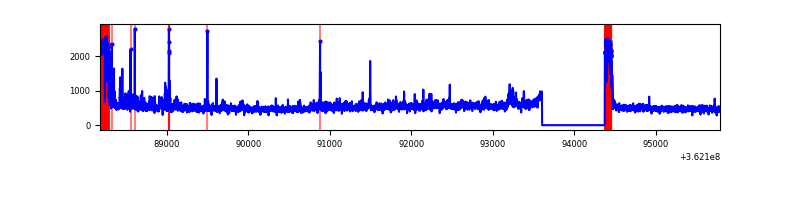 |
| D | 7609 | 6839 | 85 | 85 | 1.12% | 1.24% | 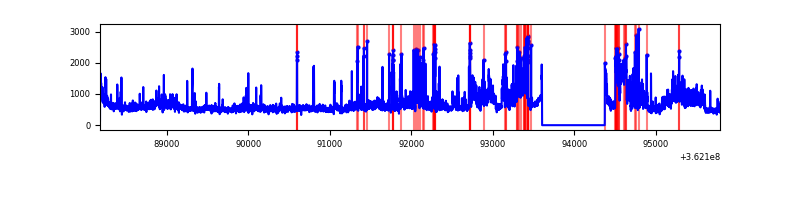 |
Top three noisy pixels from each quadrant. If the there are fewer than three noisy pixels in the level2.evt file, extra rows are filled as -1
| Pixel properties | Quadrant properties | ||||||
|---|---|---|---|---|---|---|---|
| Quadrant | DetID | PixID | Counts | Sigma | Mean | Median | Sigma |
| A | 15 | 174 | 31957 | 180.22 | 856 | 838 | 172.7 |
| A | 13 | 254 | 12212 | 65.87 | 856 | 838 | 172.7 |
| A | 3 | 137 | 8572 | 44.79 | 856 | 838 | 172.7 |
| B | 6 | 159 | 1934178 | 11685.7 | 849 | 828 | 165.4 |
| B | 15 | 33 | 42863 | 254.07 | 849 | 828 | 165.4 |
| B | 0 | 190 | 26218 | 153.46 | 849 | 828 | 165.4 |
| C | 0 | 10 | 685932 | 3594.29 | 803 | 809 | 190.6 |
| C | 14 | 238 | 129979 | 677.65 | 803 | 809 | 190.6 |
| C | 2 | 114 | 15482 | 76.98 | 803 | 809 | 190.6 |
| D | 13 | 174 | 1137860 | 5817.24 | 813 | 790 | 195.5 |
| D | 8 | 195 | 435815 | 2225.58 | 813 | 790 | 195.5 |
| D | 2 | 250 | 170492 | 868.19 | 813 | 790 | 195.5 |
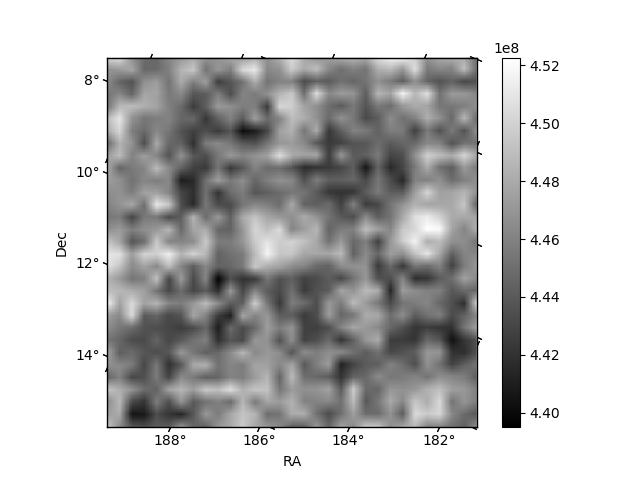
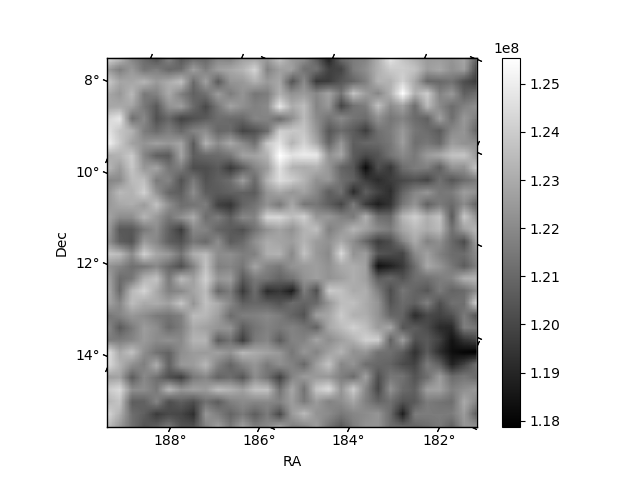
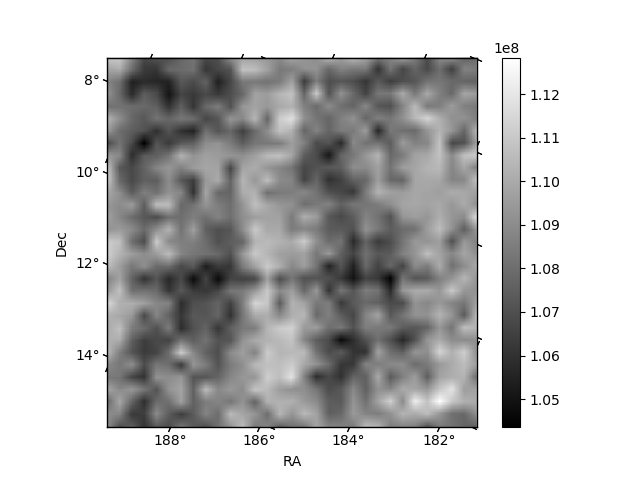
Histogram calculated using DETX and DETY for each event in the final _common_clean file
| Quadrant A | 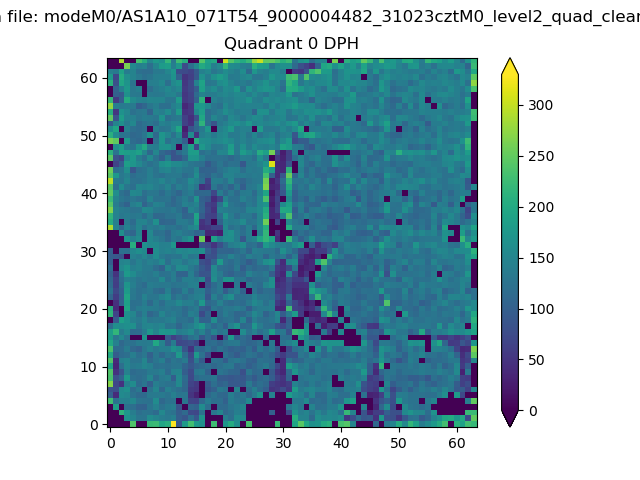 |
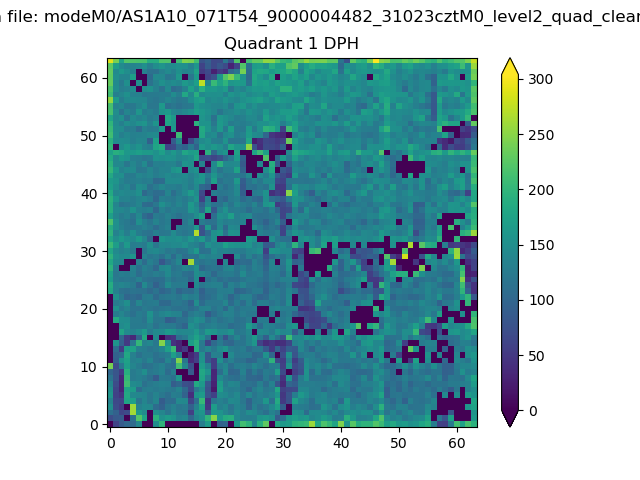 |
Quadrant B |
|---|---|---|---|
| Quadrant D | 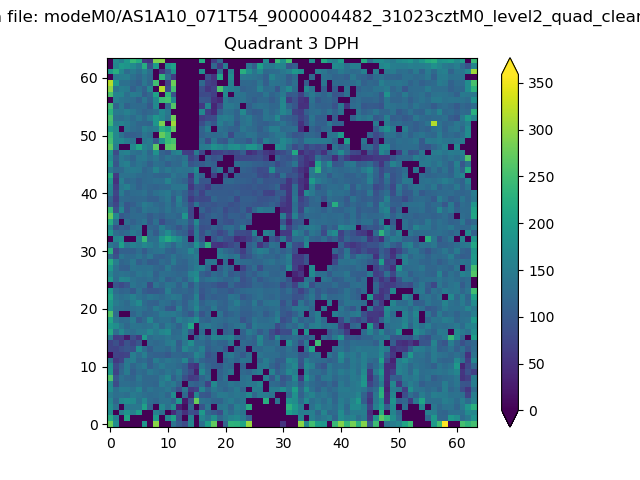 |
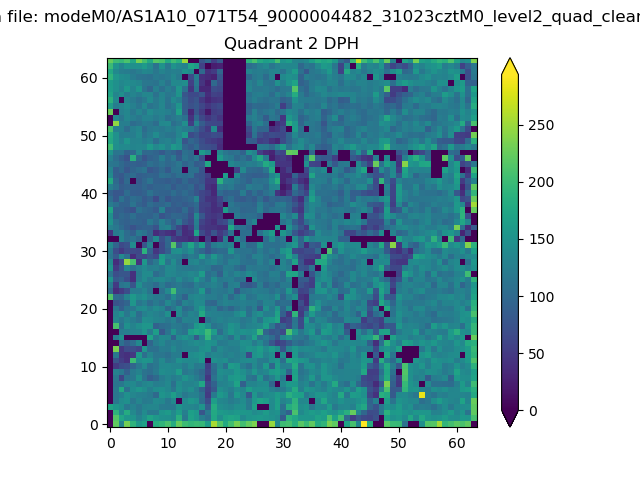 |
Quadrant C |
| Plot type | Count rate plots | Images |
|---|---|---|
| Comparison with Poisson distribution Blue bars denote a histogram of data divided into 1 sec bins. Red curve is a Poisson curve with rate = median count rate of data. |
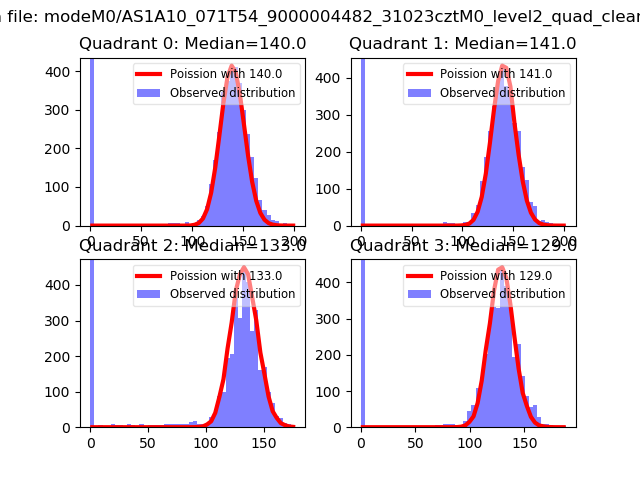 |
 |
| Quadrant-wise count rates Data is divided into 100 sec bins |
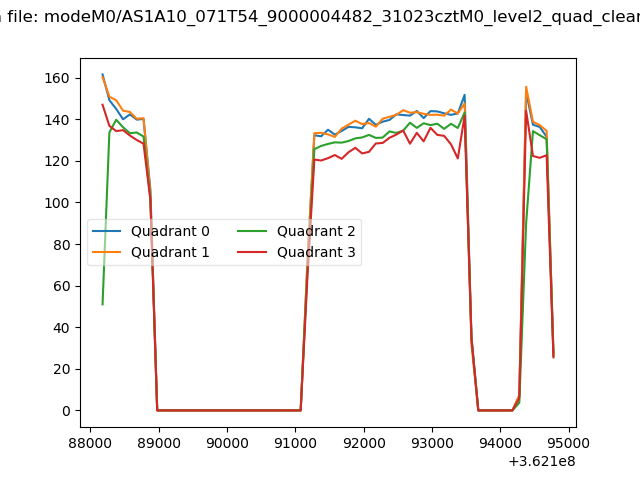 |
|
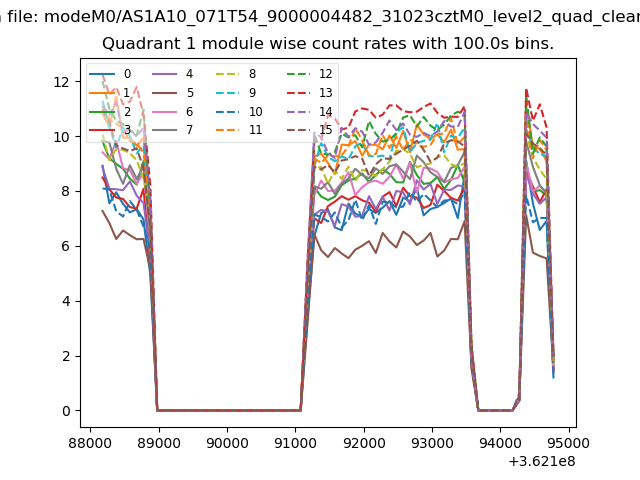
| Module-wise count rates for Quadrant A Data is divided into 100 sec bins |
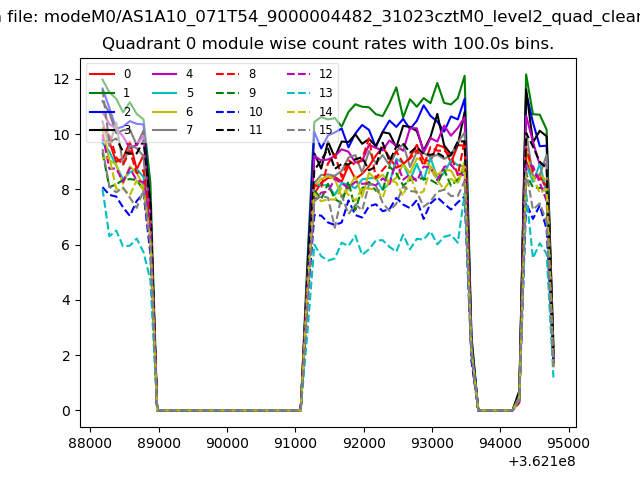 |
 |
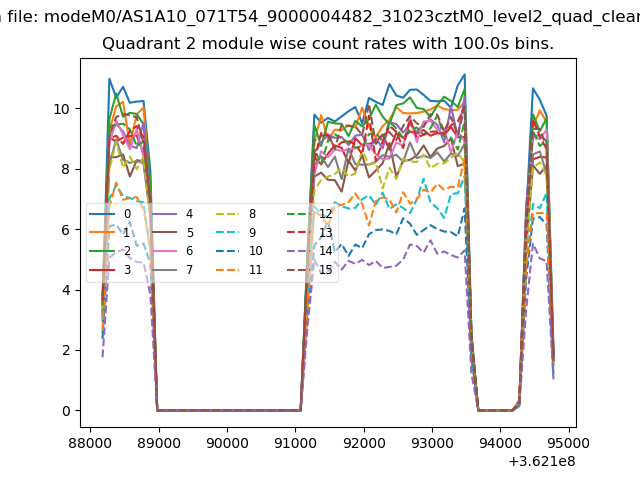
| Module-wise count rates for Quadrant B Data is divided into 100 sec bins |
 |
 |
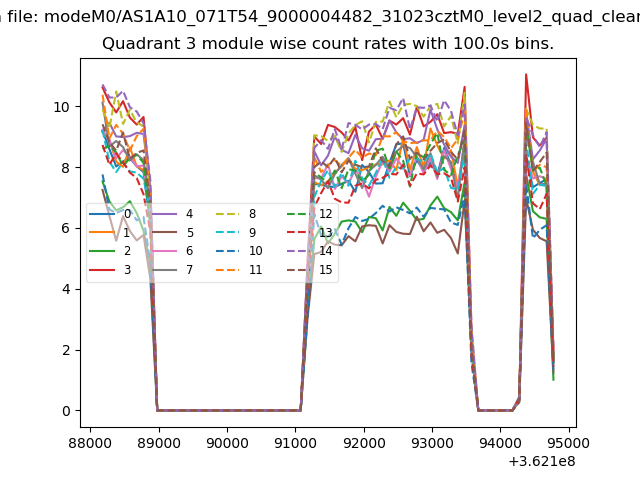
| Module-wise count rates for Quadrant C Data is divided into 100 sec bins |
 |
 |
| Module-wise count rates for Quadrant D Data is divided into 100 sec bins |
 |
 |
| Parameter | Plot |
|---|---|
| CZT HV Monitor | 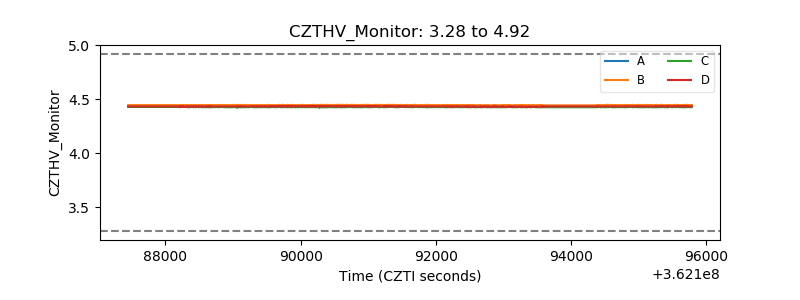 |
| D_VDD | 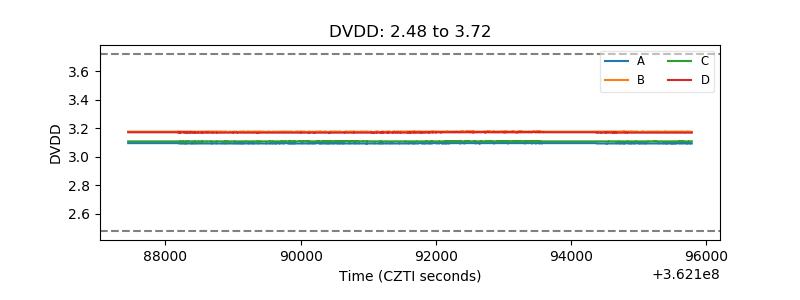 |
| Temperature 1 | 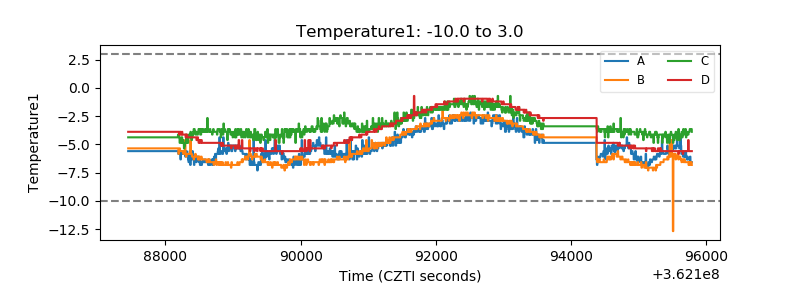 |
| Veto HV Monitor | 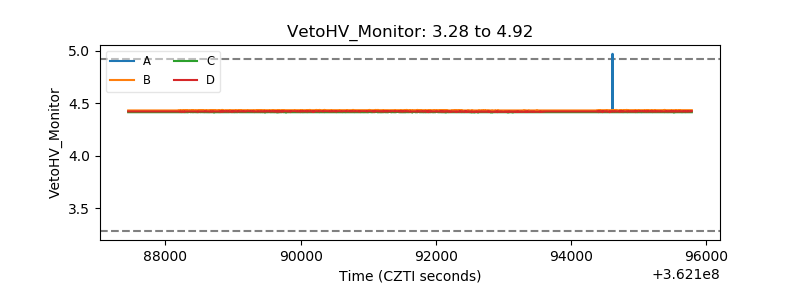 |
| Veto LLD | 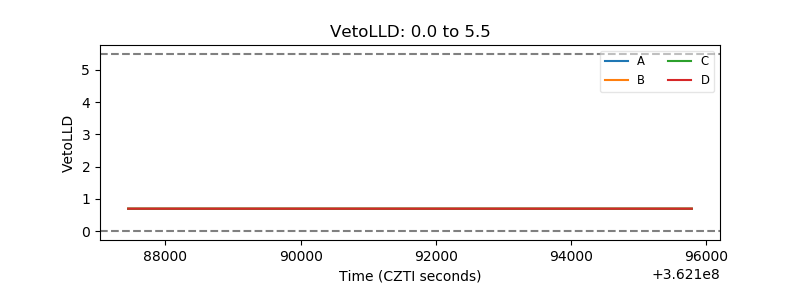 |
| Alpha Counter | 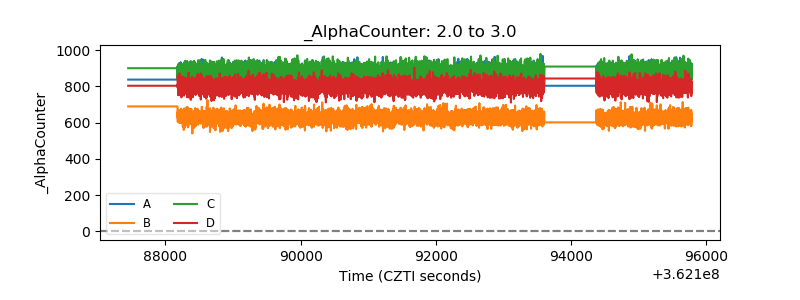 |
| _CPM_Rate | 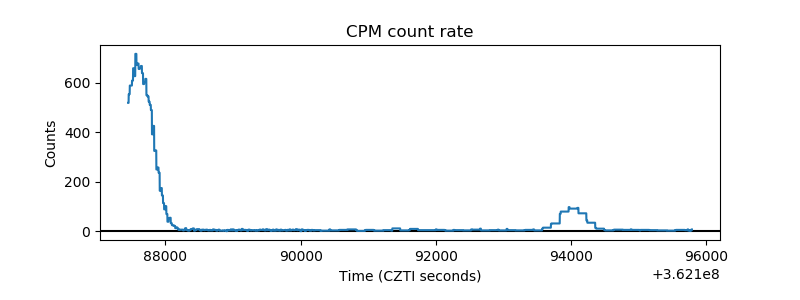 |
| CZT Counter | 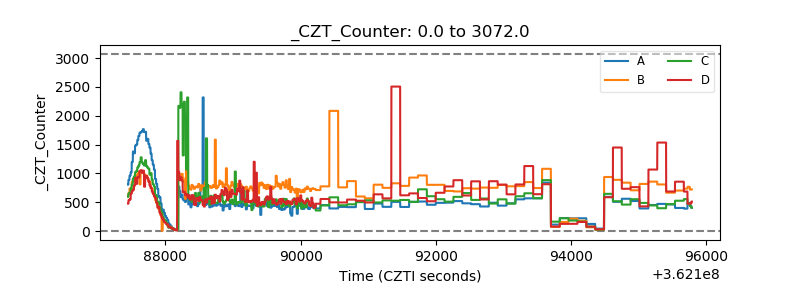 |
| +2.5 Volts monitor |  |
| +5 Volts monitor |  |
| _ROLL_ROT | 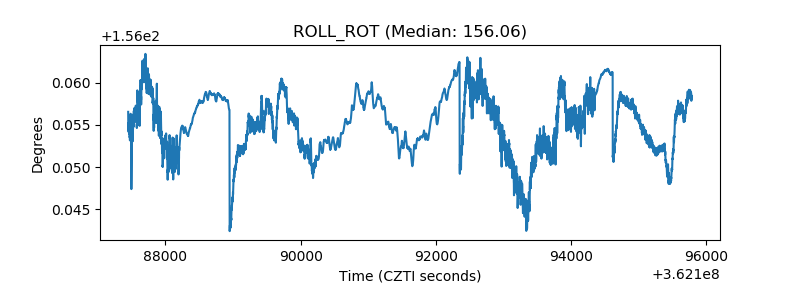 |
| _Roll_DEC | 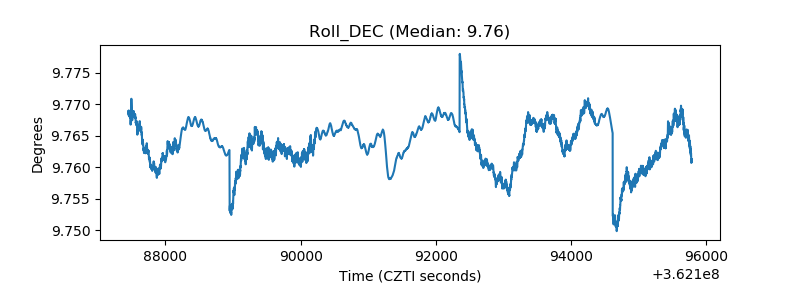 |
| _Roll_RA | 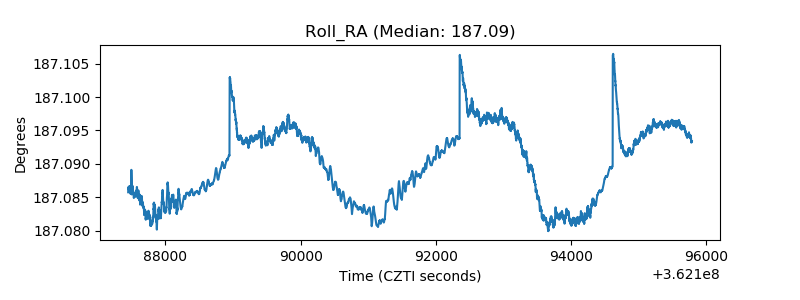 |
| Veto Counter | 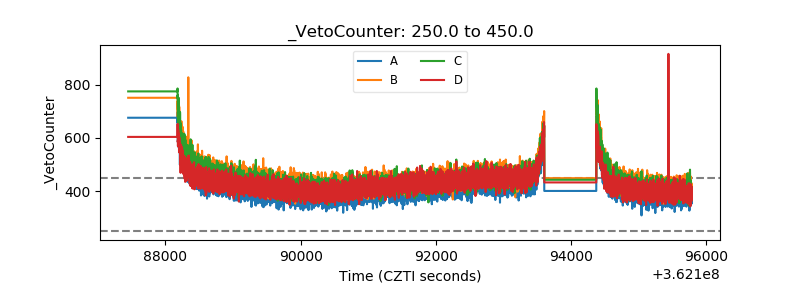 |