| Param | Original file | Final file |
|---|---|---|
| Filename | modeM0/AS1A10_071T54_9000004482_31025cztM0_level2.evt | modeM0/AS1A10_071T54_9000004482_31025cztM0_level2_quad_clean.evt |
| Size (bytes) | 645,266,880 | 77,307,840 |
| Size | 615.4 MB | 73.7 MB |
| Events in quadrant A | 3,697,768 | 466,785 |
| Events in quadrant B | 5,961,805 | 465,655 |
| Events in quadrant C | 3,794,718 | 448,291 |
| Events in quadrant D | 5,574,623 | 432,957 |
| Mode M0 | |||
|---|---|---|---|
| Quadrant | BADHDUFLAG | Total packets | Discarded packets |
| A | 0 | 15803 | 0 |
| B | 0 | 23272 | 0 |
| C | 0 | 15868 | 0 |
| D | 0 | 21650 | 0 |
| Mode SS | |||
|---|---|---|---|
| Quadrant | BADHDUFLAG | Total packets | Discarded packets |
| A | 0 | 152 | 0 |
| B | 0 | 152 | 0 |
| C | 0 | 152 | 0 |
| D | 0 | 152 | 0 |
| Quadrant | Total seconds | Saturated seconds | Saturation percentage |
|---|---|---|---|
| A | 7576 | 290 | 3.827878% |
| B | 7577 | 386 | 5.094365% |
| C | 7576 | 294 | 3.880676% |
| D | 7576 | 386 | 5.095037% |
Noise dominated data is calculated using 1-second bins in cleaned event files. If a bin has >2000 counts, and if more than 50% of those come from <1% of pixels, then it is considered to be noise-dominated and hence unusable.
| Quadrant | # 1 sec bins | Bins with >0 counts | Bins with >2000 counts | High rate bins dominated by noise | Noise dominated (total time) | Noise dominated (detector-on time) | Marked lightcurve |
|---|---|---|---|---|---|---|---|
| A | 7576 | 7576 | 0 | 0 | 0.00% | 0.00% |  |
| B | 7577 | 7577 | 11 | 11 | 0.15% | 0.15% | 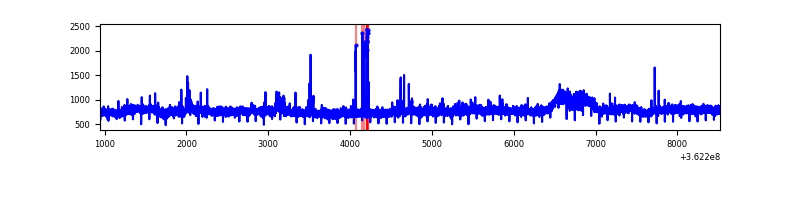 |
| C | 7576 | 7576 | 0 | 0 | 0.00% | 0.00% |  |
| D | 7576 | 7576 | 137 | 137 | 1.81% | 1.81% | 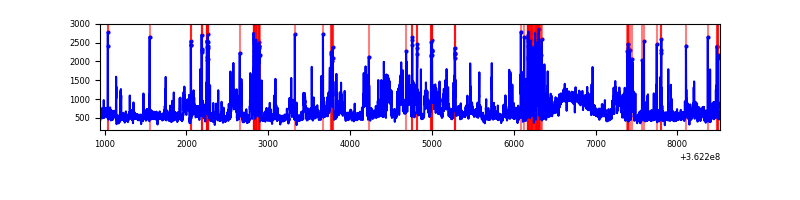 |
Top three noisy pixels from each quadrant. If the there are fewer than three noisy pixels in the level2.evt file, extra rows are filled as -1
| Pixel properties | Quadrant properties | ||||||
|---|---|---|---|---|---|---|---|
| Quadrant | DetID | PixID | Counts | Sigma | Mean | Median | Sigma |
| A | 15 | 174 | 15492 | 74.96 | 953 | 930 | 194.3 |
| A | 13 | 254 | 14618 | 70.46 | 953 | 930 | 194.3 |
| A | 3 | 137 | 10128 | 47.35 | 953 | 930 | 194.3 |
| B | 6 | 159 | 2129870 | 11532.26 | 935 | 908 | 184.6 |
| B | 4 | 52 | 52260 | 278.16 | 935 | 908 | 184.6 |
| B | 0 | 183 | 38417 | 203.18 | 935 | 908 | 184.6 |
| C | 14 | 238 | 145774 | 668.55 | 913 | 919 | 216.7 |
| C | 0 | 10 | 51750 | 234.6 | 913 | 919 | 216.7 |
| C | 2 | 114 | 17793 | 77.88 | 913 | 919 | 216.7 |
| D | 13 | 174 | 1074251 | 4830.43 | 916 | 888 | 222.2 |
| D | 8 | 195 | 492631 | 2212.98 | 916 | 888 | 222.2 |
| D | 12 | 4 | 291238 | 1306.66 | 916 | 888 | 222.2 |
Histogram calculated using DETX and DETY for each event in the final _common_clean file
| Quadrant A | 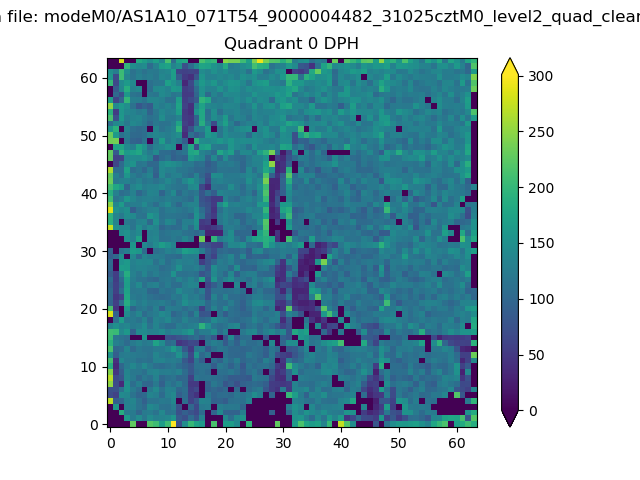 |
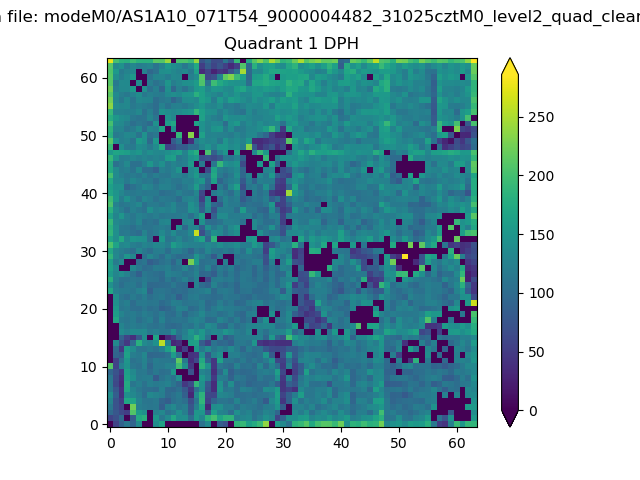 |
Quadrant B |
|---|---|---|---|
| Quadrant D | 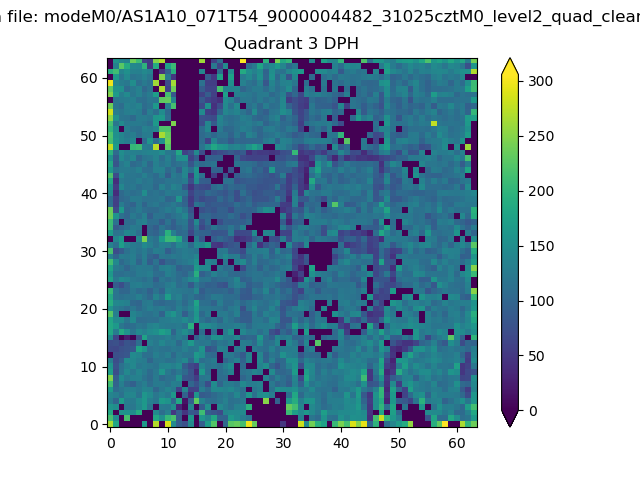 |
 |
Quadrant C |
| Plot type | Count rate plots | Images |
|---|---|---|
| Comparison with Poisson distribution Blue bars denote a histogram of data divided into 1 sec bins. Red curve is a Poisson curve with rate = median count rate of data. |
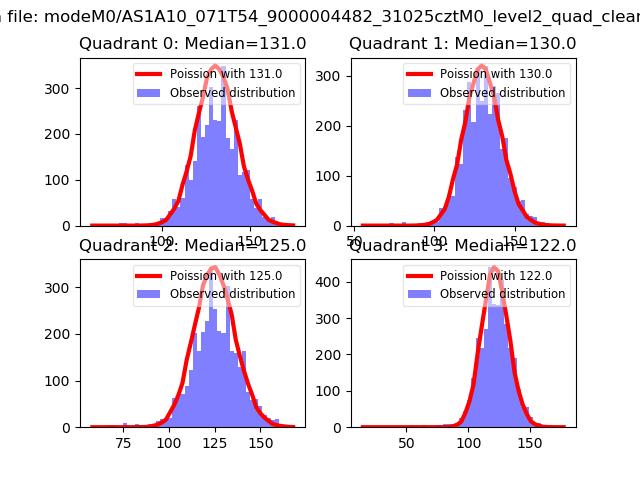 |
 |
| Quadrant-wise count rates Data is divided into 100 sec bins |
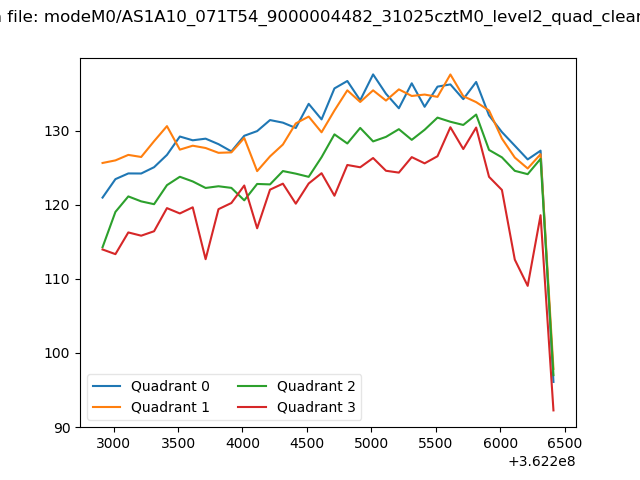 |
|
| Module-wise count rates for Quadrant A Data is divided into 100 sec bins |
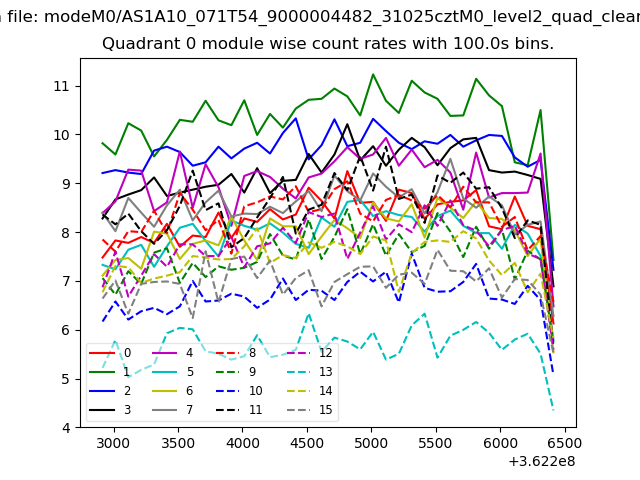 |
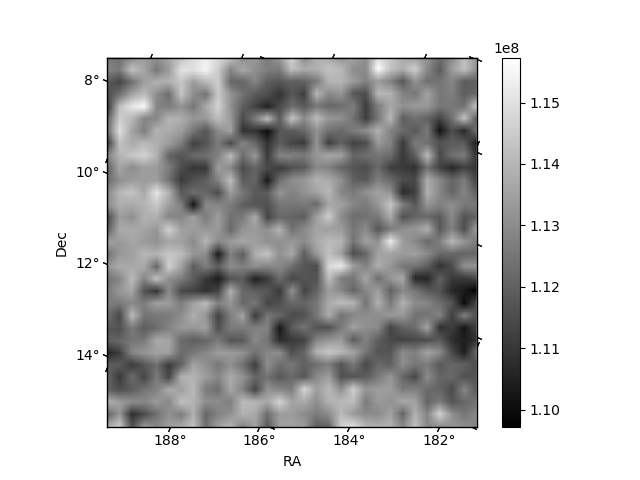 |
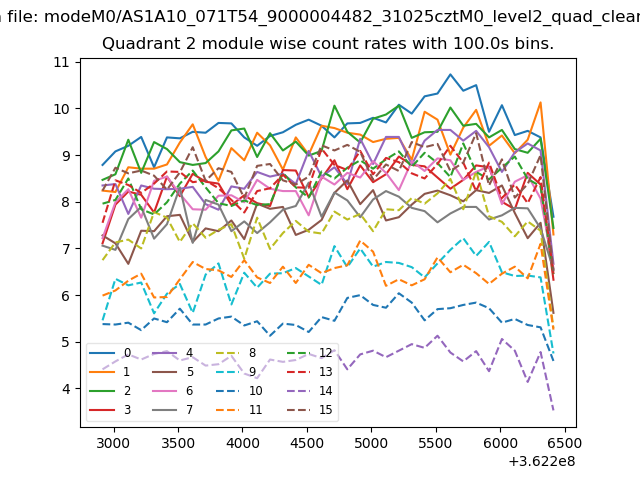
| Module-wise count rates for Quadrant B Data is divided into 100 sec bins |
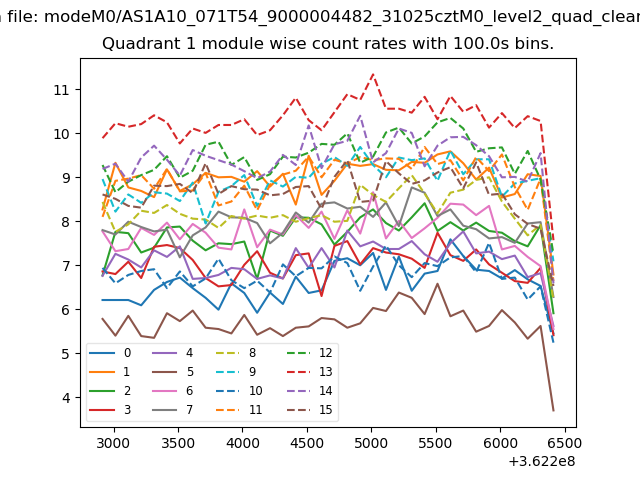 |
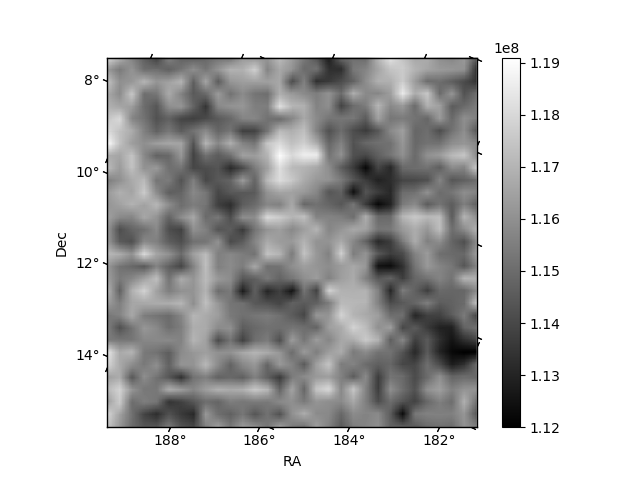 |
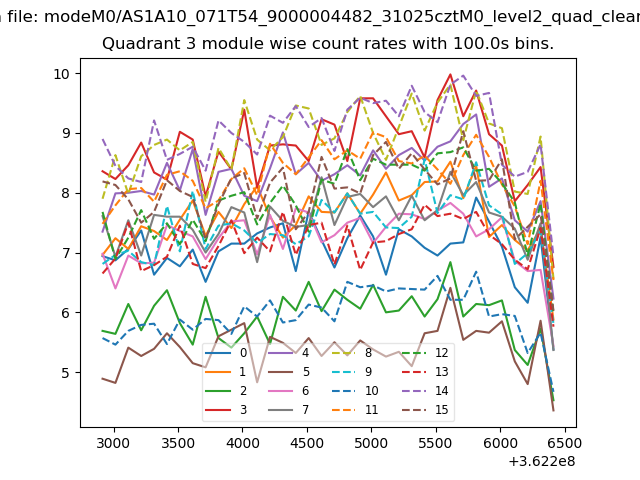
| Module-wise count rates for Quadrant C Data is divided into 100 sec bins |
 |
 |
| Module-wise count rates for Quadrant D Data is divided into 100 sec bins |
 |
 |
| Parameter | Plot |
|---|---|
| CZT HV Monitor | 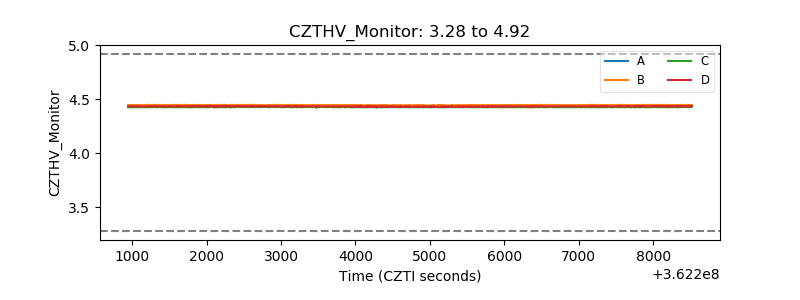 |
| D_VDD | 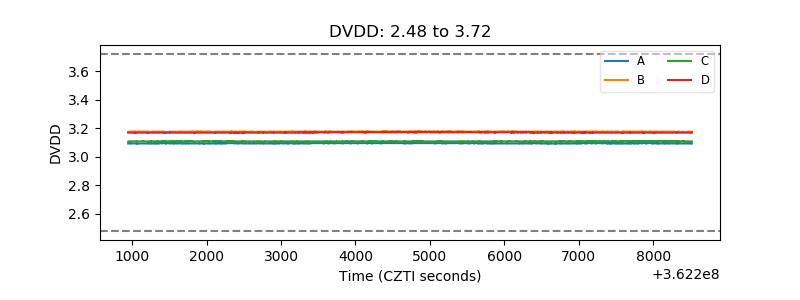 |
| Temperature 1 | 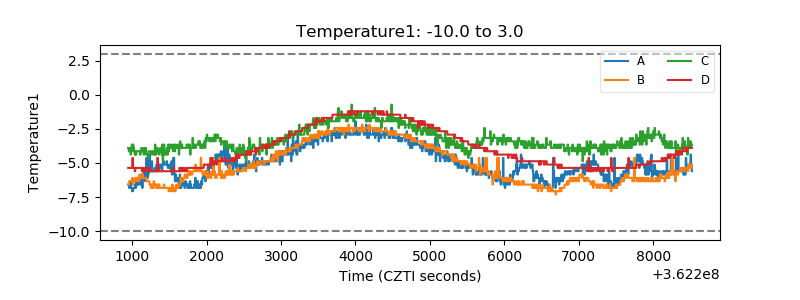 |
| Veto HV Monitor | 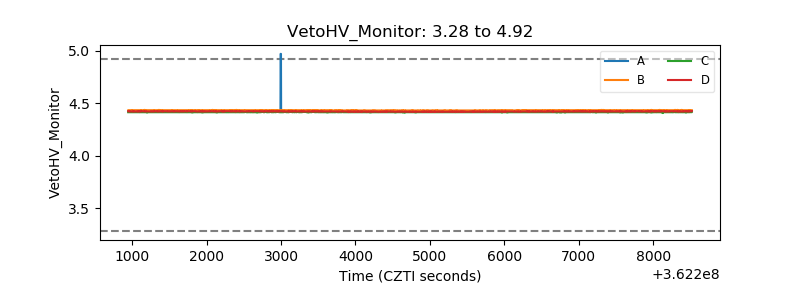 |
| Veto LLD | 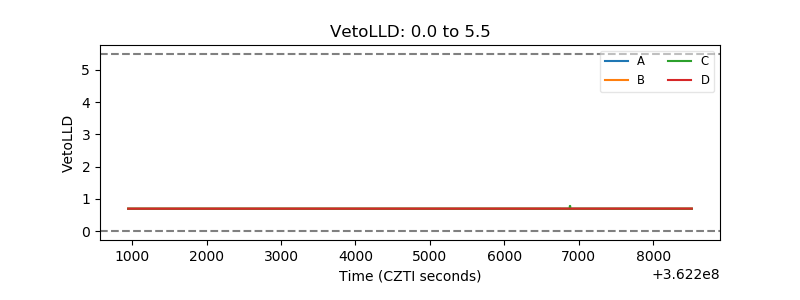 |
| Alpha Counter | 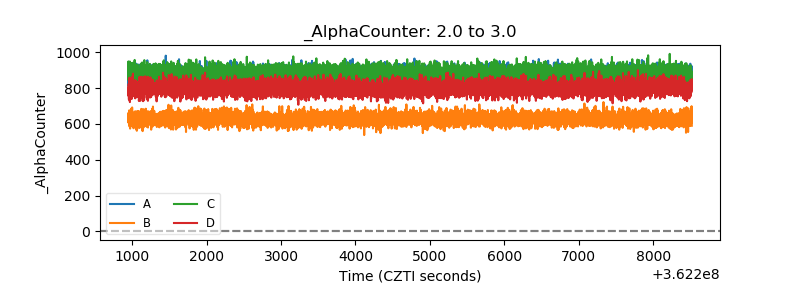 |
| _CPM_Rate | 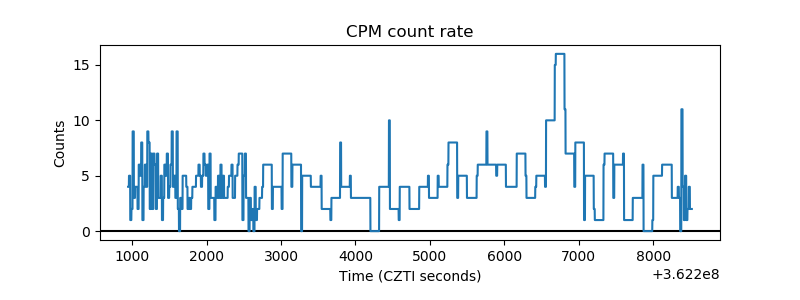 |
| CZT Counter | 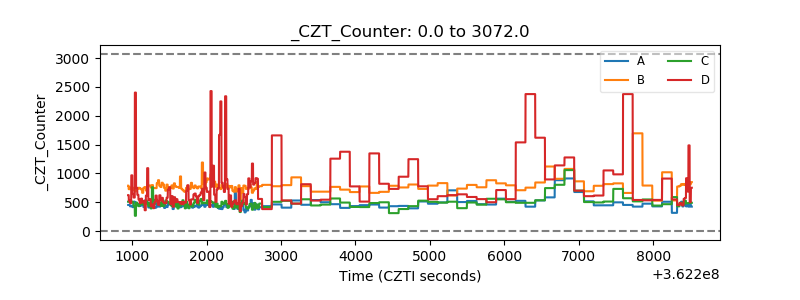 |
| +2.5 Volts monitor |  |
| +5 Volts monitor |  |
| _ROLL_ROT | 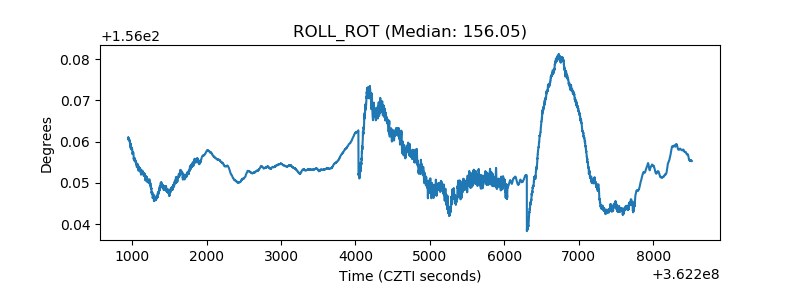 |
| _Roll_DEC | 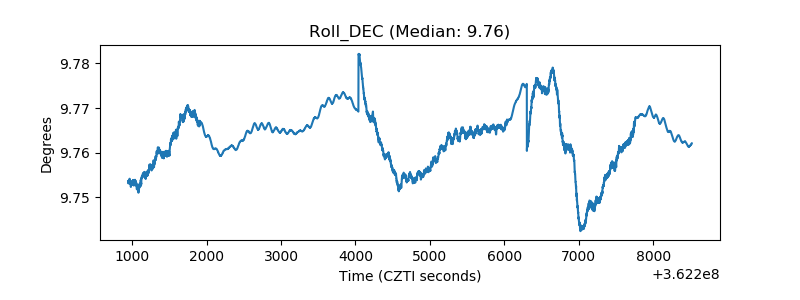 |
| _Roll_RA | 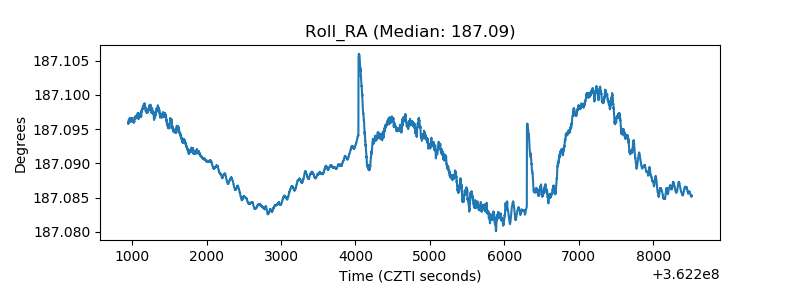 |
| Veto Counter | 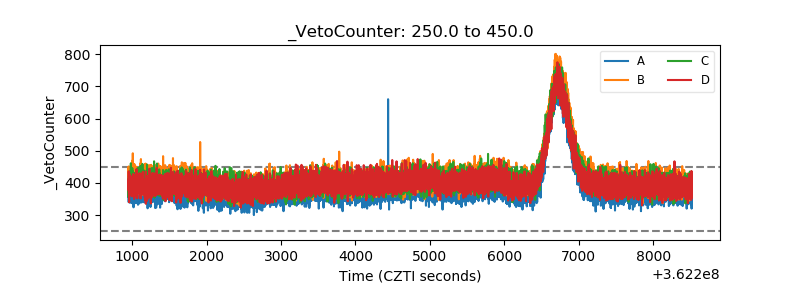 |