| Param | Original file | Final file |
|---|---|---|
| Filename | modeM0/AS1A10_071T54_9000004482_31026cztM0_level2.evt | modeM0/AS1A10_071T54_9000004482_31026cztM0_level2_quad_clean.evt |
| Size (bytes) | 598,631,040 | 81,028,800 |
| Size | 570.9 MB | 77.3 MB |
| Events in quadrant A | 3,523,624 | 496,782 |
| Events in quadrant B | 5,745,251 | 496,862 |
| Events in quadrant C | 3,616,416 | 477,647 |
| Events in quadrant D | 4,740,658 | 464,752 |
| Mode M0 | |||
|---|---|---|---|
| Quadrant | BADHDUFLAG | Total packets | Discarded packets |
| A | 0 | 15146 | 1 |
| B | 0 | 22561 | 1 |
| C | 0 | 15194 | 1 |
| D | 0 | 18759 | 1 |
| Mode M9 | |||
|---|---|---|---|
| Quadrant | BADHDUFLAG | Total packets | Discarded packets |
| A | 0 | 3 | 0 |
| B | 0 | 3 | 0 |
| C | 0 | 3 | 0 |
| D | 0 | 3 | 0 |
| Mode SS | |||
|---|---|---|---|
| Quadrant | BADHDUFLAG | Total packets | Discarded packets |
| A | 0 | 152 | 0 |
| B | 0 | 152 | 0 |
| C | 0 | 152 | 0 |
| D | 0 | 152 | 0 |
| Quadrant | Total seconds | Saturated seconds | Saturation percentage |
|---|---|---|---|
| A | 7430 | 100 | 1.345895% |
| B | 7431 | 196 | 2.637599% |
| C | 7431 | 150 | 2.018571% |
| D | 7431 | 198 | 2.664514% |
Noise dominated data is calculated using 1-second bins in cleaned event files. If a bin has >2000 counts, and if more than 50% of those come from <1% of pixels, then it is considered to be noise-dominated and hence unusable.
| Quadrant | # 1 sec bins | Bins with >0 counts | Bins with >2000 counts | High rate bins dominated by noise | Noise dominated (total time) | Noise dominated (detector-on time) | Marked lightcurve |
|---|---|---|---|---|---|---|---|
| A | 7750 | 7430 | 0 | 0 | 0.00% | 0.00% | 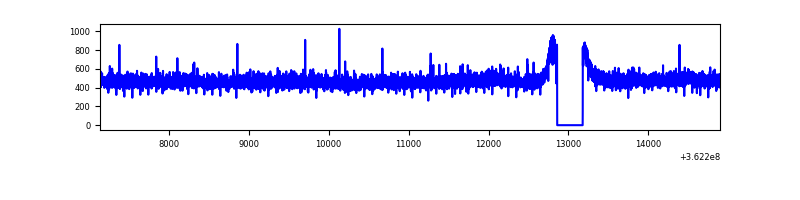 |
| B | 7751 | 7431 | 2 | 2 | 0.03% | 0.03% | 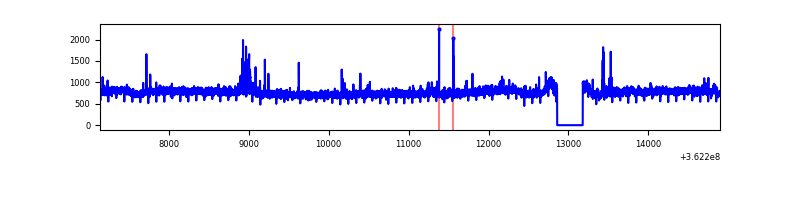 |
| C | 7751 | 7431 | 0 | 0 | 0.00% | 0.00% | 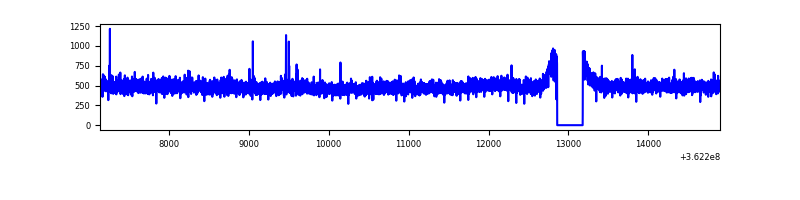 |
| D | 7751 | 7431 | 106 | 106 | 1.37% | 1.43% | 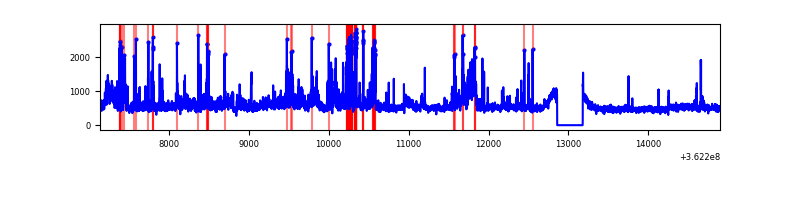 |
Top three noisy pixels from each quadrant. If the there are fewer than three noisy pixels in the level2.evt file, extra rows are filled as -1
| Pixel properties | Quadrant properties | ||||||
|---|---|---|---|---|---|---|---|
| Quadrant | DetID | PixID | Counts | Sigma | Mean | Median | Sigma |
| A | 13 | 254 | 14918 | 75.59 | 911 | 888 | 185.6 |
| A | 3 | 137 | 9522 | 46.52 | 911 | 888 | 185.6 |
| A | 0 | 226 | 7396 | 35.06 | 911 | 888 | 185.6 |
| B | 6 | 159 | 2063307 | 11624.19 | 899 | 873 | 177.4 |
| B | 15 | 33 | 43428 | 239.85 | 899 | 873 | 177.4 |
| B | 0 | 190 | 41653 | 229.84 | 899 | 873 | 177.4 |
| C | 14 | 238 | 140082 | 671.7 | 871 | 876 | 207.2 |
| C | 0 | 10 | 38652 | 182.28 | 871 | 876 | 207.2 |
| C | 2 | 114 | 17170 | 78.62 | 871 | 876 | 207.2 |
| D | 13 | 174 | 744453 | 3581.94 | 872 | 849 | 207.6 |
| D | 8 | 195 | 434396 | 2088.39 | 872 | 849 | 207.6 |
| D | 2 | 250 | 144140 | 690.23 | 872 | 849 | 207.6 |
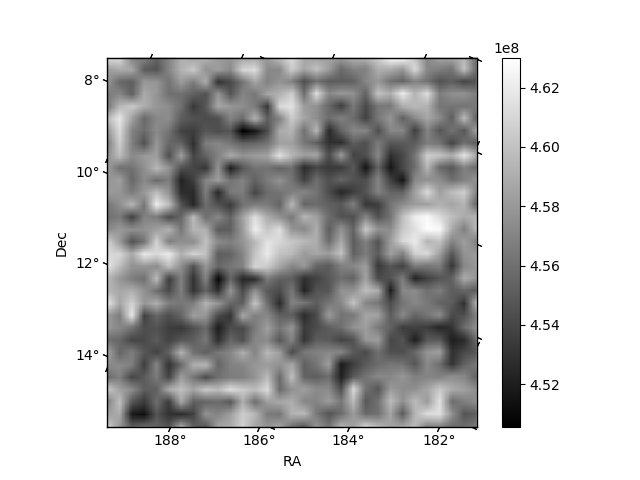
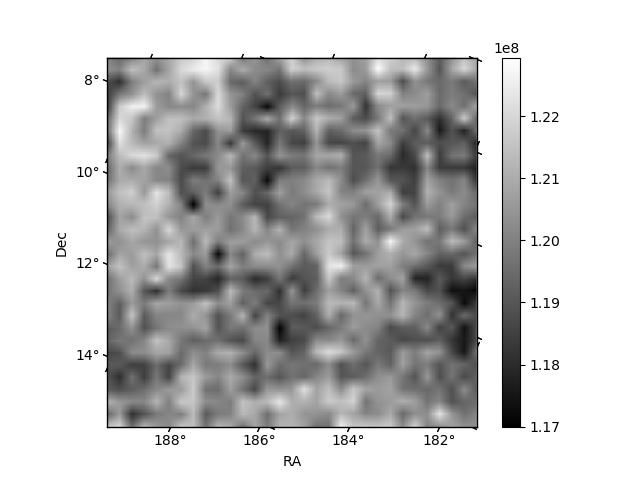
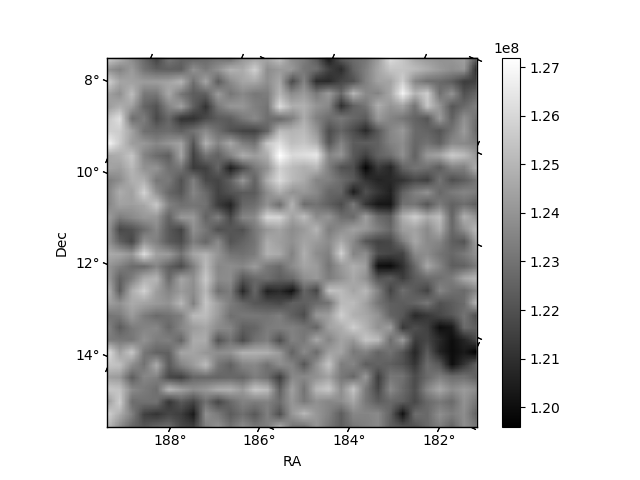
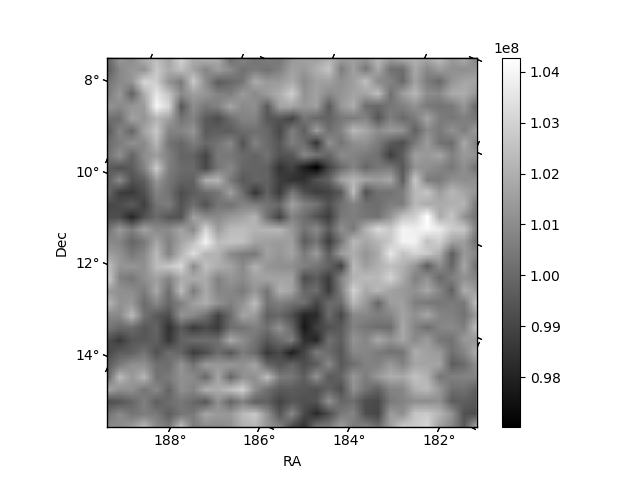
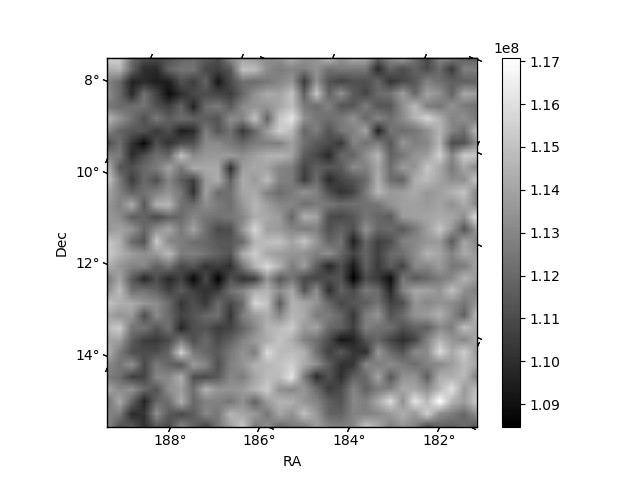
Histogram calculated using DETX and DETY for each event in the final _common_clean file
| Quadrant A | 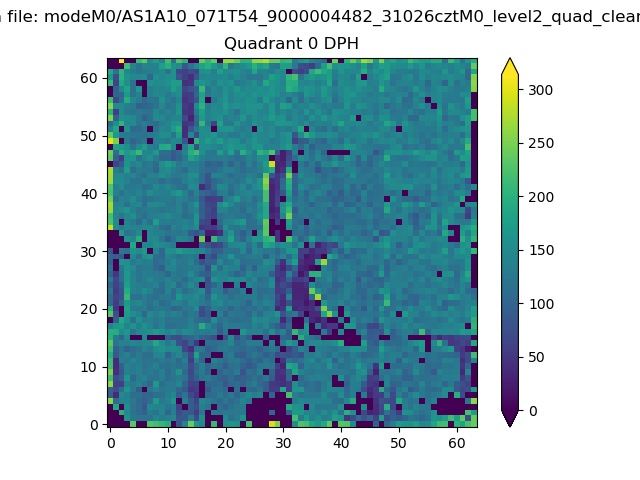 |
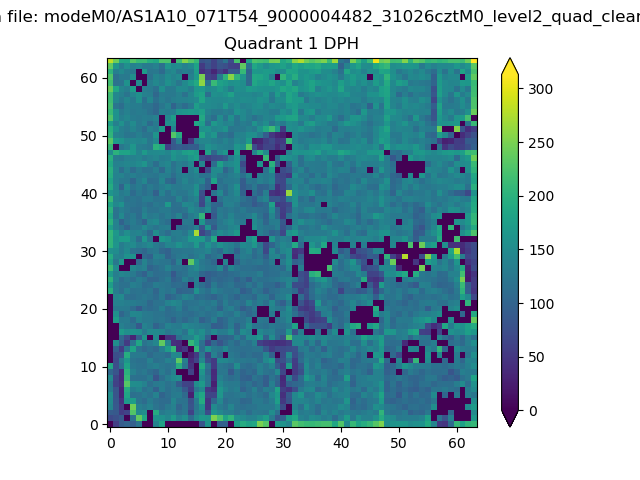 |
Quadrant B |
|---|---|---|---|
| Quadrant D | 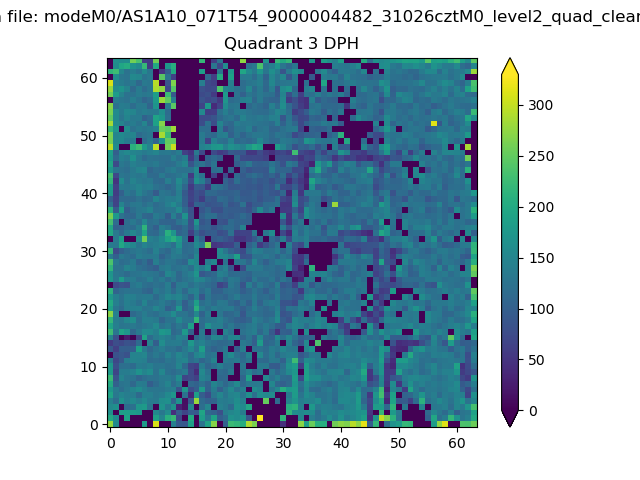 |
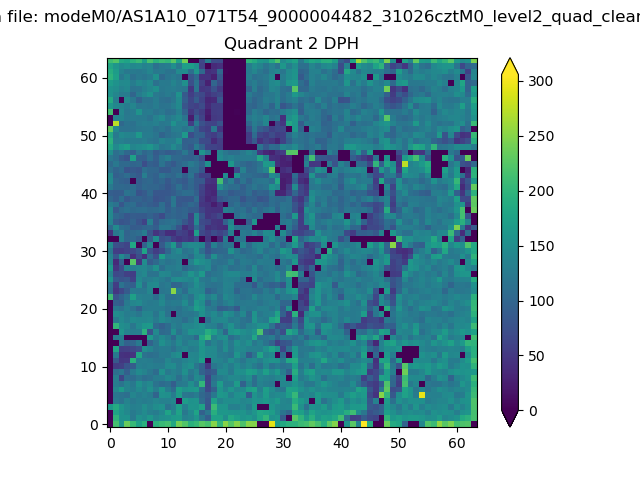 |
Quadrant C |
| Plot type | Count rate plots | Images |
|---|---|---|
| Comparison with Poisson distribution Blue bars denote a histogram of data divided into 1 sec bins. Red curve is a Poisson curve with rate = median count rate of data. |
 |
 |
| Quadrant-wise count rates Data is divided into 100 sec bins |
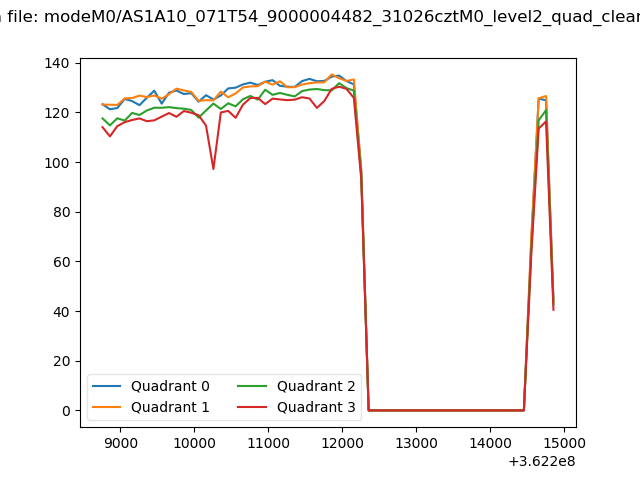 |
|
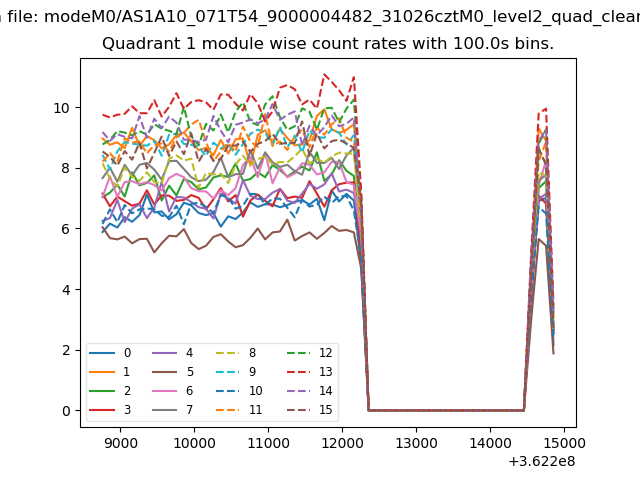
| Module-wise count rates for Quadrant A Data is divided into 100 sec bins |
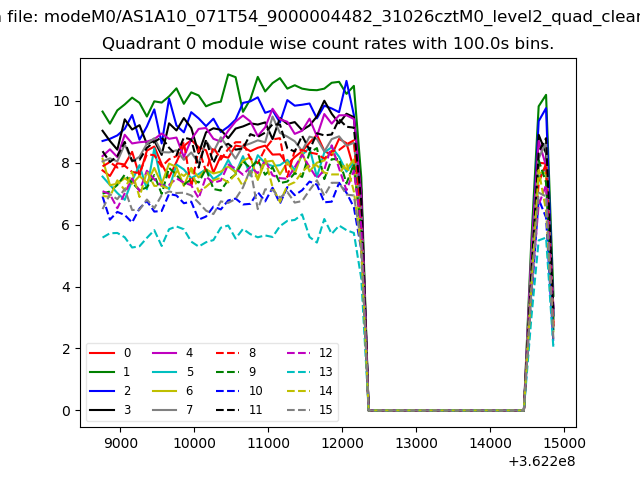 |
 |
| Module-wise count rates for Quadrant B Data is divided into 100 sec bins |
 |
 |
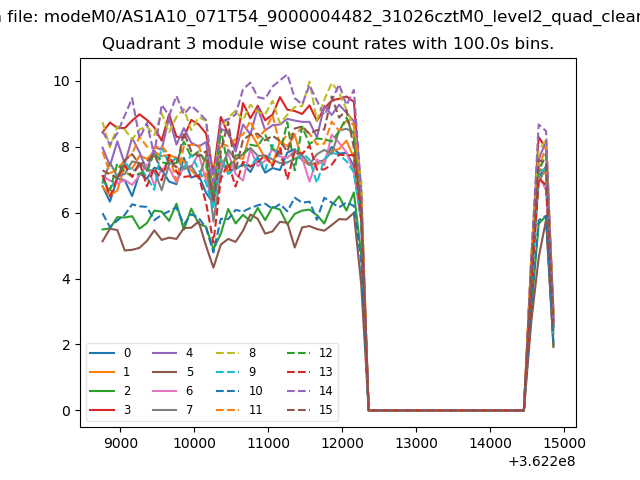
| Module-wise count rates for Quadrant C Data is divided into 100 sec bins |
 |
 |
| Module-wise count rates for Quadrant D Data is divided into 100 sec bins |
 |
 |
| Parameter | Plot |
|---|---|
| CZT HV Monitor | 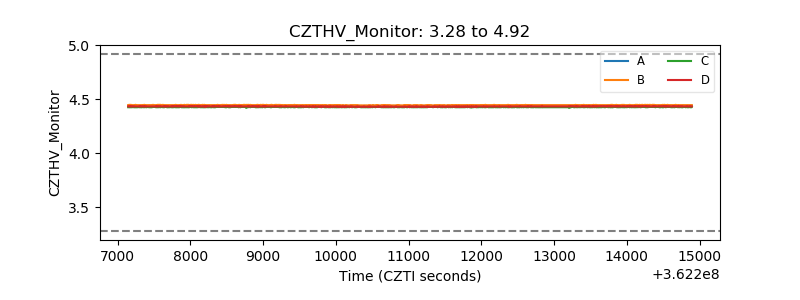 |
| D_VDD | 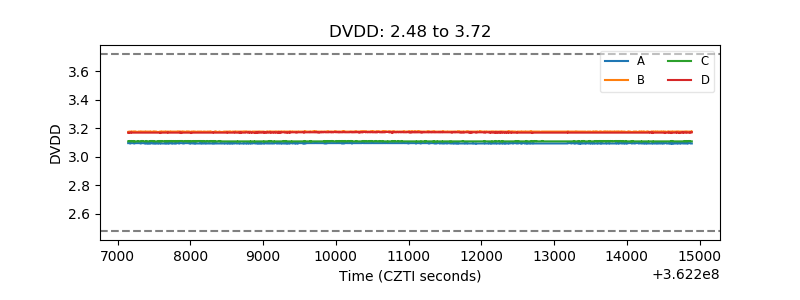 |
| Temperature 1 | 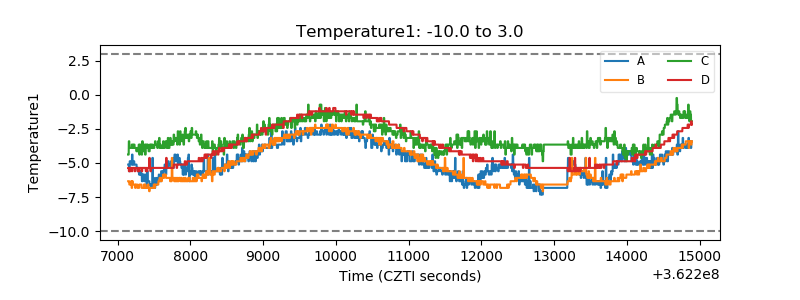 |
| Veto HV Monitor | 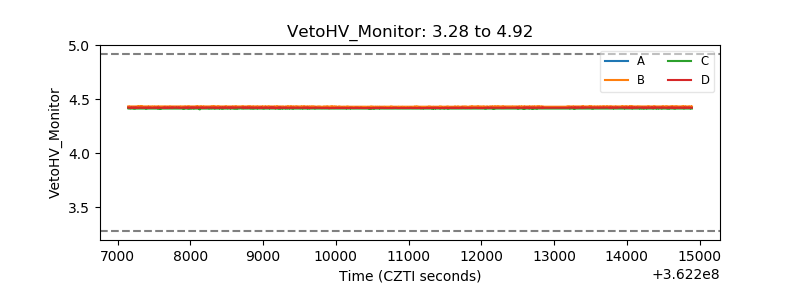 |
| Veto LLD | 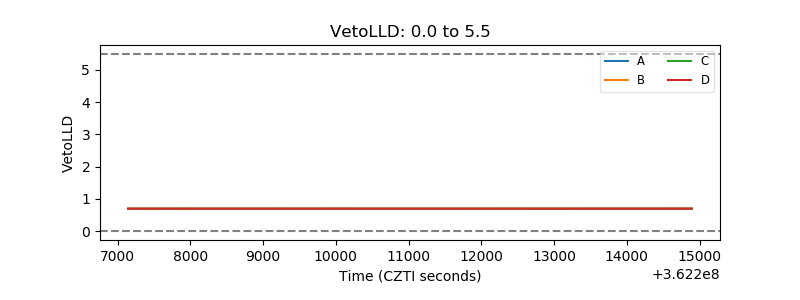 |
| Alpha Counter | 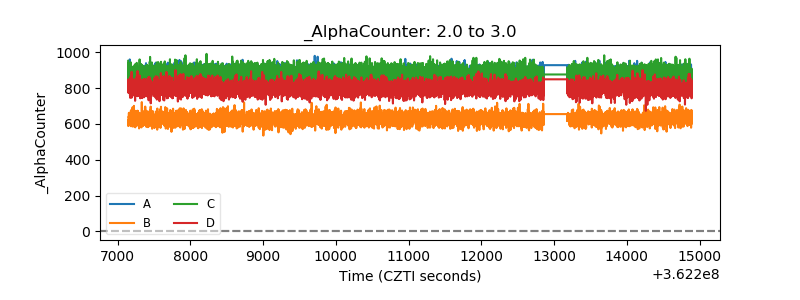 |
| _CPM_Rate | 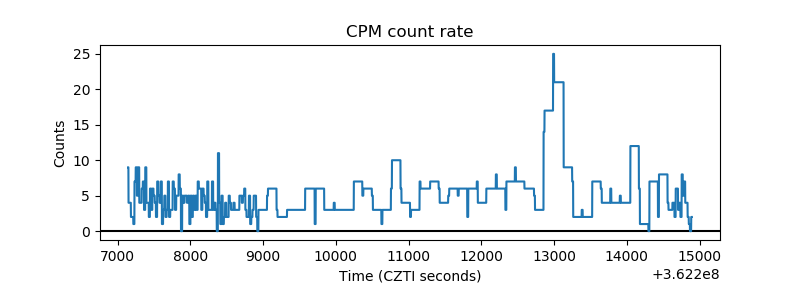 |
| CZT Counter | 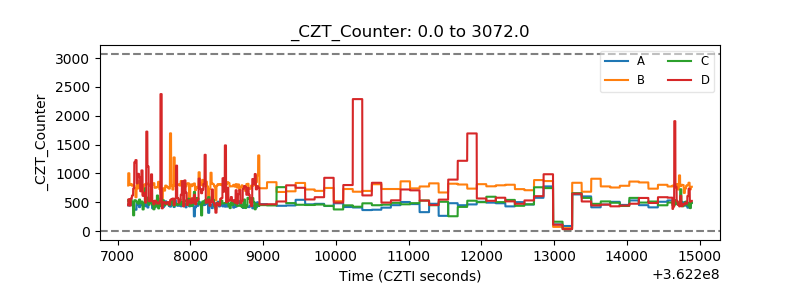 |
| +2.5 Volts monitor | 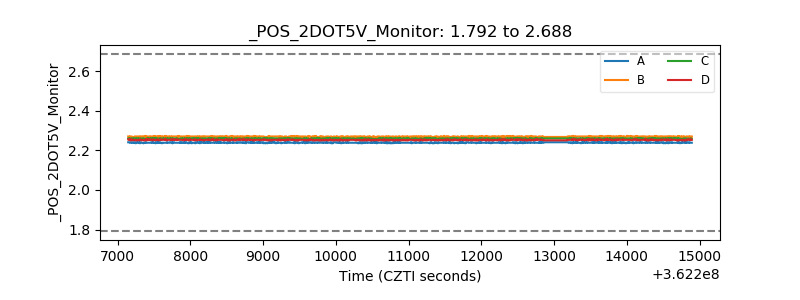 |
| +5 Volts monitor |  |
| _ROLL_ROT | 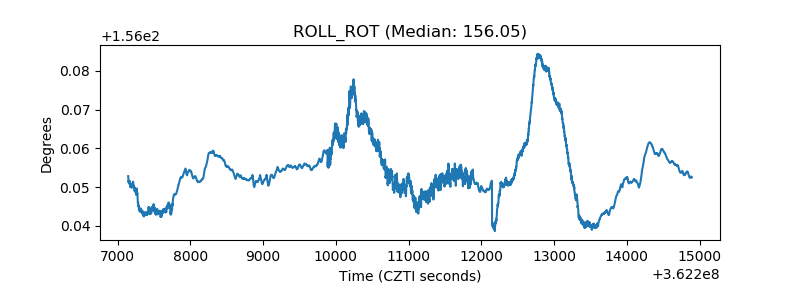 |
| _Roll_DEC | 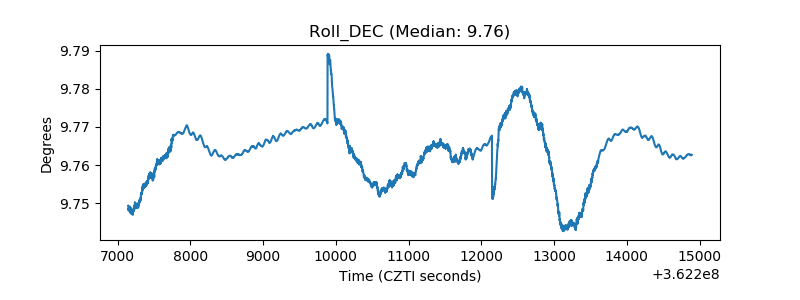 |
| _Roll_RA |  |
| Veto Counter | 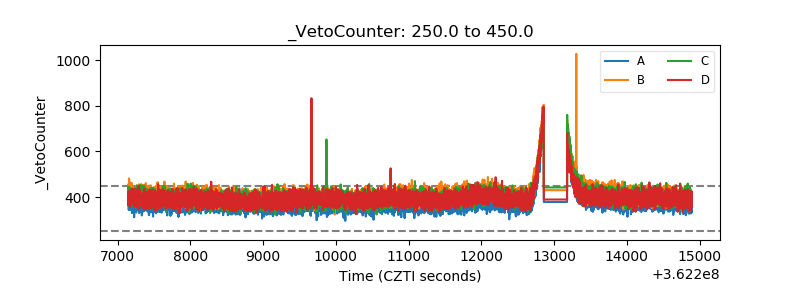 |