| Param | Original file | Final file |
|---|---|---|
| Filename | modeM0/AS1A10_071T54_9000004482_31028cztM0_level2.evt | modeM0/AS1A10_071T54_9000004482_31028cztM0_level2_quad_clean.evt |
| Size (bytes) | 1,018,774,080 | 163,814,400 |
| Size | 971.6 MB | 156.2 MB |
| Events in quadrant A | 5,980,458 | 1,053,638 |
| Events in quadrant B | 10,061,666 | 1,044,923 |
| Events in quadrant C | 6,171,389 | 1,010,660 |
| Events in quadrant D | 7,790,271 | 982,172 |
| Mode M0 | |||
|---|---|---|---|
| Quadrant | BADHDUFLAG | Total packets | Discarded packets |
| A | 0 | 25659 | 2 |
| B | 0 | 39136 | 2 |
| C | 0 | 25831 | 2 |
| D | 0 | 31248 | 2 |
| Mode M9 | |||
|---|---|---|---|
| Quadrant | BADHDUFLAG | Total packets | Discarded packets |
| A | 0 | 12 | 0 |
| B | 0 | 12 | 0 |
| C | 0 | 12 | 0 |
| D | 0 | 12 | 0 |
| Mode SS | |||
|---|---|---|---|
| Quadrant | BADHDUFLAG | Total packets | Discarded packets |
| A | 0 | 256 | 0 |
| B | 0 | 256 | 0 |
| C | 0 | 256 | 0 |
| D | 0 | 256 | 0 |
| Quadrant | Total seconds | Saturated seconds | Saturation percentage |
|---|---|---|---|
| A | 12586 | 140 | 1.112347% |
| B | 12587 | 435 | 3.455947% |
| C | 12587 | 208 | 1.652499% |
| D | 12587 | 248 | 1.970287% |
Noise dominated data is calculated using 1-second bins in cleaned event files. If a bin has >2000 counts, and if more than 50% of those come from <1% of pixels, then it is considered to be noise-dominated and hence unusable.
| Quadrant | # 1 sec bins | Bins with >0 counts | Bins with >2000 counts | High rate bins dominated by noise | Noise dominated (total time) | Noise dominated (detector-on time) | Marked lightcurve |
|---|---|---|---|---|---|---|---|
| A | 13801 | 12586 | 0 | 0 | 0.00% | 0.00% | 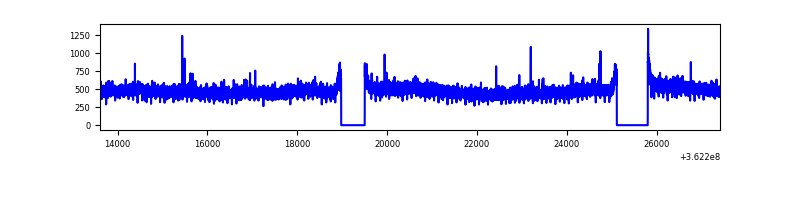 |
| B | 13802 | 12587 | 151 | 151 | 1.09% | 1.20% | 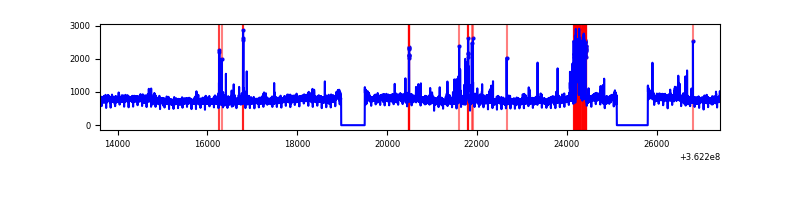 |
| C | 13802 | 12587 | 0 | 0 | 0.00% | 0.00% | 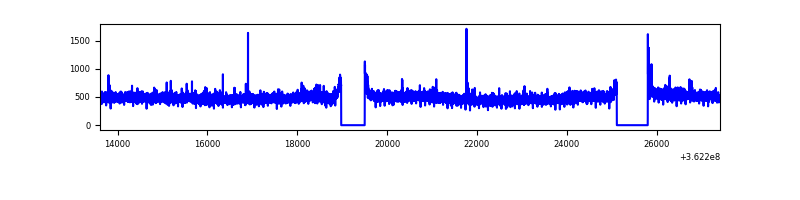 |
| D | 13802 | 12587 | 121 | 121 | 0.88% | 0.96% | 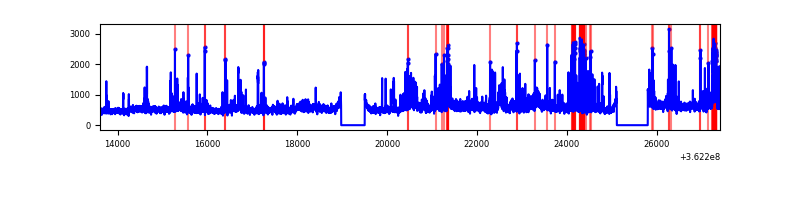 |
Top three noisy pixels from each quadrant. If the there are fewer than three noisy pixels in the level2.evt file, extra rows are filled as -1
| Pixel properties | Quadrant properties | ||||||
|---|---|---|---|---|---|---|---|
| Quadrant | DetID | PixID | Counts | Sigma | Mean | Median | Sigma |
| A | 13 | 254 | 23840 | 72.64 | 1544 | 1511 | 307.4 |
| A | 3 | 137 | 16264 | 47.99 | 1544 | 1511 | 307.4 |
| A | 0 | 226 | 13068 | 37.6 | 1544 | 1511 | 307.4 |
| B | 6 | 159 | 3481125 | 11883.73 | 1513 | 1472 | 292.8 |
| B | 4 | 52 | 355168 | 1207.94 | 1513 | 1472 | 292.8 |
| B | 0 | 183 | 79514 | 266.53 | 1513 | 1472 | 292.8 |
| C | 14 | 238 | 237626 | 680.04 | 1478 | 1486 | 347.2 |
| C | 3 | 233 | 72191 | 203.62 | 1478 | 1486 | 347.2 |
| C | 0 | 10 | 45885 | 127.86 | 1478 | 1486 | 347.2 |
| D | 8 | 195 | 1087200 | 3084.35 | 1483 | 1442 | 352.0 |
| D | 2 | 250 | 292282 | 826.2 | 1483 | 1442 | 352.0 |
| D | 12 | 218 | 288863 | 816.49 | 1483 | 1442 | 352.0 |
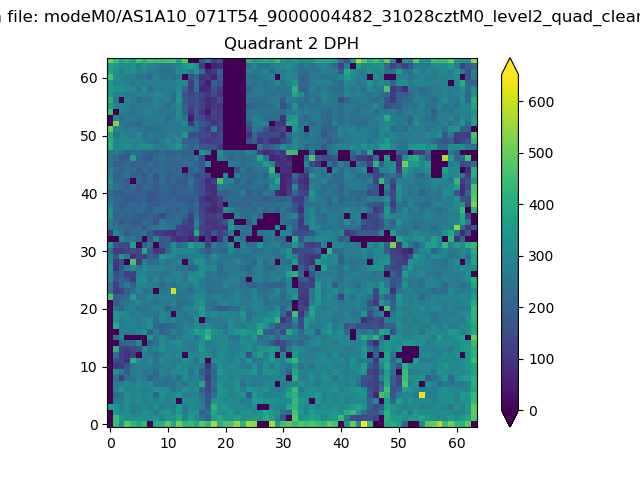
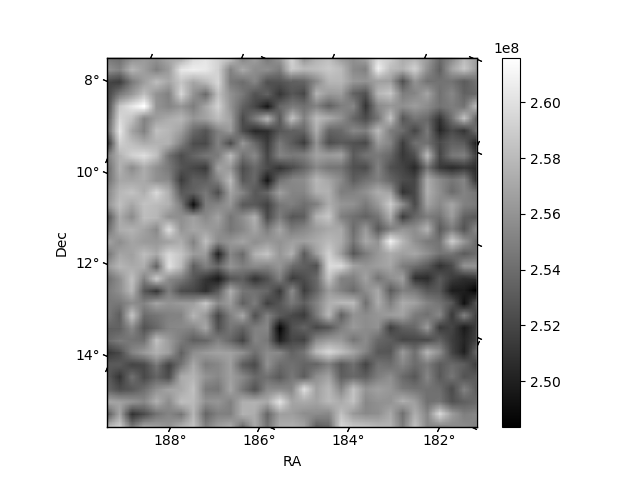
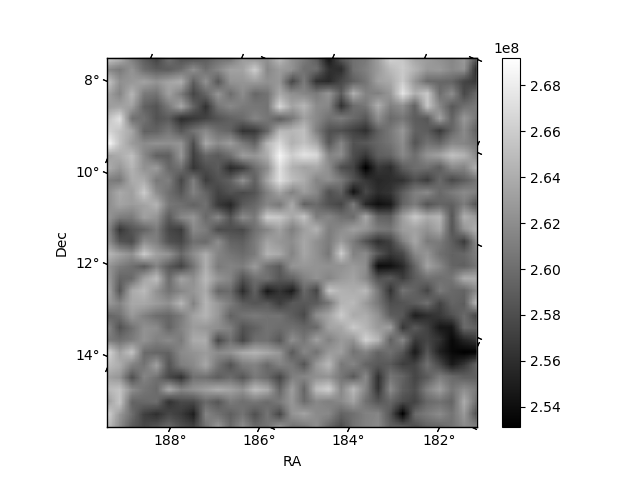
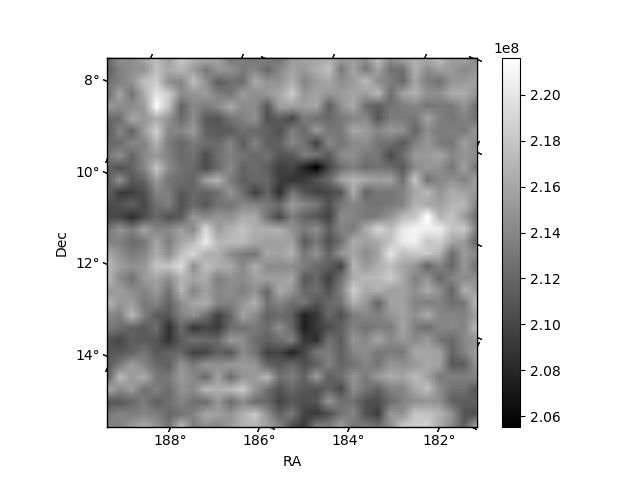
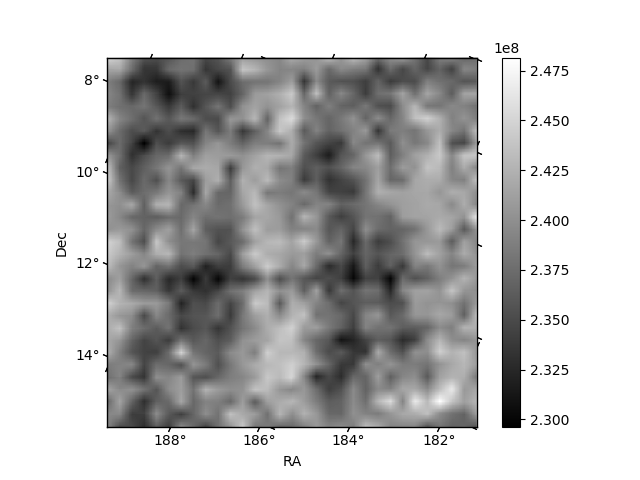
Histogram calculated using DETX and DETY for each event in the final _common_clean file
| Quadrant A | 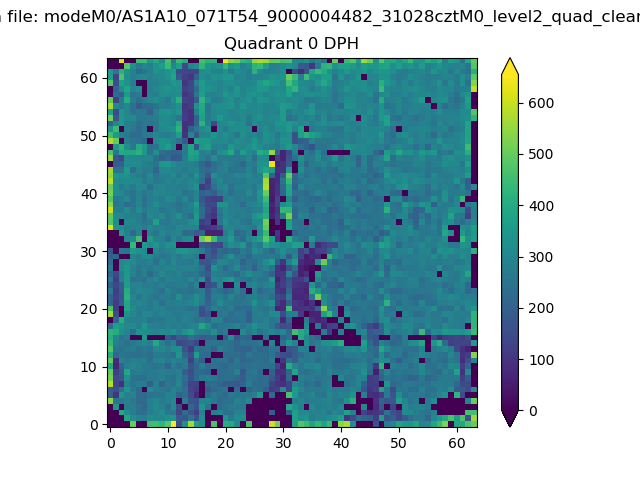 |
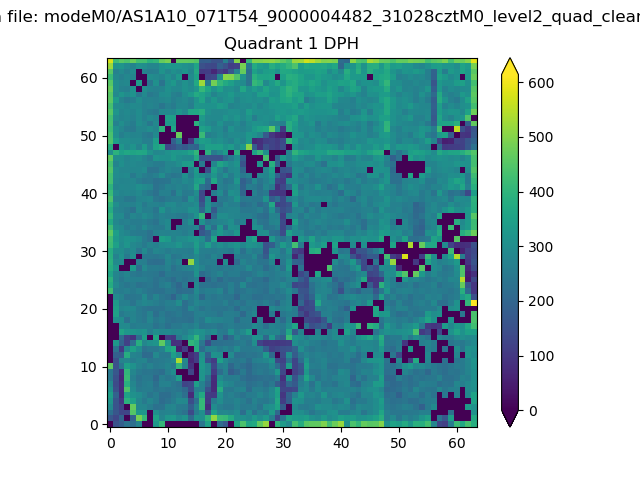 |
Quadrant B |
|---|---|---|---|
| Quadrant D | 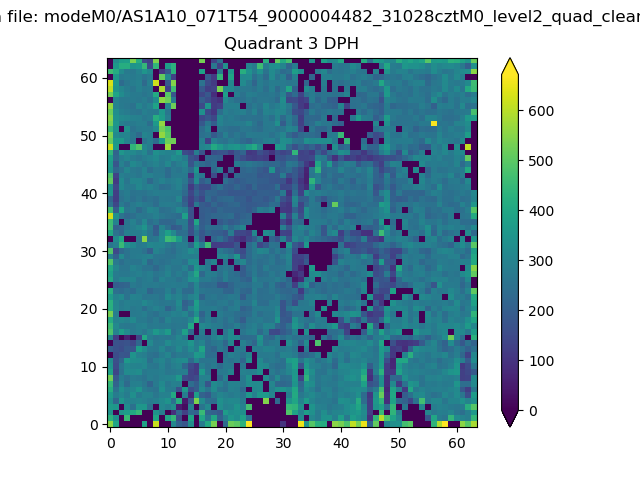 |
 |
Quadrant C |
| Plot type | Count rate plots | Images |
|---|---|---|
| Comparison with Poisson distribution Blue bars denote a histogram of data divided into 1 sec bins. Red curve is a Poisson curve with rate = median count rate of data. |
 |
 |
| Quadrant-wise count rates Data is divided into 100 sec bins |
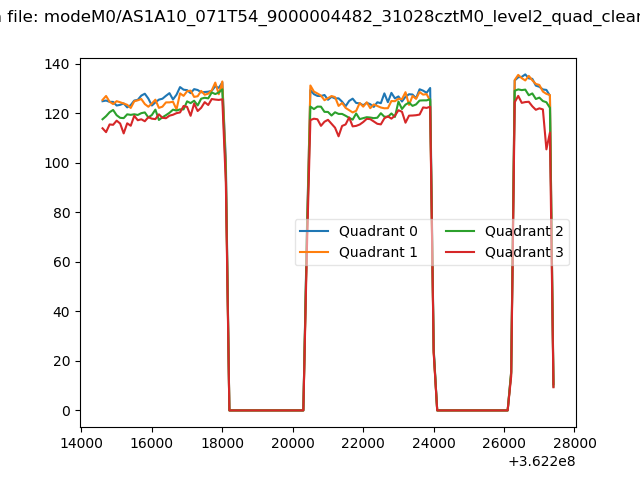 |
|
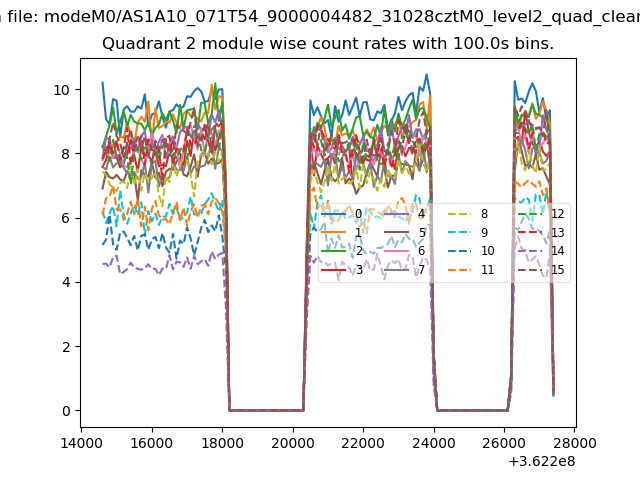
| Module-wise count rates for Quadrant A Data is divided into 100 sec bins |
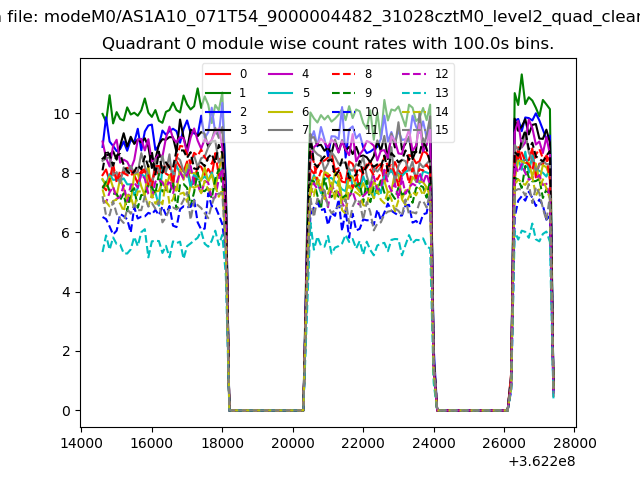 |
 |
| Module-wise count rates for Quadrant B Data is divided into 100 sec bins |
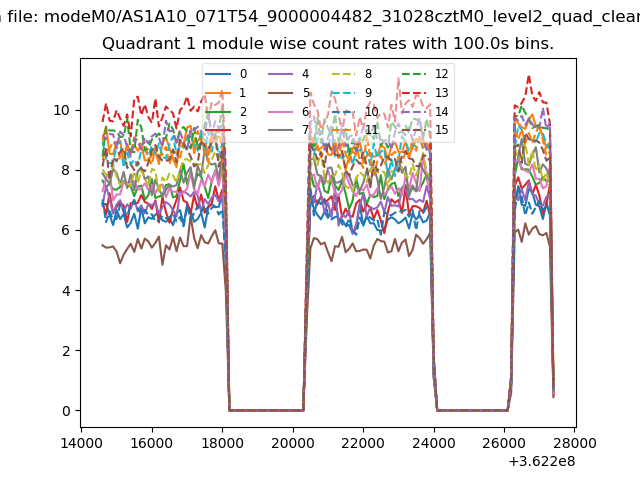 |
 |
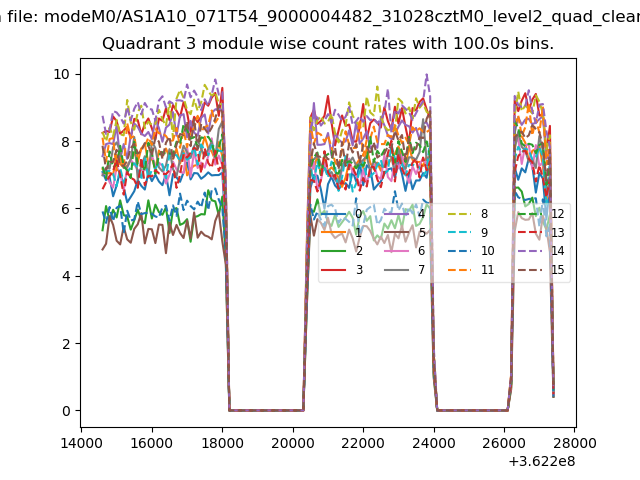
| Module-wise count rates for Quadrant C Data is divided into 100 sec bins |
 |
 |
| Module-wise count rates for Quadrant D Data is divided into 100 sec bins |
 |
 |
| Parameter | Plot |
|---|---|
| CZT HV Monitor | 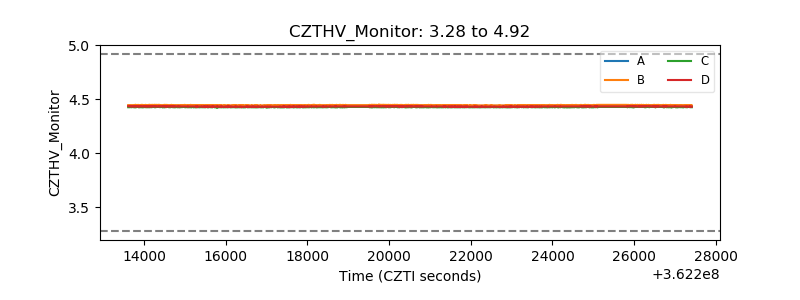 |
| D_VDD | 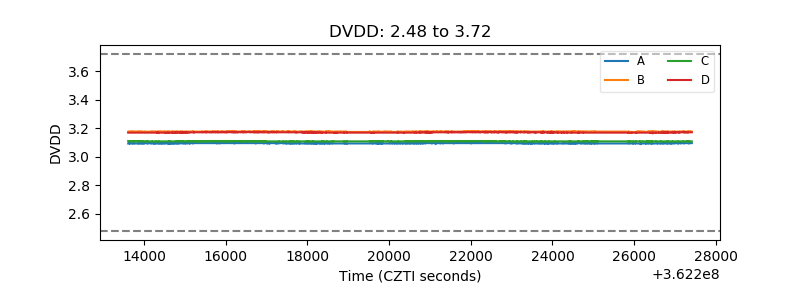 |
| Temperature 1 | 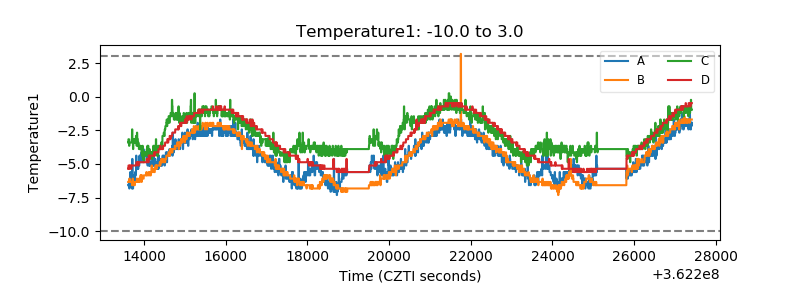 |
| Veto HV Monitor |  |
| Veto LLD | 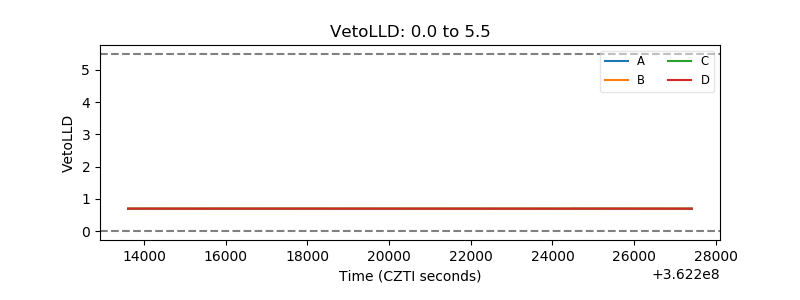 |
| Alpha Counter | 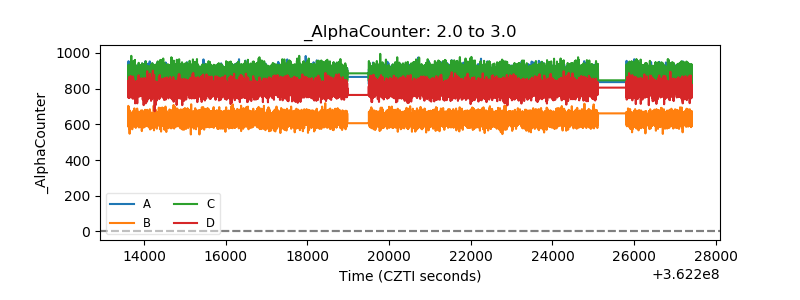 |
| _CPM_Rate | 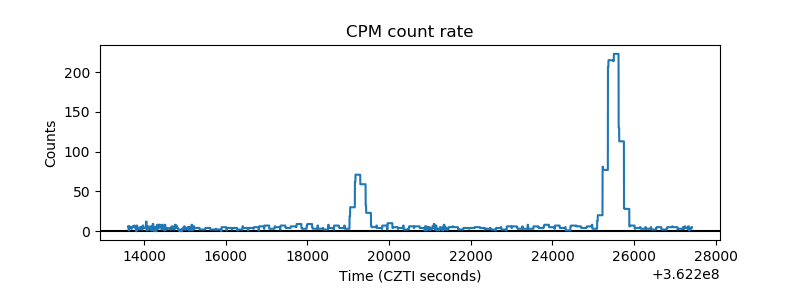 |
| CZT Counter | 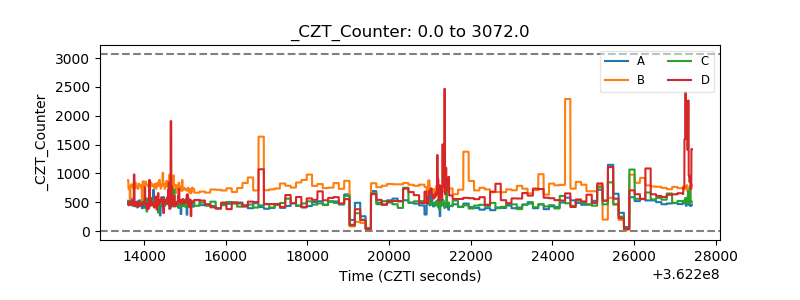 |
| +2.5 Volts monitor |  |
| +5 Volts monitor |  |
| _ROLL_ROT | 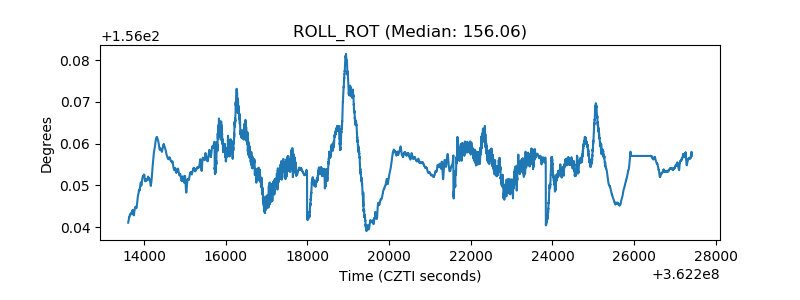 |
| _Roll_DEC | 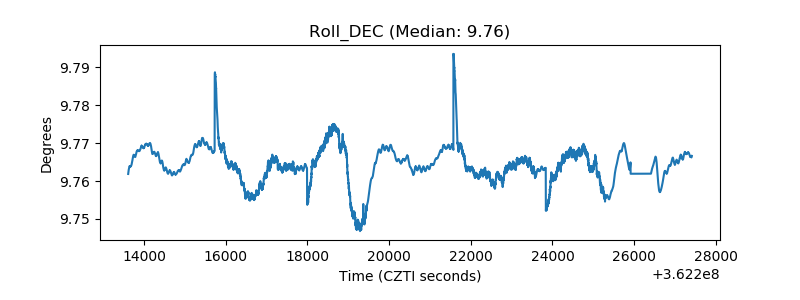 |
| _Roll_RA |  |
| Veto Counter | 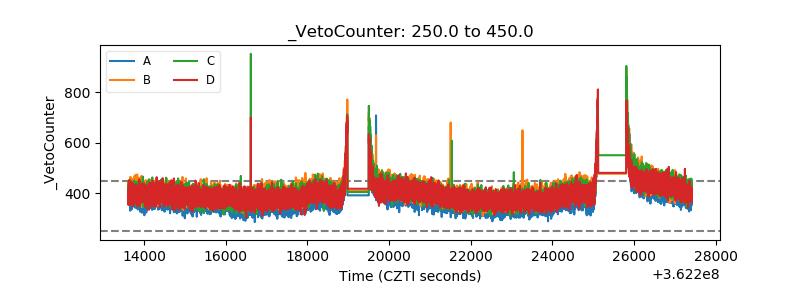 |