| Param | Original file | Final file |
|---|---|---|
| Filename | modeM0/AS1A10_071T54_9000004482_31029cztM0_level2.evt | modeM0/AS1A10_071T54_9000004482_31029cztM0_level2_quad_clean.evt |
| Size (bytes) | 607,262,400 | 68,915,520 |
| Size | 579.1 MB | 65.7 MB |
| Events in quadrant A | 2,495,646 | 458,376 |
| Events in quadrant B | 4,087,206 | 452,955 |
| Events in quadrant C | 2,559,760 | 436,903 |
| Events in quadrant D | 8,887,861 | 364,518 |
| Mode M0 | |||
|---|---|---|---|
| Quadrant | BADHDUFLAG | Total packets | Discarded packets |
| A | 0 | 10817 | 1 |
| B | 0 | 16096 | 1 |
| C | 0 | 10901 | 1 |
| D | 0 | 30184 | 1 |
| Mode M9 | |||
|---|---|---|---|
| Quadrant | BADHDUFLAG | Total packets | Discarded packets |
| A | 0 | 8 | 0 |
| B | 0 | 8 | 0 |
| C | 0 | 8 | 0 |
| D | 0 | 8 | 0 |
| Mode SS | |||
|---|---|---|---|
| Quadrant | BADHDUFLAG | Total packets | Discarded packets |
| A | 0 | 112 | 0 |
| B | 0 | 112 | 0 |
| C | 0 | 112 | 0 |
| D | 0 | 112 | 0 |
| Quadrant | Total seconds | Saturated seconds | Saturation percentage |
|---|---|---|---|
| A | 5316 | 52 | 0.978179% |
| B | 5317 | 92 | 1.730299% |
| C | 5317 | 83 | 1.561031% |
| D | 5317 | 2060 | 38.743652% |
Noise dominated data is calculated using 1-second bins in cleaned event files. If a bin has >2000 counts, and if more than 50% of those come from <1% of pixels, then it is considered to be noise-dominated and hence unusable.
| Quadrant | # 1 sec bins | Bins with >0 counts | Bins with >2000 counts | High rate bins dominated by noise | Noise dominated (total time) | Noise dominated (detector-on time) | Marked lightcurve |
|---|---|---|---|---|---|---|---|
| A | 6211 | 5316 | 0 | 0 | 0.00% | 0.00% | 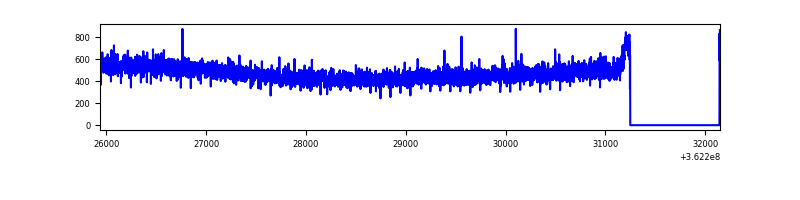 |
| B | 6212 | 5317 | 8 | 8 | 0.13% | 0.15% | 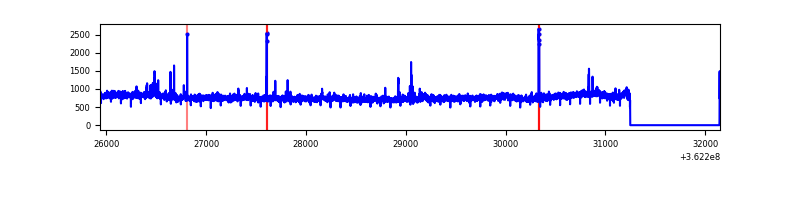 |
| C | 6211 | 5316 | 1 | 1 | 0.02% | 0.02% | 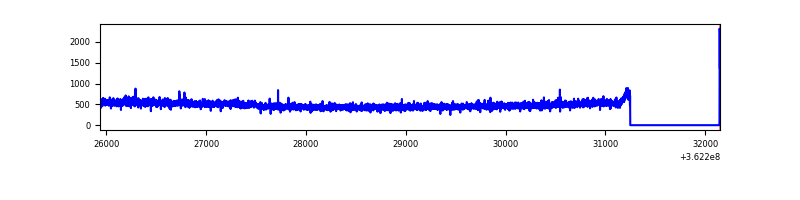 |
| D | 6211 | 5316 | 2296 | 2296 | 36.97% | 43.19% |  |
Top three noisy pixels from each quadrant. If the there are fewer than three noisy pixels in the level2.evt file, extra rows are filled as -1
| Pixel properties | Quadrant properties | ||||||
|---|---|---|---|---|---|---|---|
| Quadrant | DetID | PixID | Counts | Sigma | Mean | Median | Sigma |
| A | 11 | 47 | 11442 | 82.4 | 643 | 631 | 131.2 |
| A | 13 | 254 | 10353 | 74.1 | 643 | 631 | 131.2 |
| A | 3 | 137 | 6568 | 45.25 | 643 | 631 | 131.2 |
| B | 6 | 159 | 1479353 | 12008.67 | 633 | 617 | 123.1 |
| B | 0 | 190 | 48782 | 391.14 | 633 | 617 | 123.1 |
| B | 0 | 230 | 17936 | 140.65 | 633 | 617 | 123.1 |
| C | 14 | 238 | 96992 | 656.95 | 615 | 618 | 146.7 |
| C | 1 | 16 | 14459 | 94.35 | 615 | 618 | 146.7 |
| C | 0 | 10 | 14254 | 92.95 | 615 | 618 | 146.7 |
| D | 12 | 218 | 5971275 | 44377.2 | 561 | 547 | 134.5 |
| D | 8 | 195 | 549771 | 4082.09 | 561 | 547 | 134.5 |
| D | 2 | 250 | 185427 | 1374.11 | 561 | 547 | 134.5 |
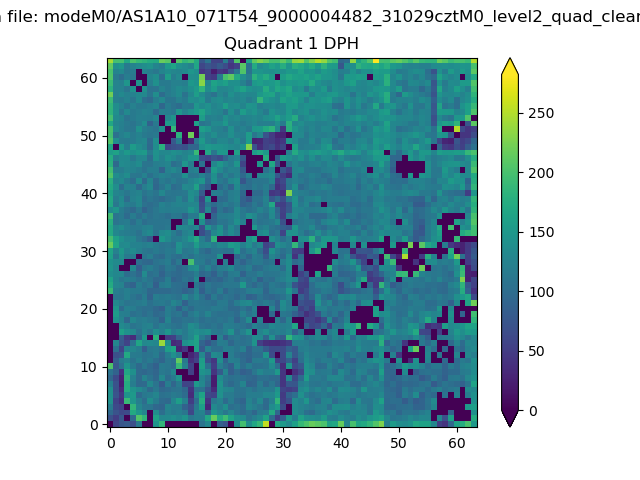
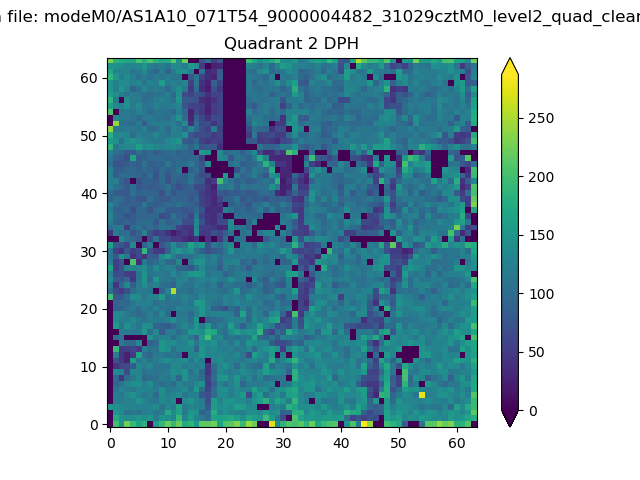
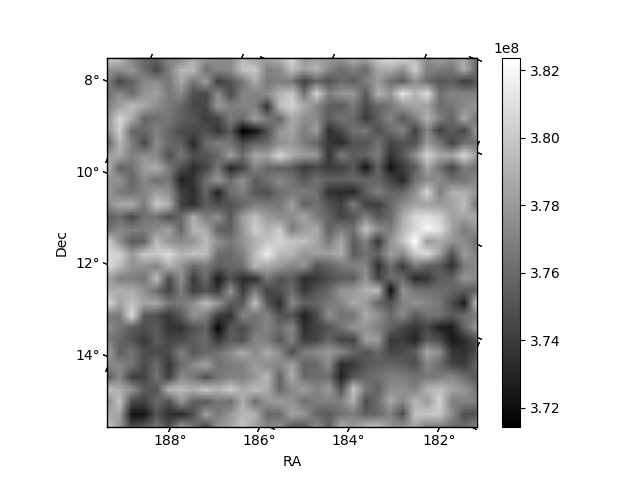
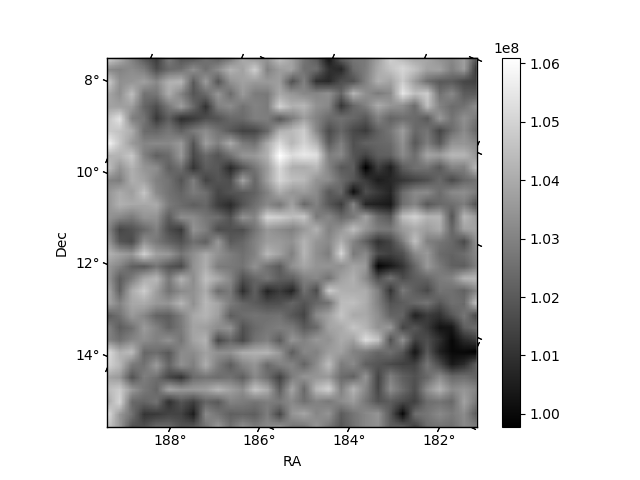
Histogram calculated using DETX and DETY for each event in the final _common_clean file
| Quadrant A | 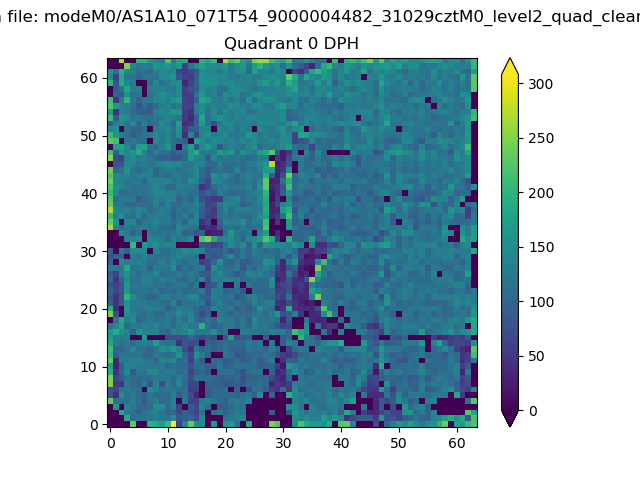 |
 |
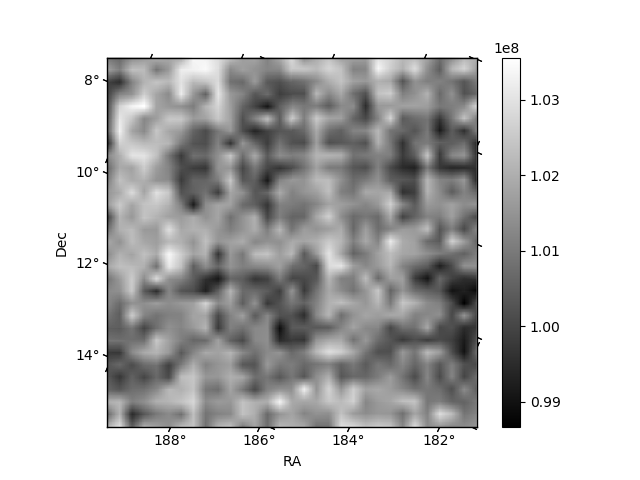
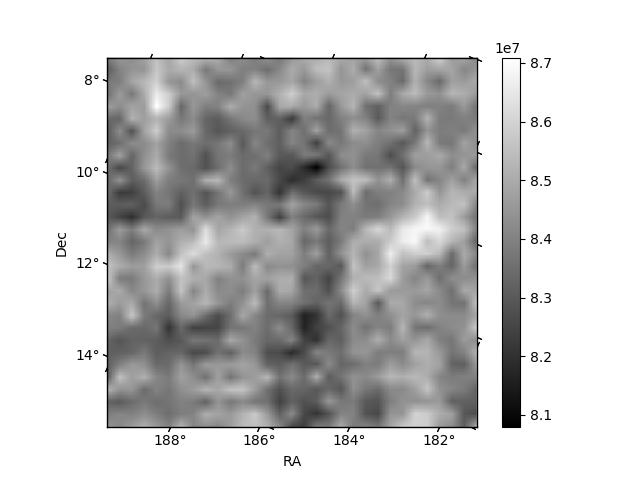
Quadrant B |
|---|---|---|---|
| Quadrant D | 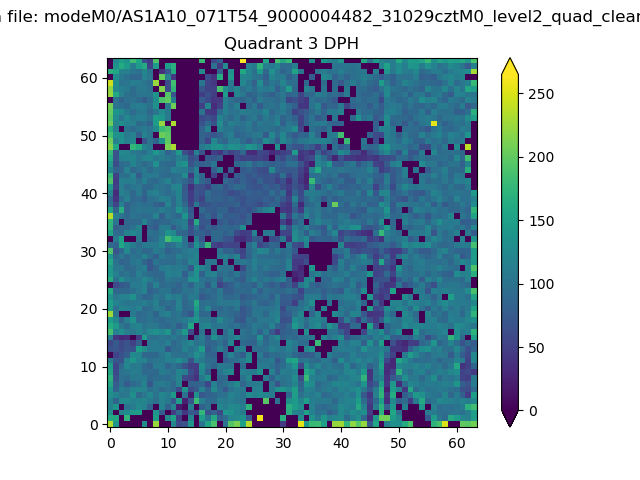 |
 |
Quadrant C |
| Plot type | Count rate plots | Images |
|---|---|---|
| Comparison with Poisson distribution Blue bars denote a histogram of data divided into 1 sec bins. Red curve is a Poisson curve with rate = median count rate of data. |
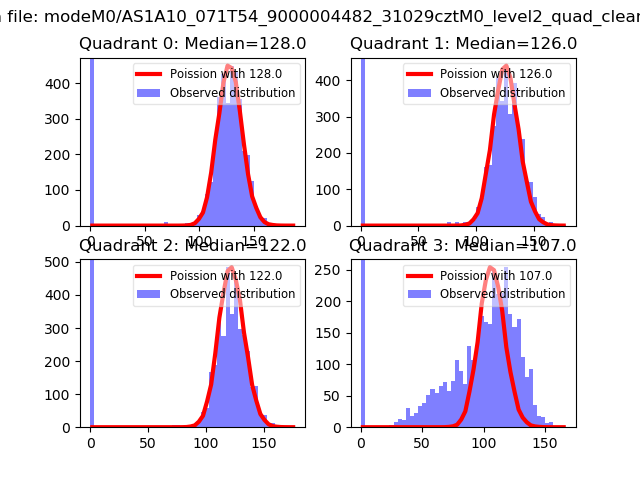 |
 |
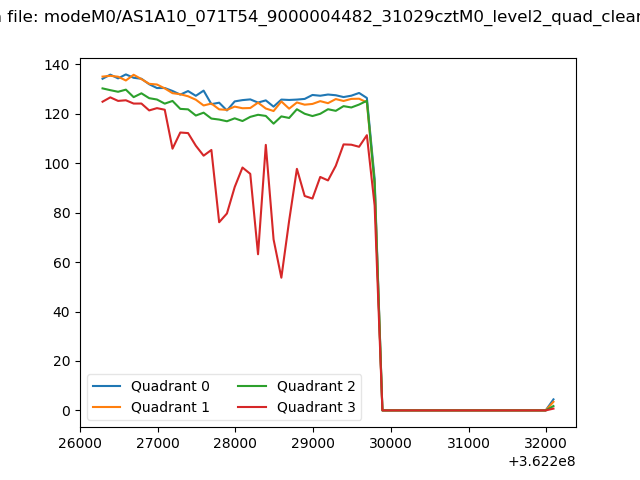
| Quadrant-wise count rates Data is divided into 100 sec bins |
 |
|
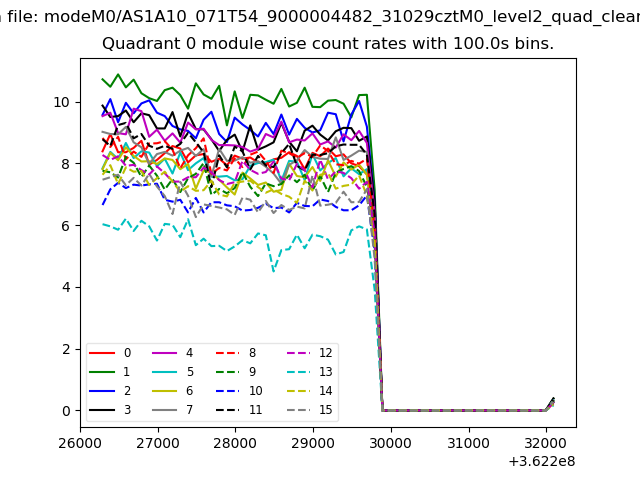
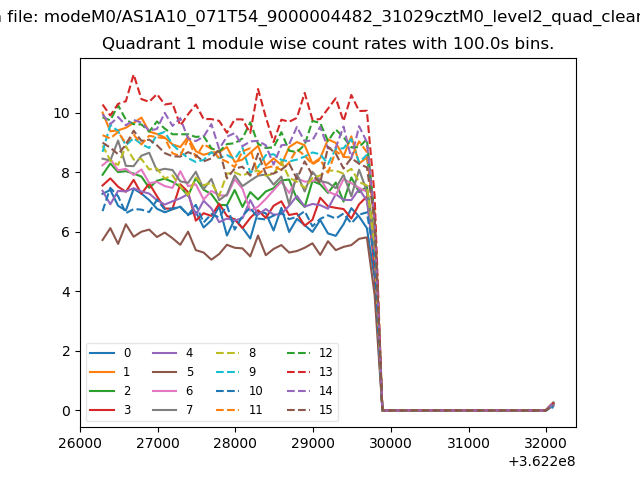
| Module-wise count rates for Quadrant A Data is divided into 100 sec bins |
 |
 |
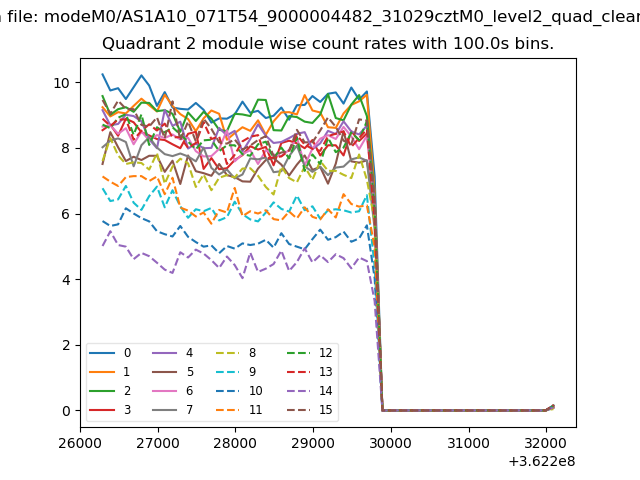
| Module-wise count rates for Quadrant B Data is divided into 100 sec bins |
 |
 |
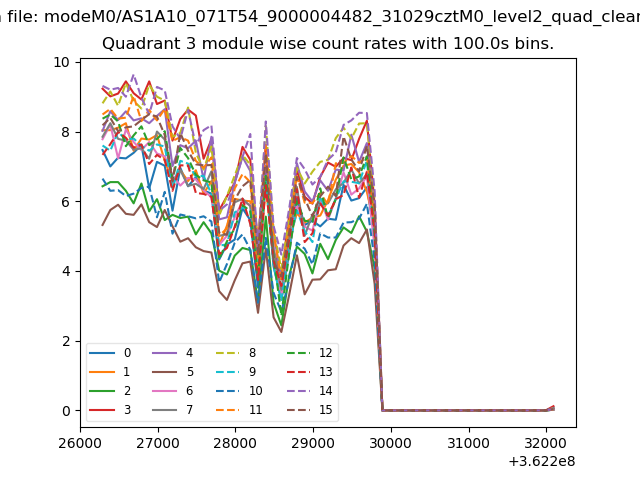
| Module-wise count rates for Quadrant C Data is divided into 100 sec bins |
 |
 |
| Module-wise count rates for Quadrant D Data is divided into 100 sec bins |
 |
 |
| Parameter | Plot |
|---|---|
| CZT HV Monitor |  |
| D_VDD |  |
| Temperature 1 | 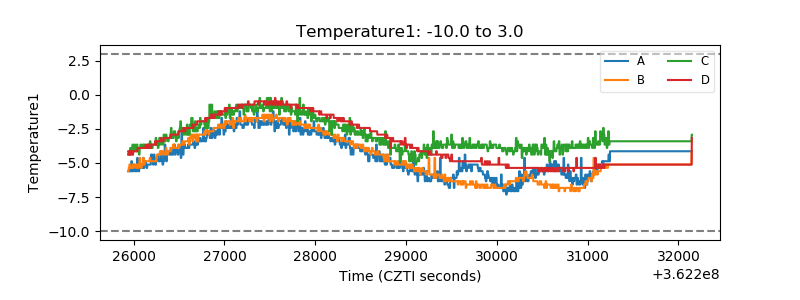 |
| Veto HV Monitor | 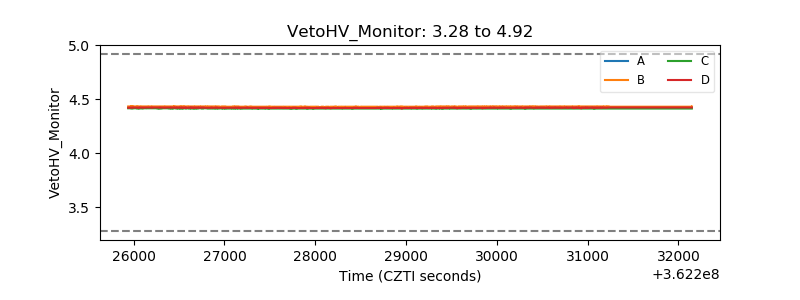 |
| Veto LLD | 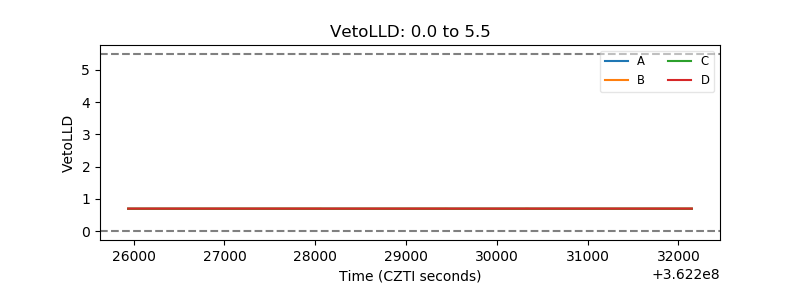 |
| Alpha Counter | 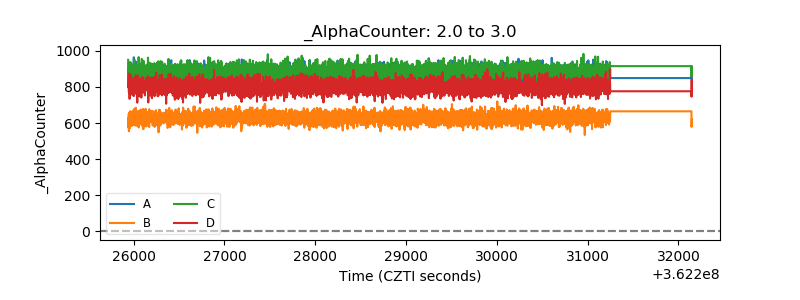 |
| _CPM_Rate | 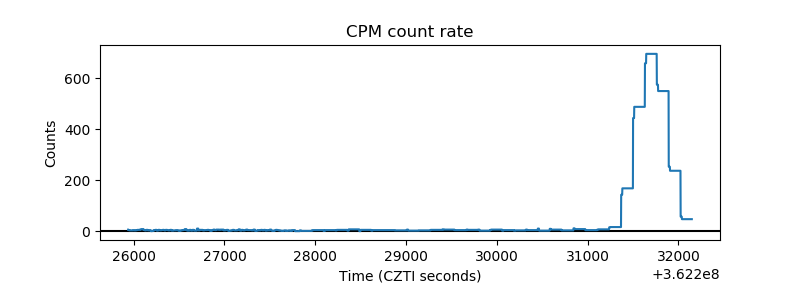 |
| CZT Counter | 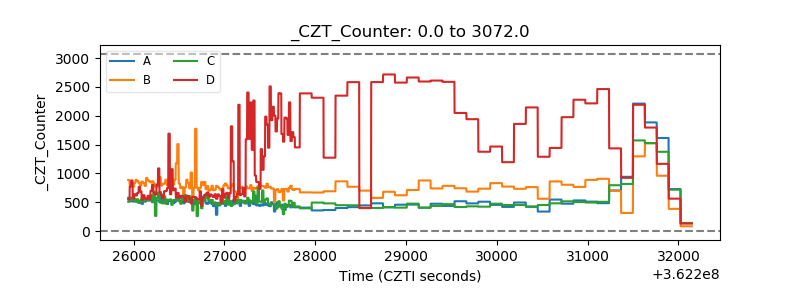 |
| +2.5 Volts monitor |  |
| +5 Volts monitor |  |
| _ROLL_ROT | 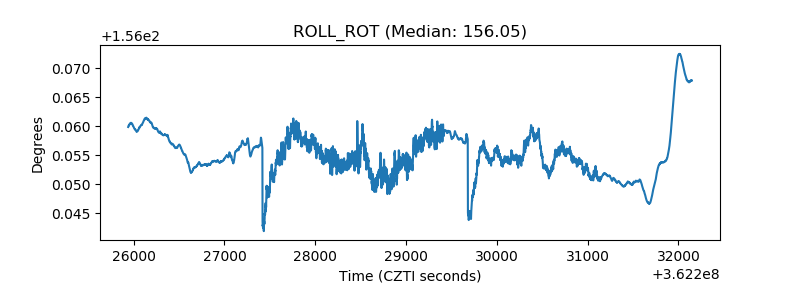 |
| _Roll_DEC | 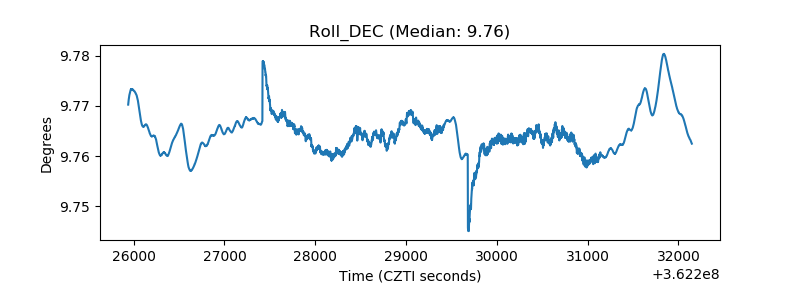 |
| _Roll_RA | 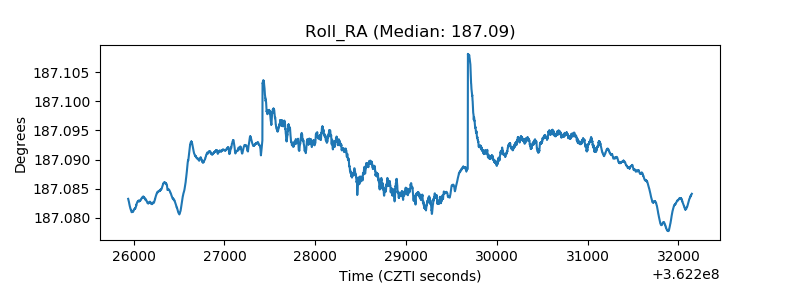 |
| Veto Counter | 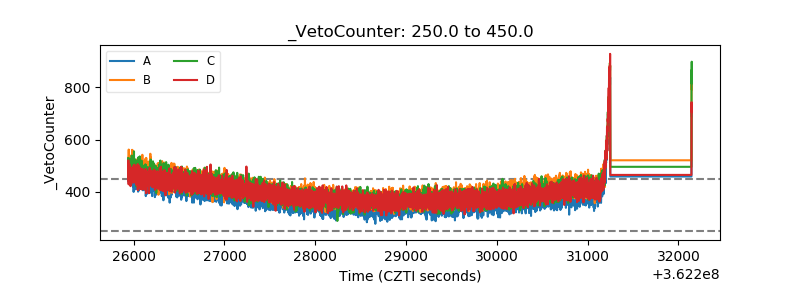 |