| Param | Original file | Final file |
|---|---|---|
| Filename | modeM0/AS1A10_071T56_9000004484cztM0_level2.fits | modeM0/AS1A10_071T56_9000004484cztM0_level2_quad_clean.evt |
| Size (bytes) | 345,006,720 | 129,856,320 |
| Size | 329.0 MB | 123.8 MB |
| Events in quadrant A | 2,227,884 | 474,667 |
| Events in quadrant B | 2,076,288 | 462,617 |
| Events in quadrant C | 2,129,238 | 443,523 |
| Events in quadrant D | 1,741,276 | 276,476 |
| Mode M0 | |||
|---|---|---|---|
| Quadrant | BADHDUFLAG | Total packets | Discarded packets |
| A | 0 | 71268 | 0 |
| B | 0 | 104206 | 0 |
| C | 0 | 72261 | 0 |
| D | 0 | 121896 | 0 |
| Mode SS | |||
|---|---|---|---|
| Quadrant | BADHDUFLAG | Total packets | Discarded packets |
| A | 0 | 674 | 0 |
| B | 0 | 674 | 0 |
| C | 0 | 674 | 0 |
| D | 0 | 674 | 0 |
| Mode M9 | |||
|---|---|---|---|
| Quadrant | BADHDUFLAG | Total packets | Discarded packets |
| A | 0 | 75 | 0 |
| B | 0 | 75 | 0 |
| C | 0 | 75 | 0 |
| D | 0 | 75 | 0 |
| Quadrant | Total seconds | Saturated seconds | Saturation percentage |
|---|---|---|---|
| A | 33066 | 331 | 1.001028% |
| B | 33066 | 875 | 2.646223% |
| C | 33066 | 770 | 2.328676% |
| D | 33066 | 4800 | 14.516422% |
Noise dominated data is calculated using 1-second bins in cleaned event files. If a bin has >2000 counts, and if more than 50% of those come from <1% of pixels, then it is considered to be noise-dominated and hence unusable.
| Quadrant | # 1 sec bins | Bins with >0 counts | Bins with >2000 counts | High rate bins dominated by noise | Noise dominated (total time) | Noise dominated (detector-on time) | Marked lightcurve |
|---|---|---|---|---|---|---|---|
| A | 40596 | 33060 | 0 | 0 | 0.00% | 0.00% |  |
| B | 40596 | 33054 | 0 | 0 | 0.00% | 0.00% |  |
| C | 40596 | 33059 | 0 | 0 | 0.00% | 0.00% | 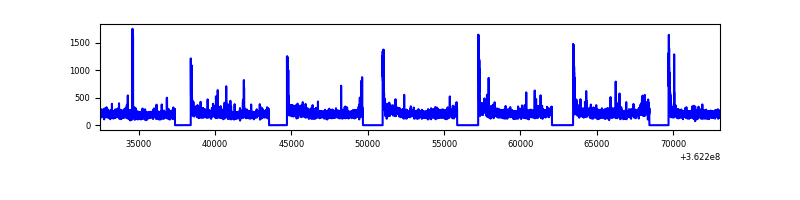 |
| D | 40595 | 33055 | 0 | 0 | 0.00% | 0.00% | 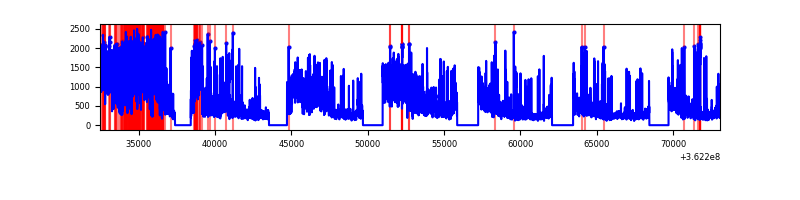 |
Top three noisy pixels from each quadrant. If the there are fewer than three noisy pixels in the level2.evt file, extra rows are filled as -1
| Pixel properties | Quadrant properties | ||||||
|---|---|---|---|---|---|---|---|
| Quadrant | DetID | PixID | Counts | Sigma | Mean | Median | Sigma |
| A | 0 | 29 | 1851 | 9.13 | 580 | 548 | 142.6 |
| A | 7 | 110 | 1758 | 8.48 | 580 | 548 | 142.6 |
| A | 0 | 30 | 1643 | 7.68 | 580 | 548 | 142.6 |
| B | 2 | 9 | 1628 | 10.0 | 550 | 528 | 110.0 |
| B | 5 | 128 | 1397 | 7.9 | 550 | 528 | 110.0 |
| B | 2 | 8 | 1357 | 7.53 | 550 | 528 | 110.0 |
| C | 1 | 81 | 1731 | 8.39 | 562 | 529 | 143.3 |
| C | 1 | 80 | 1613 | 7.57 | 562 | 529 | 143.3 |
| C | 3 | 202 | 1603 | 7.5 | 562 | 529 | 143.3 |
| D | 15 | 46 | 1297 | 6.29 | 497 | 453 | 134.1 |
| D | 7 | 3 | 1253 | 5.96 | 497 | 453 | 134.1 |
| D | 3 | 14 | 1235 | 5.83 | 497 | 453 | 134.1 |
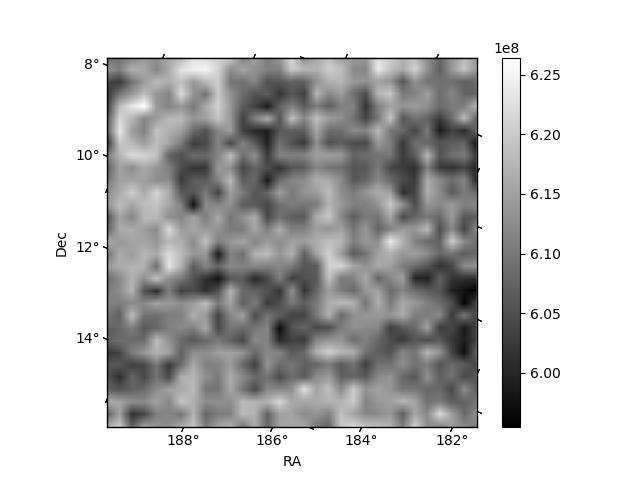
Histogram calculated using DETX and DETY for each event in the final _common_clean file
| Quadrant A | 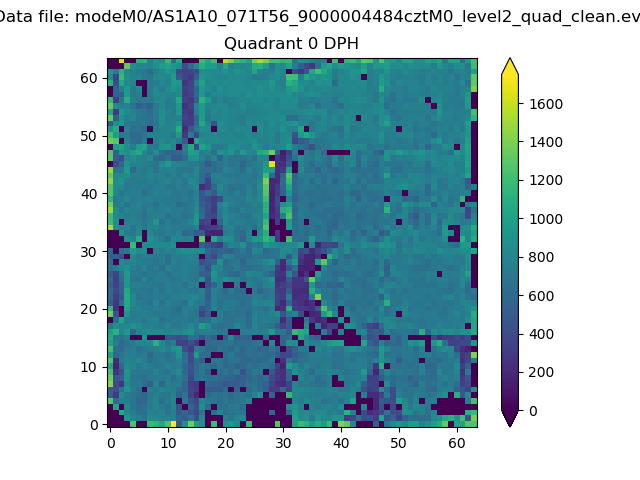 |
 |
Quadrant B |
|---|---|---|---|
| Quadrant D |  |
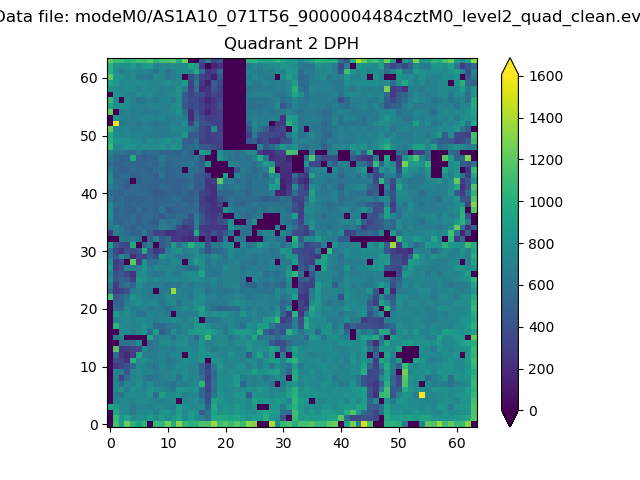 |
Quadrant C |
| Plot type | Count rate plots | Images |
|---|---|---|
| Comparison with Poisson distribution Blue bars denote a histogram of data divided into 1 sec bins. Red curve is a Poisson curve with rate = median count rate of data. |
 |
 |
| Quadrant-wise count rates Data is divided into 100 sec bins |
 |
|
| Module-wise count rates for Quadrant A Data is divided into 100 sec bins |
 |
 |
| Module-wise count rates for Quadrant B Data is divided into 100 sec bins |
 |
 |
| Module-wise count rates for Quadrant C Data is divided into 100 sec bins |
 |
 |
| Module-wise count rates for Quadrant D Data is divided into 100 sec bins |
 |
 |
| Parameter | Plot |
|---|---|
| CZT HV Monitor |  |
| D_VDD |  |
| Temperature 1 | 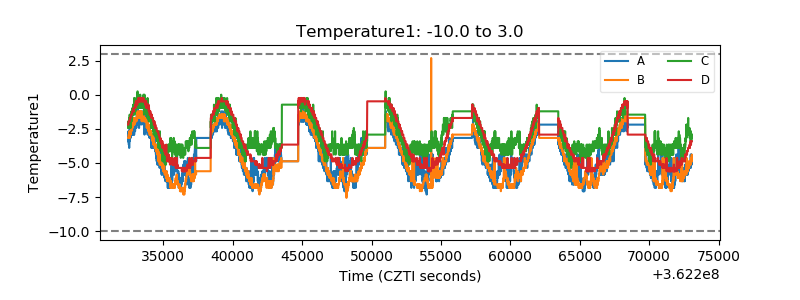 |
| Veto HV Monitor | 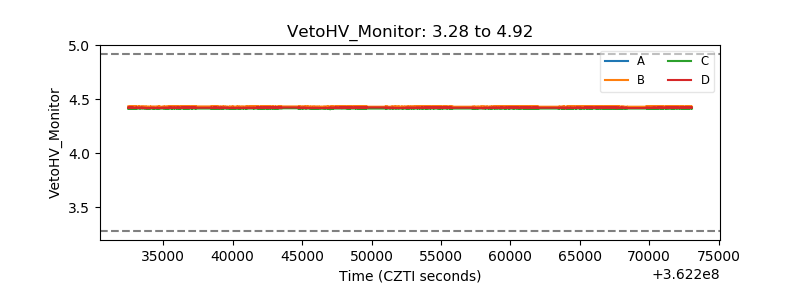 |
| Veto LLD | 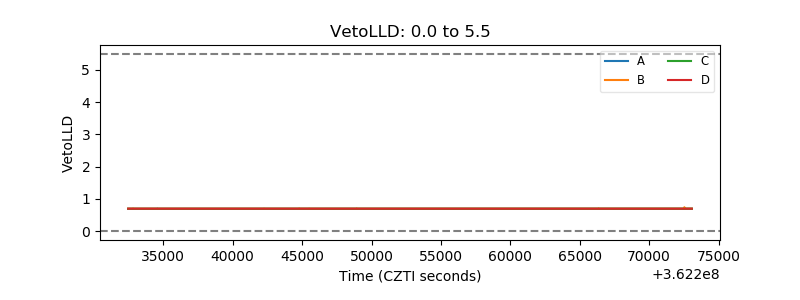 |
| Alpha Counter |  |
| _CPM_Rate |  |
| CZT Counter |  |
| +2.5 Volts monitor |  |
| +5 Volts monitor |  |
| _ROLL_ROT |  |
| _Roll_DEC |  |
| _Roll_RA |  |
| Veto Counter |  |