| Param | Original file | Final file |
|---|---|---|
| Filename | modeM0/AS1A10_071T56_9000004484_31029cztM0_level2.evt | modeM0/AS1A10_071T56_9000004484_31029cztM0_level2_quad_clean.evt |
| Size (bytes) | 160,894,080 | 20,992,320 |
| Size | 153.4 MB | 20.0 MB |
| Events in quadrant A | 594,545 | 159,787 |
| Events in quadrant B | 968,515 | 157,874 |
| Events in quadrant C | 603,198 | 151,043 |
| Events in quadrant D | 2,627,230 | 80,401 |
| Mode M0 | |||
|---|---|---|---|
| Quadrant | BADHDUFLAG | Total packets | Discarded packets |
| A | 0 | 2373 | 0 |
| B | 0 | 3593 | 0 |
| C | 0 | 2411 | 0 |
| D | 0 | 8569 | 1 |
| Mode SS | |||
|---|---|---|---|
| Quadrant | BADHDUFLAG | Total packets | Discarded packets |
| A | 0 | 22 | 0 |
| B | 0 | 22 | 0 |
| C | 0 | 22 | 0 |
| D | 0 | 22 | 0 |
| Quadrant | Total seconds | Saturated seconds | Saturation percentage |
|---|---|---|---|
| A | 1129 | 6 | 0.531444% |
| B | 1129 | 10 | 0.885740% |
| C | 1129 | 9 | 0.797166% |
| D | 1128 | 1041 | 92.287234% |
Noise dominated data is calculated using 1-second bins in cleaned event files. If a bin has >2000 counts, and if more than 50% of those come from <1% of pixels, then it is considered to be noise-dominated and hence unusable.
| Quadrant | # 1 sec bins | Bins with >0 counts | Bins with >2000 counts | High rate bins dominated by noise | Noise dominated (total time) | Noise dominated (detector-on time) | Marked lightcurve |
|---|---|---|---|---|---|---|---|
| A | 1129 | 1129 | 0 | 0 | 0.00% | 0.00% | 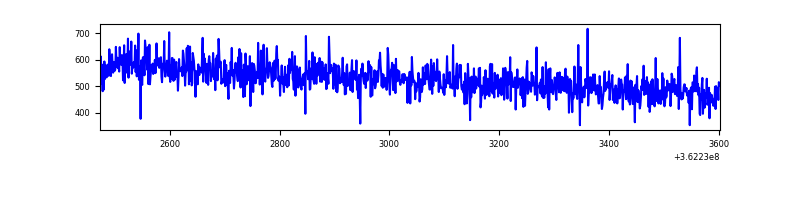 |
| B | 1129 | 1129 | 3 | 3 | 0.27% | 0.27% | 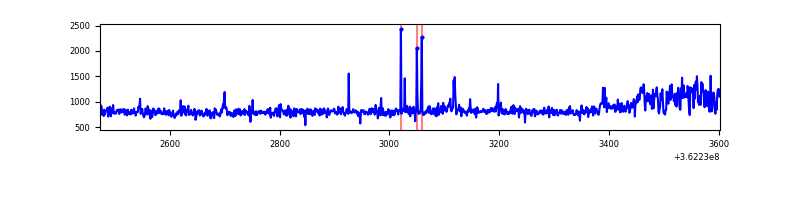 |
| C | 1129 | 1129 | 0 | 0 | 0.00% | 0.00% | 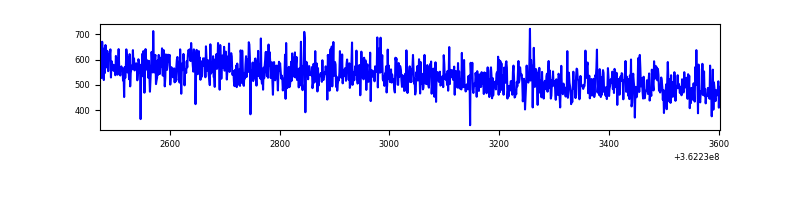 |
| D | 1127 | 1127 | 979 | 979 | 86.87% | 86.87% | 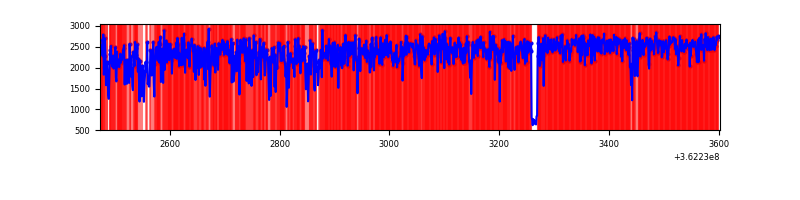 |
Top three noisy pixels from each quadrant. If the there are fewer than three noisy pixels in the level2.evt file, extra rows are filled as -1
| Pixel properties | Quadrant properties | ||||||
|---|---|---|---|---|---|---|---|
| Quadrant | DetID | PixID | Counts | Sigma | Mean | Median | Sigma |
| A | 13 | 254 | 2341 | 66.65 | 153 | 149 | 32.9 |
| A | 3 | 137 | 1599 | 44.09 | 153 | 149 | 32.9 |
| A | 0 | 226 | 1351 | 36.55 | 153 | 149 | 32.9 |
| B | 6 | 159 | 292406 | 9546.1 | 148 | 145 | 30.6 |
| B | 0 | 155 | 48842 | 1590.59 | 148 | 145 | 30.6 |
| B | 0 | 183 | 12418 | 400.87 | 148 | 145 | 30.6 |
| C | 14 | 238 | 23614 | 652.54 | 144 | 145 | 36.0 |
| C | 3 | 233 | 6394 | 173.75 | 144 | 145 | 36.0 |
| C | 1 | 16 | 5135 | 138.74 | 144 | 145 | 36.0 |
| D | 12 | 218 | 2148462 | 88630.12 | 90 | 87 | 24.2 |
| D | 8 | 195 | 106642 | 4395.87 | 90 | 87 | 24.2 |
| D | 2 | 250 | 15543 | 637.63 | 90 | 87 | 24.2 |
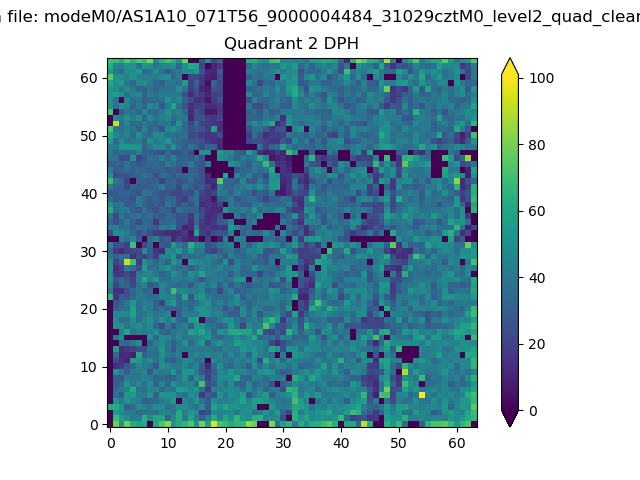
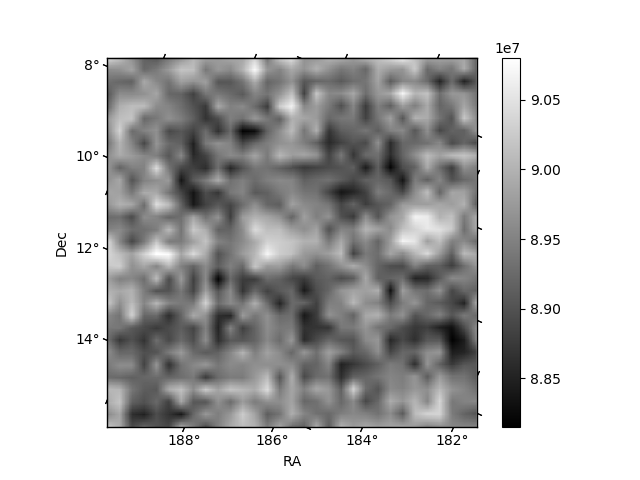
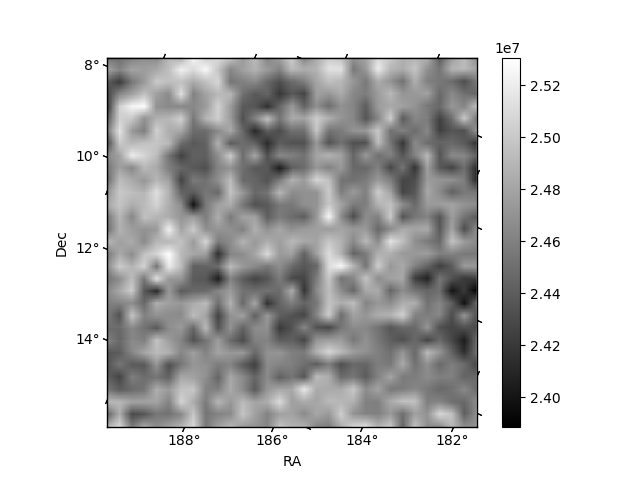
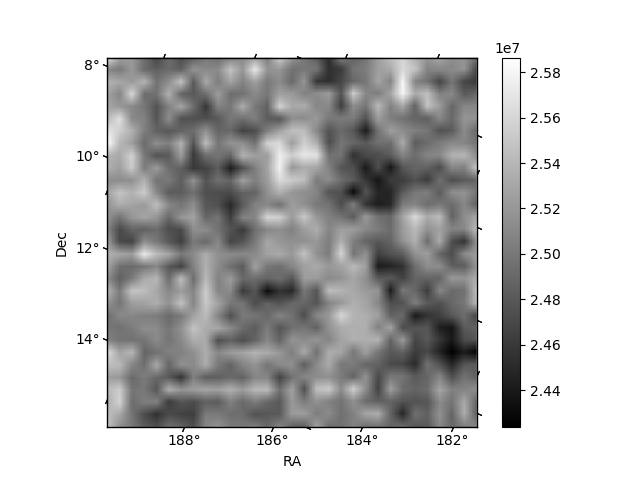
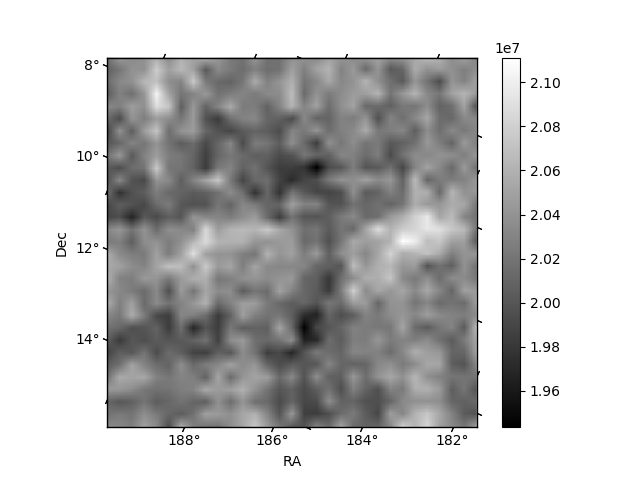
Histogram calculated using DETX and DETY for each event in the final _common_clean file
| Quadrant A | 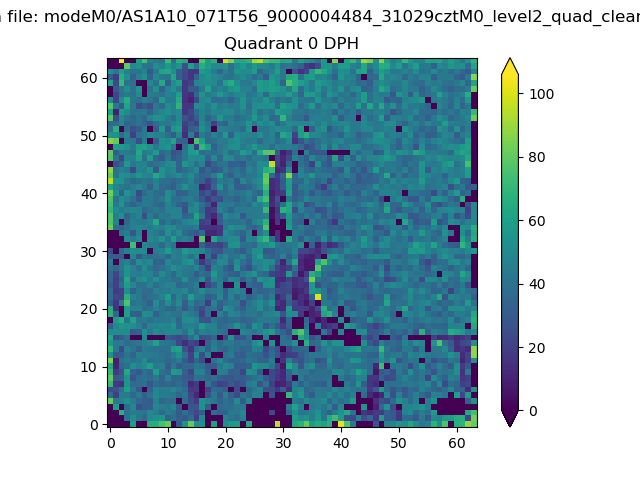 |
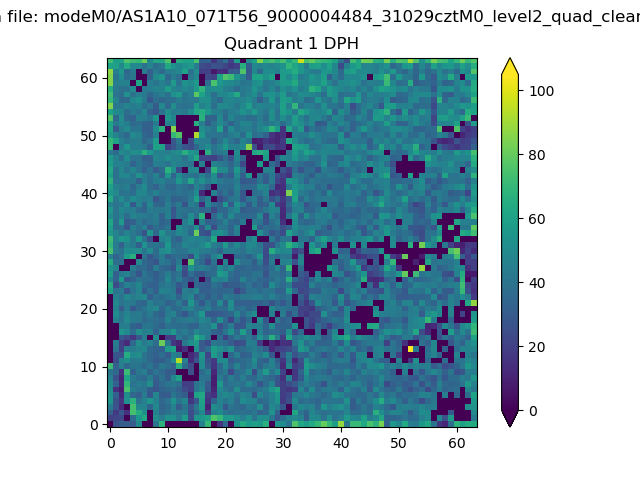 |
Quadrant B |
|---|---|---|---|
| Quadrant D | 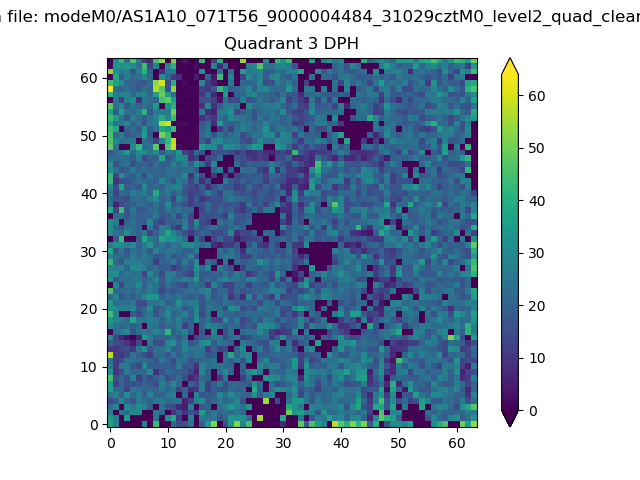 |
 |
Quadrant C |
| Plot type | Count rate plots | Images |
|---|---|---|
| Comparison with Poisson distribution Blue bars denote a histogram of data divided into 1 sec bins. Red curve is a Poisson curve with rate = median count rate of data. |
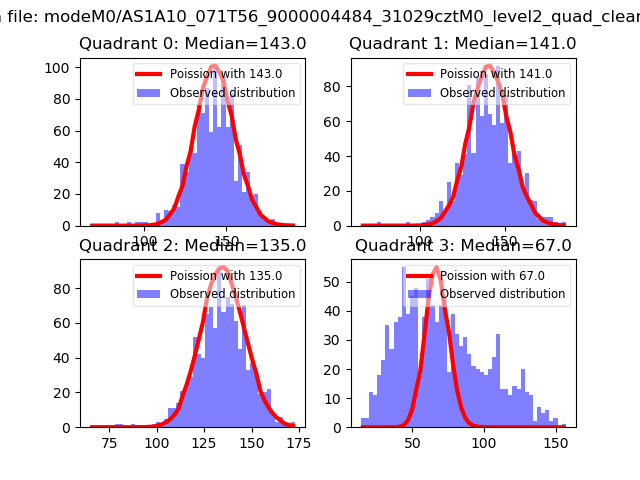 |
 |
| Quadrant-wise count rates Data is divided into 100 sec bins |
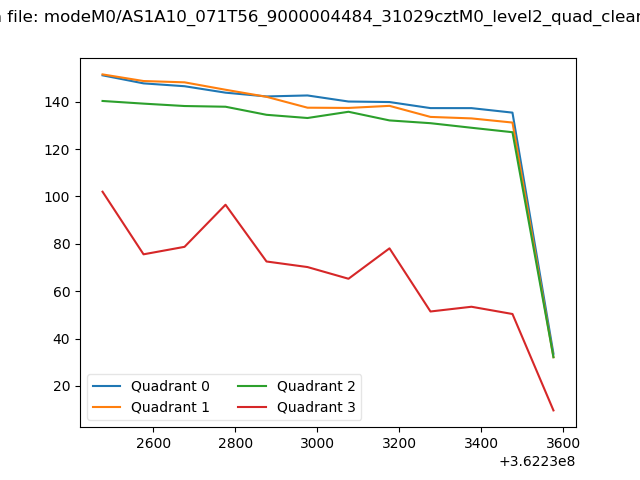 |
|
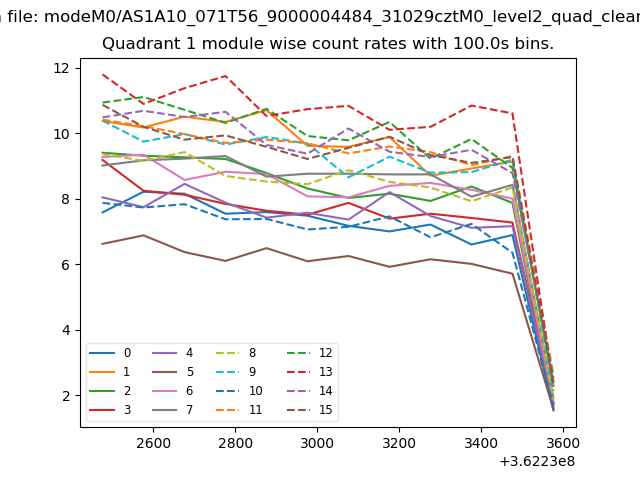
| Module-wise count rates for Quadrant A Data is divided into 100 sec bins |
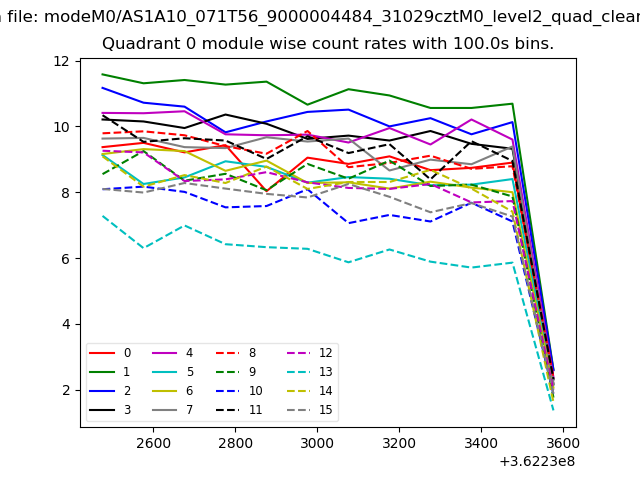 |
 |
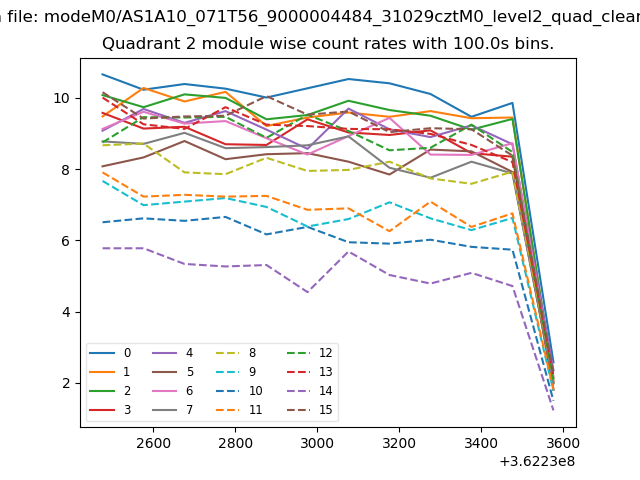
| Module-wise count rates for Quadrant B Data is divided into 100 sec bins |
 |
 |
| Module-wise count rates for Quadrant C Data is divided into 100 sec bins |
 |
 |
| Module-wise count rates for Quadrant D Data is divided into 100 sec bins |
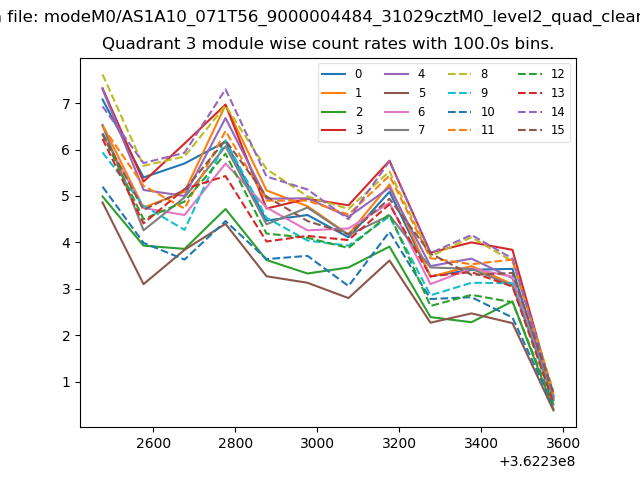 |
 |
| Parameter | Plot |
|---|---|
| CZT HV Monitor | 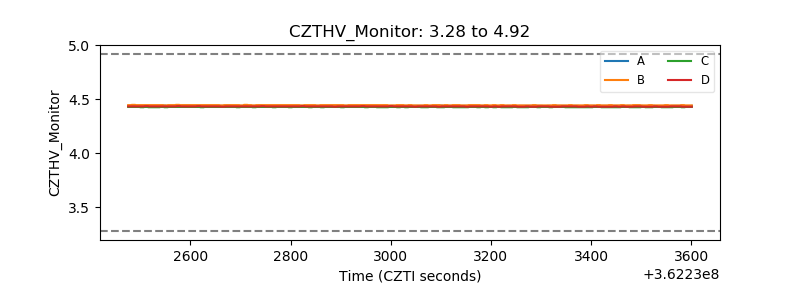 |
| D_VDD | 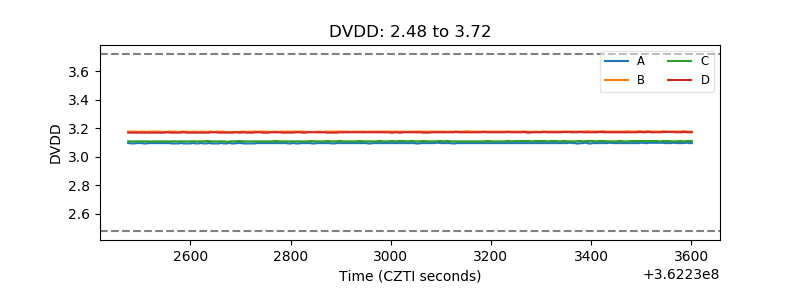 |
| Temperature 1 | 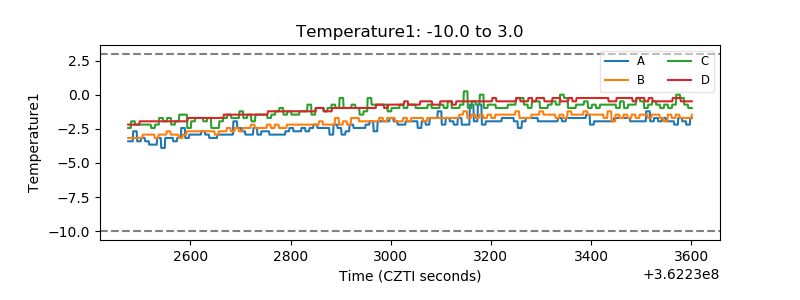 |
| Veto HV Monitor | 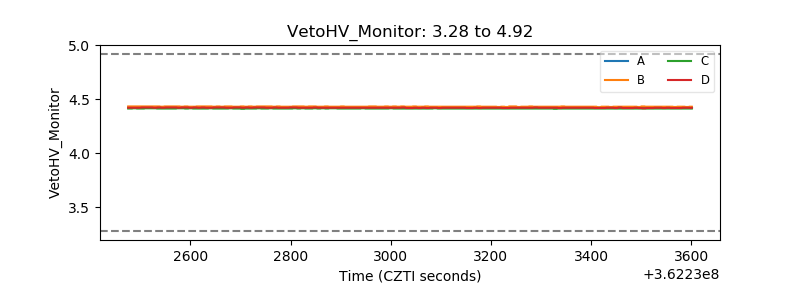 |
| Veto LLD | 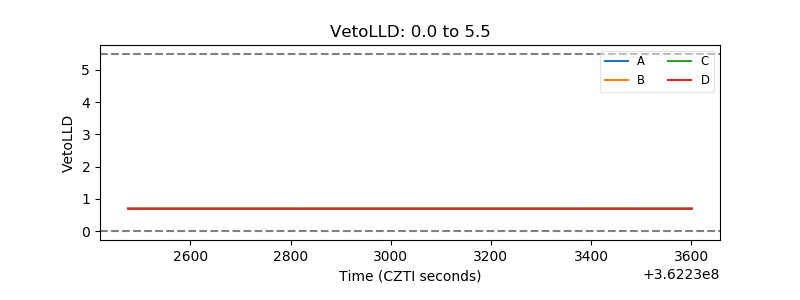 |
| Alpha Counter | 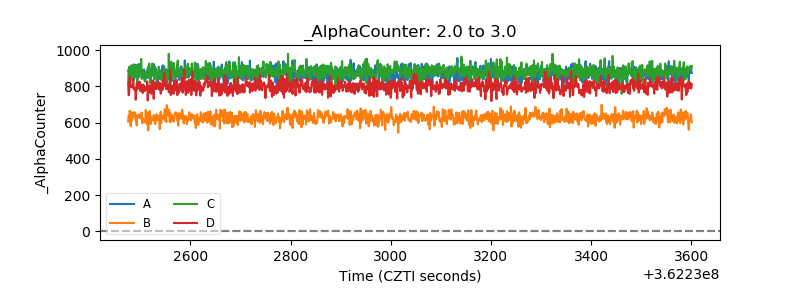 |
| _CPM_Rate | 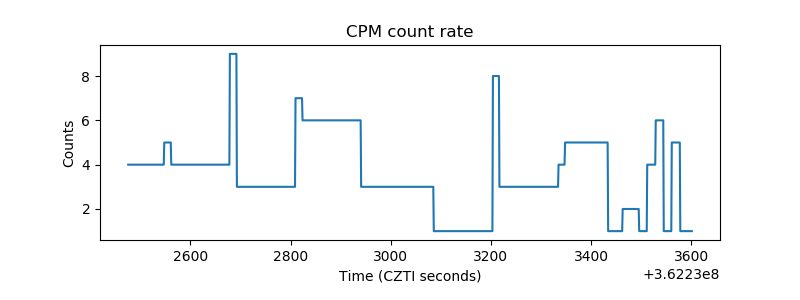 |
| CZT Counter | 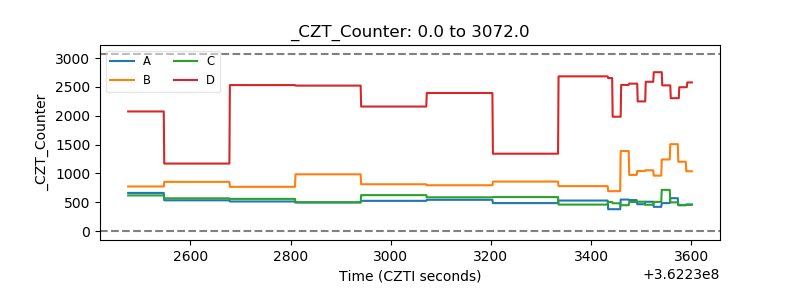 |
| +2.5 Volts monitor |  |
| +5 Volts monitor |  |
| _ROLL_ROT | 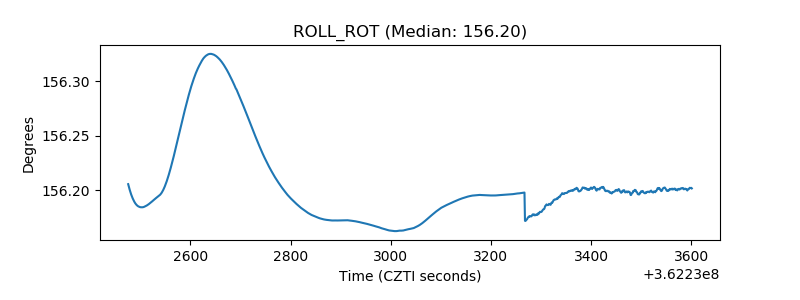 |
| _Roll_DEC | 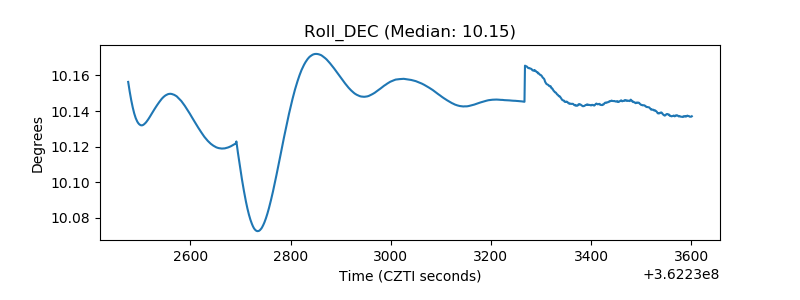 |
| _Roll_RA | 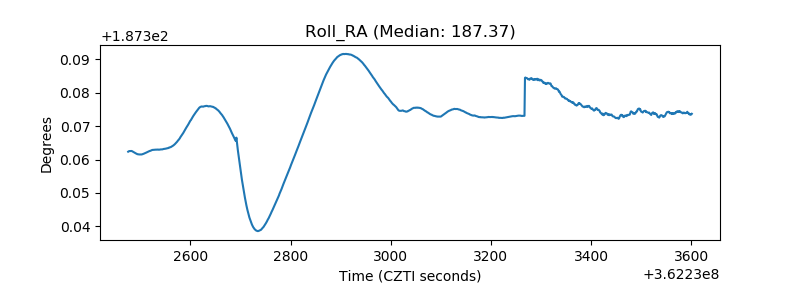 |
| Veto Counter | 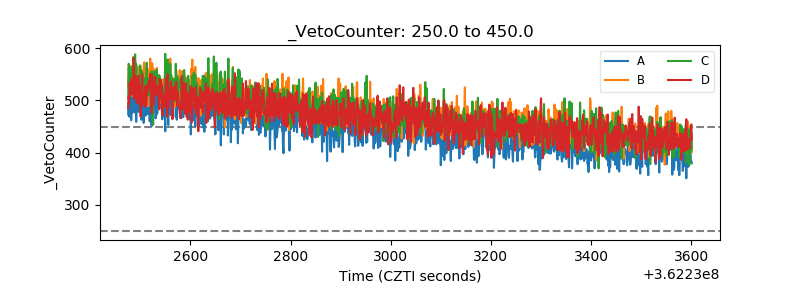 |