| Param | Original file | Final file |
|---|---|---|
| Filename | modeM0/AS1A10_071T56_9000004484_31030cztM0_level2.evt | modeM0/AS1A10_071T56_9000004484_31030cztM0_level2_quad_clean.evt |
| Size (bytes) | 755,395,200 | 83,502,720 |
| Size | 720.4 MB | 79.6 MB |
| Events in quadrant A | 2,932,138 | 602,624 |
| Events in quadrant B | 4,898,676 | 592,987 |
| Events in quadrant C | 3,055,500 | 570,304 |
| Events in quadrant D | 11,587,859 | 344,431 |
| Mode M0 | |||
|---|---|---|---|
| Quadrant | BADHDUFLAG | Total packets | Discarded packets |
| A | 0 | 12576 | 1 |
| B | 0 | 18716 | 1 |
| C | 0 | 12876 | 2 |
| D | 0 | 38533 | 1 |
| Mode SS | |||
|---|---|---|---|
| Quadrant | BADHDUFLAG | Total packets | Discarded packets |
| A | 0 | 122 | 0 |
| B | 0 | 122 | 0 |
| C | 0 | 122 | 0 |
| D | 0 | 122 | 0 |
| Mode M9 | |||
|---|---|---|---|
| Quadrant | BADHDUFLAG | Total packets | Discarded packets |
| A | 0 | 10 | 0 |
| B | 0 | 10 | 0 |
| C | 0 | 10 | 0 |
| D | 0 | 10 | 0 |
| Quadrant | Total seconds | Saturated seconds | Saturation percentage |
|---|---|---|---|
| A | 5964 | 67 | 1.123407% |
| B | 5965 | 116 | 1.944677% |
| C | 5964 | 134 | 2.246814% |
| D | 5964 | 3570 | 59.859155% |
Noise dominated data is calculated using 1-second bins in cleaned event files. If a bin has >2000 counts, and if more than 50% of those come from <1% of pixels, then it is considered to be noise-dominated and hence unusable.
| Quadrant | # 1 sec bins | Bins with >0 counts | Bins with >2000 counts | High rate bins dominated by noise | Noise dominated (total time) | Noise dominated (detector-on time) | Marked lightcurve |
|---|---|---|---|---|---|---|---|
| A | 6999 | 5964 | 0 | 0 | 0.00% | 0.00% | 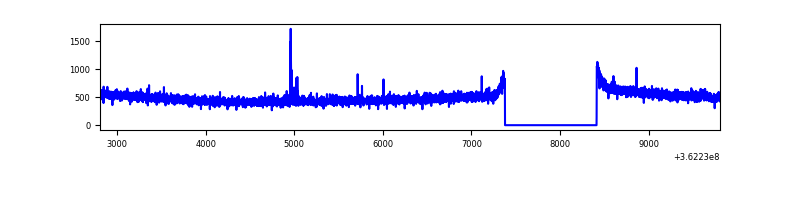 |
| B | 7000 | 5965 | 9 | 9 | 0.13% | 0.15% | 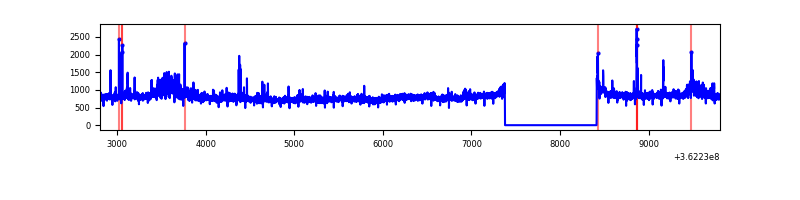 |
| C | 6999 | 5964 | 4 | 4 | 0.06% | 0.07% | 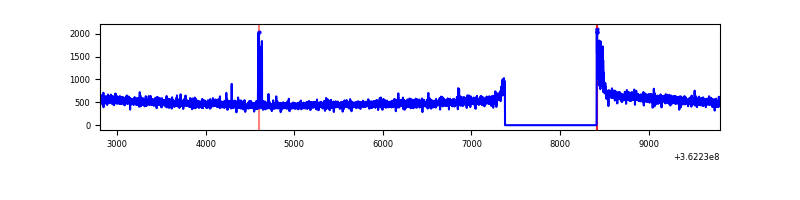 |
| D | 6999 | 5964 | 3727 | 3727 | 53.25% | 62.49% | 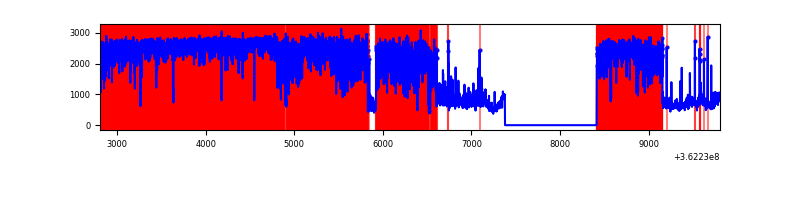 |
Top three noisy pixels from each quadrant. If the there are fewer than three noisy pixels in the level2.evt file, extra rows are filled as -1
| Pixel properties | Quadrant properties | ||||||
|---|---|---|---|---|---|---|---|
| Quadrant | DetID | PixID | Counts | Sigma | Mean | Median | Sigma |
| A | 15 | 192 | 13942 | 86.29 | 755 | 740 | 153.0 |
| A | 13 | 254 | 12733 | 78.39 | 755 | 740 | 153.0 |
| A | 3 | 137 | 7458 | 43.91 | 755 | 740 | 153.0 |
| B | 6 | 159 | 1686887 | 11855.24 | 739 | 721 | 142.2 |
| B | 0 | 155 | 156824 | 1097.54 | 739 | 721 | 142.2 |
| B | 4 | 171 | 34376 | 236.62 | 739 | 721 | 142.2 |
| C | 14 | 238 | 116059 | 676.79 | 717 | 721 | 170.4 |
| C | 0 | 10 | 76381 | 443.97 | 717 | 721 | 170.4 |
| C | 3 | 233 | 29140 | 166.76 | 717 | 721 | 170.4 |
| D | 12 | 218 | 8836876 | 67752.16 | 543 | 528 | 130.4 |
| D | 8 | 195 | 376394 | 2881.93 | 543 | 528 | 130.4 |
| D | 13 | 174 | 113182 | 863.76 | 543 | 528 | 130.4 |
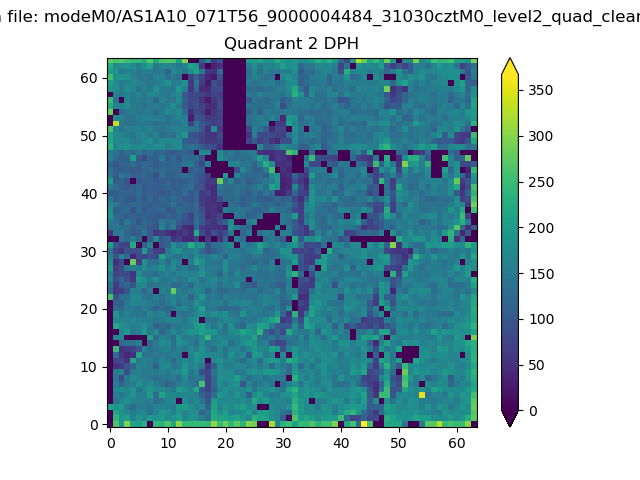
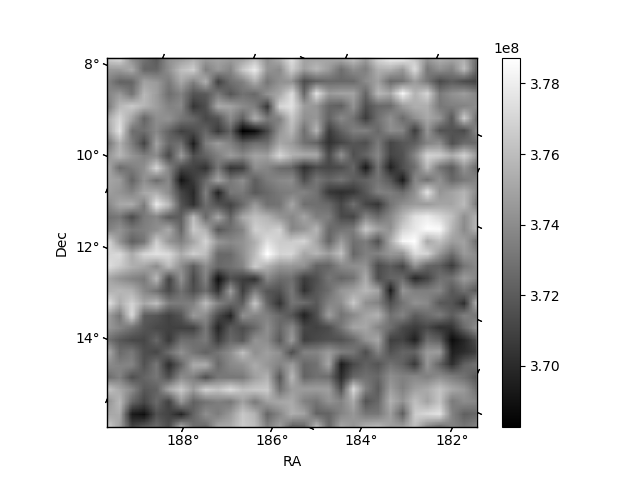
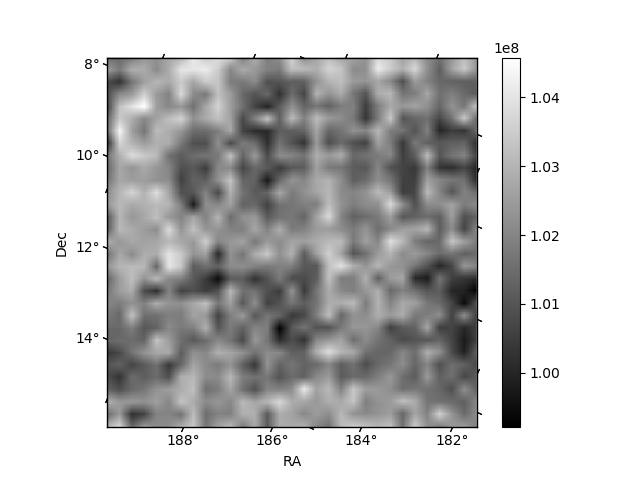
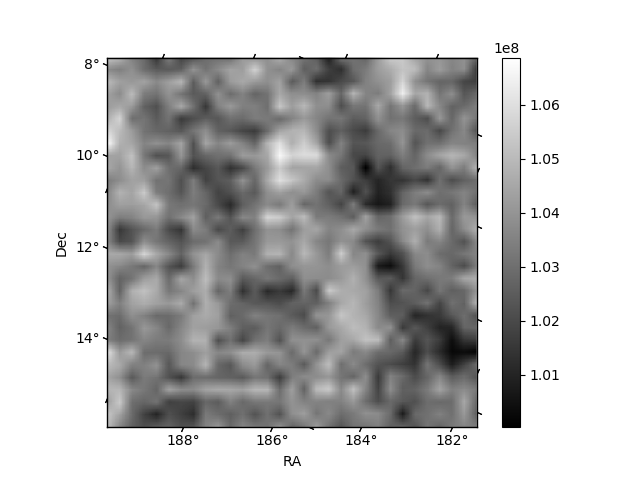
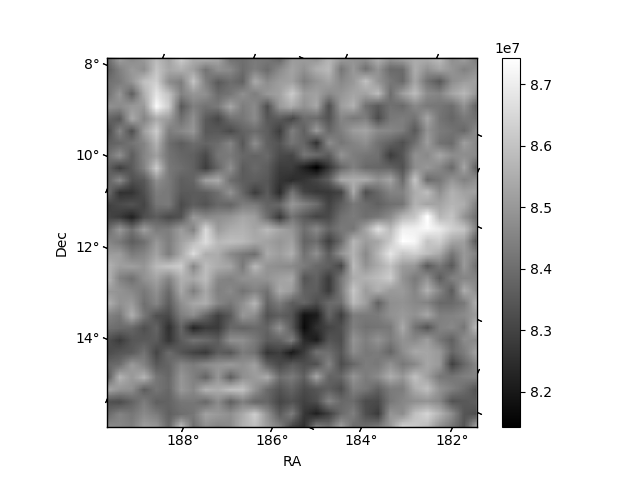
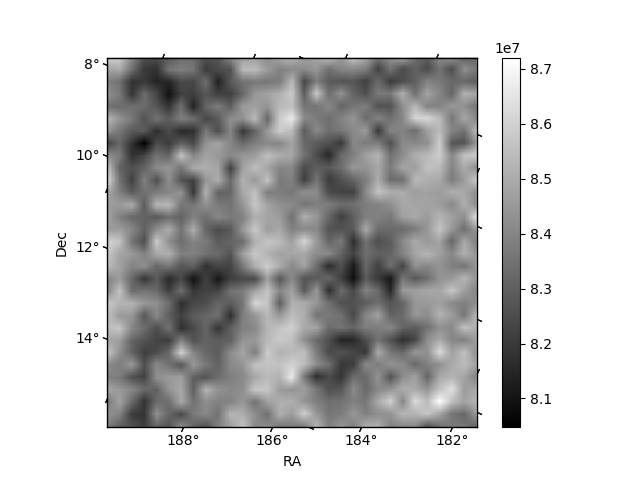
Histogram calculated using DETX and DETY for each event in the final _common_clean file
| Quadrant A | 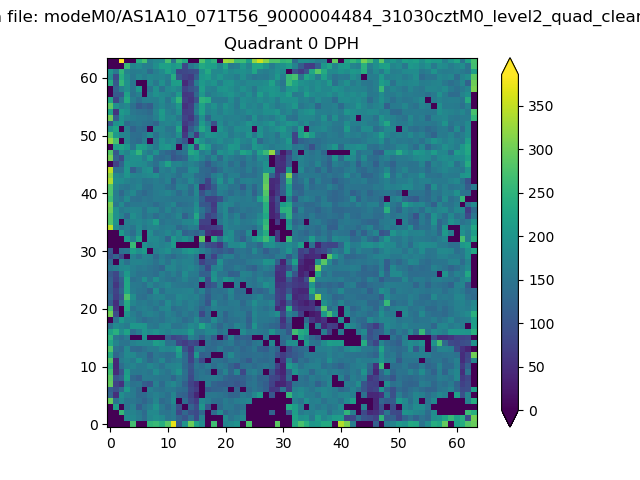 |
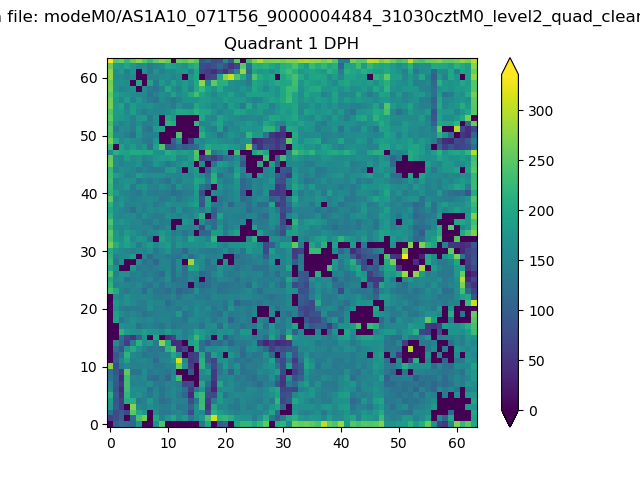 |
Quadrant B |
|---|---|---|---|
| Quadrant D | 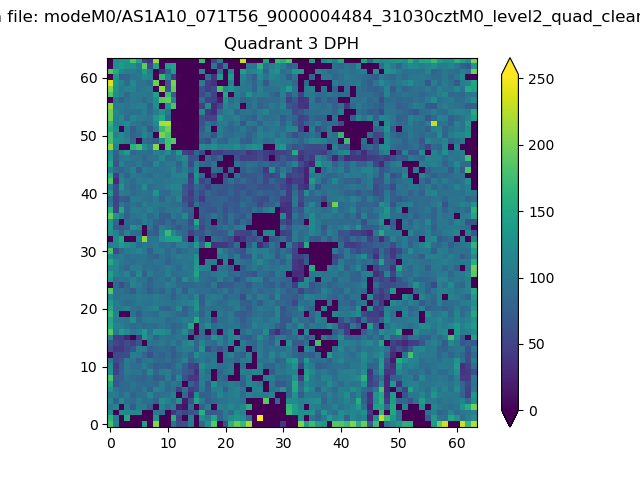 |
 |
Quadrant C |
| Plot type | Count rate plots | Images |
|---|---|---|
| Comparison with Poisson distribution Blue bars denote a histogram of data divided into 1 sec bins. Red curve is a Poisson curve with rate = median count rate of data. |
 |
 |
| Quadrant-wise count rates Data is divided into 100 sec bins |
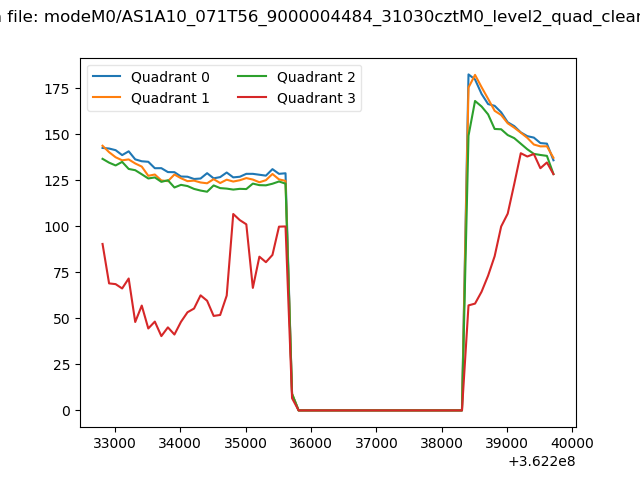 |
|
| Module-wise count rates for Quadrant A Data is divided into 100 sec bins |
 |
 |
| Module-wise count rates for Quadrant B Data is divided into 100 sec bins |
 |
 |
| Module-wise count rates for Quadrant C Data is divided into 100 sec bins |
 |
 |
| Module-wise count rates for Quadrant D Data is divided into 100 sec bins |
 |
 |
| Parameter | Plot |
|---|---|
| CZT HV Monitor |  |
| D_VDD | 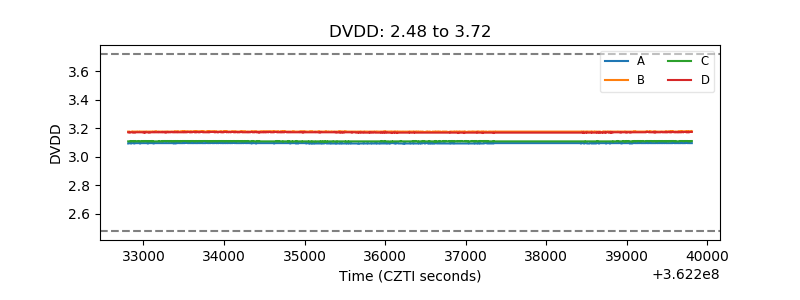 |
| Temperature 1 | 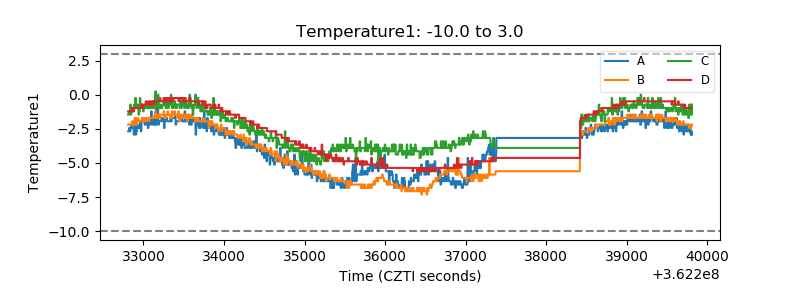 |
| Veto HV Monitor | 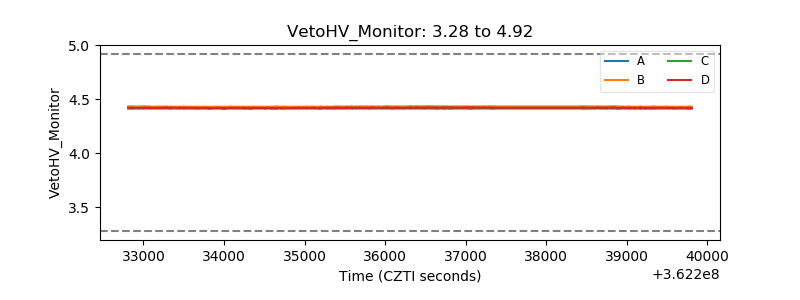 |
| Veto LLD | 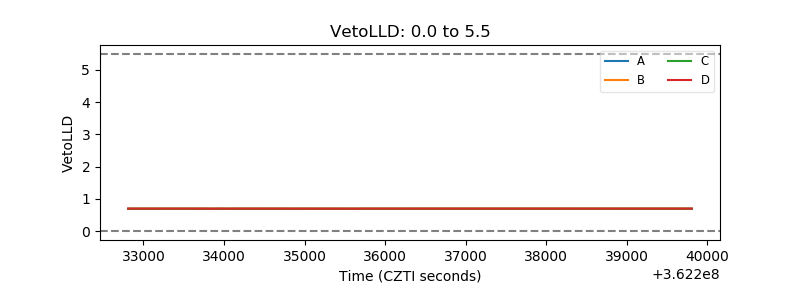 |
| Alpha Counter | 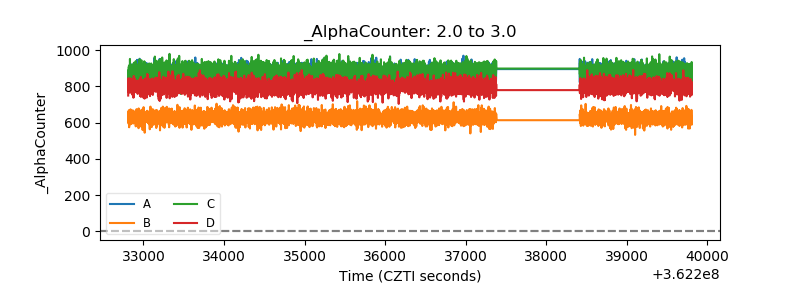 |
| _CPM_Rate | 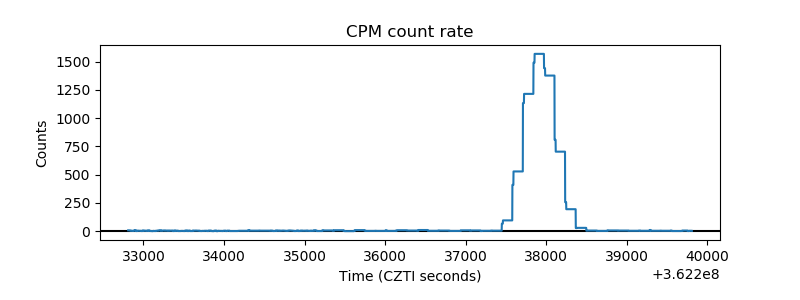 |
| CZT Counter | 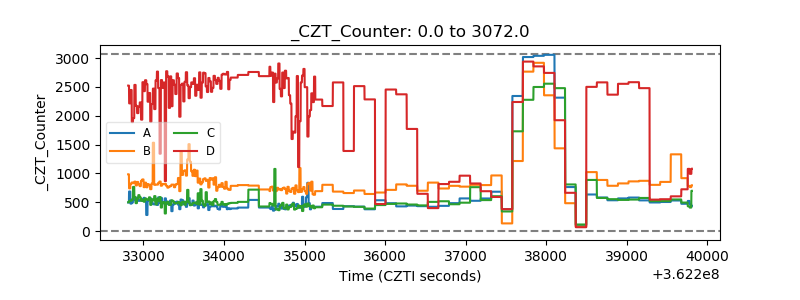 |
| +2.5 Volts monitor |  |
| +5 Volts monitor |  |
| _ROLL_ROT |  |
| _Roll_DEC |  |
| _Roll_RA | 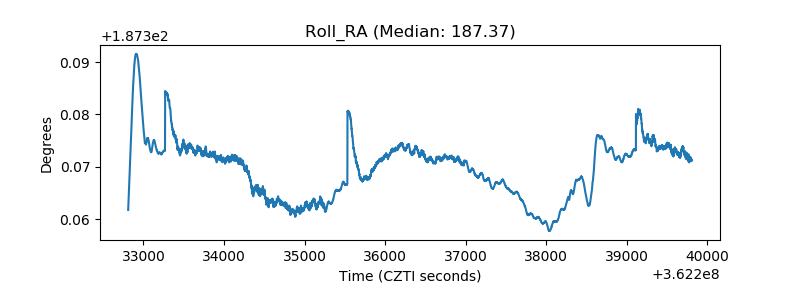 |
| Veto Counter |  |