| Param | Original file | Final file |
|---|---|---|
| Filename | modeM0/AS1A10_071T56_9000004484_31033cztM0_level2.evt | modeM0/AS1A10_071T56_9000004484_31033cztM0_level2_quad_clean.evt |
| Size (bytes) | 646,473,600 | 95,662,080 |
| Size | 616.5 MB | 91.2 MB |
| Events in quadrant A | 3,437,690 | 645,219 |
| Events in quadrant B | 5,455,744 | 644,919 |
| Events in quadrant C | 3,467,504 | 611,426 |
| Events in quadrant D | 6,799,150 | 562,363 |
| Mode M0 | |||
|---|---|---|---|
| Quadrant | BADHDUFLAG | Total packets | Discarded packets |
| A | 0 | 14178 | 2 |
| B | 0 | 20361 | 2 |
| C | 0 | 14222 | 2 |
| D | 0 | 24238 | 4 |
| Mode SS | |||
|---|---|---|---|
| Quadrant | BADHDUFLAG | Total packets | Discarded packets |
| A | 0 | 126 | 0 |
| B | 0 | 126 | 0 |
| C | 0 | 126 | 0 |
| D | 0 | 126 | 0 |
| Mode M9 | |||
|---|---|---|---|
| Quadrant | BADHDUFLAG | Total packets | Discarded packets |
| A | 0 | 14 | 0 |
| B | 0 | 15 | 0 |
| C | 0 | 15 | 0 |
| D | 0 | 15 | 0 |
| Quadrant | Total seconds | Saturated seconds | Saturation percentage |
|---|---|---|---|
| A | 6203 | 54 | 0.870547% |
| B | 6203 | 174 | 2.805094% |
| C | 6203 | 192 | 3.095276% |
| D | 6202 | 591 | 9.529184% |
Noise dominated data is calculated using 1-second bins in cleaned event files. If a bin has >2000 counts, and if more than 50% of those come from <1% of pixels, then it is considered to be noise-dominated and hence unusable.
| Quadrant | # 1 sec bins | Bins with >0 counts | Bins with >2000 counts | High rate bins dominated by noise | Noise dominated (total time) | Noise dominated (detector-on time) | Marked lightcurve |
|---|---|---|---|---|---|---|---|
| A | 7498 | 6203 | 0 | 0 | 0.00% | 0.00% | 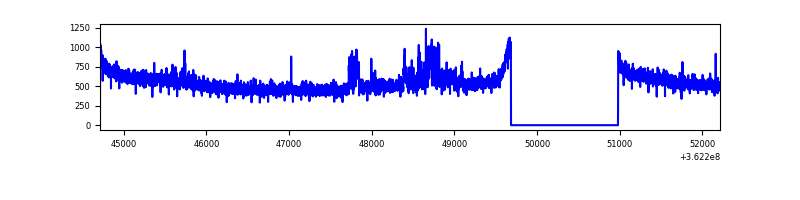 |
| B | 7498 | 6203 | 31 | 31 | 0.41% | 0.50% | 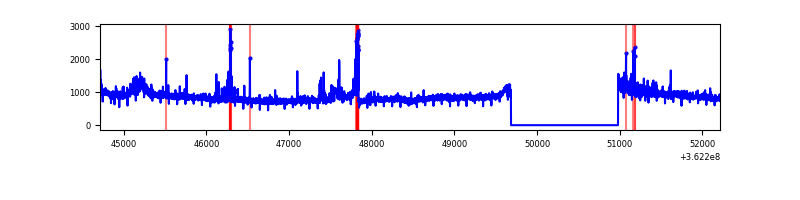 |
| C | 7498 | 6203 | 17 | 17 | 0.23% | 0.27% | 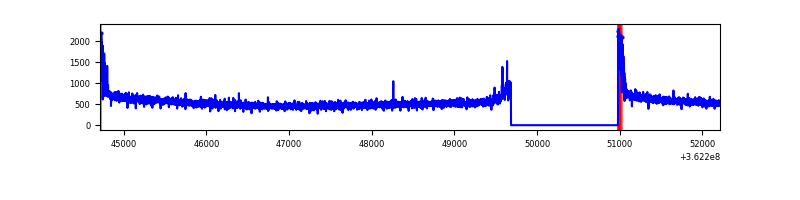 |
| D | 7497 | 6202 | 442 | 442 | 5.90% | 7.13% | 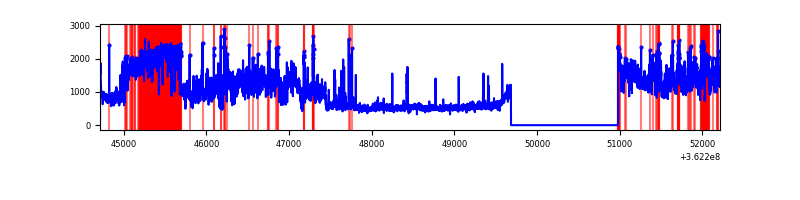 |
Top three noisy pixels from each quadrant. If the there are fewer than three noisy pixels in the level2.evt file, extra rows are filled as -1
| Pixel properties | Quadrant properties | ||||||
|---|---|---|---|---|---|---|---|
| Quadrant | DetID | PixID | Counts | Sigma | Mean | Median | Sigma |
| A | 11 | 47 | 184432 | 1089.48 | 843 | 829 | 168.5 |
| A | 13 | 254 | 12767 | 70.84 | 843 | 829 | 168.5 |
| A | 3 | 137 | 7818 | 41.47 | 843 | 829 | 168.5 |
| B | 6 | 159 | 1802138 | 11579.41 | 833 | 814 | 155.6 |
| B | 0 | 155 | 118410 | 755.94 | 833 | 814 | 155.6 |
| B | 4 | 52 | 99504 | 634.41 | 833 | 814 | 155.6 |
| C | 0 | 10 | 132985 | 710.55 | 802 | 809 | 186.0 |
| C | 14 | 238 | 131328 | 701.65 | 802 | 809 | 186.0 |
| C | 1 | 16 | 23965 | 124.48 | 802 | 809 | 186.0 |
| D | 13 | 174 | 3034582 | 16146.2 | 795 | 777 | 187.9 |
| D | 8 | 195 | 531716 | 2825.71 | 795 | 777 | 187.9 |
| D | 1 | 52 | 87644 | 462.31 | 795 | 777 | 187.9 |
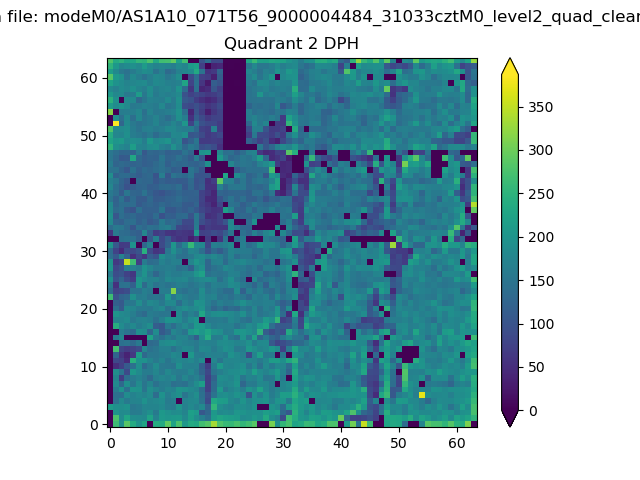
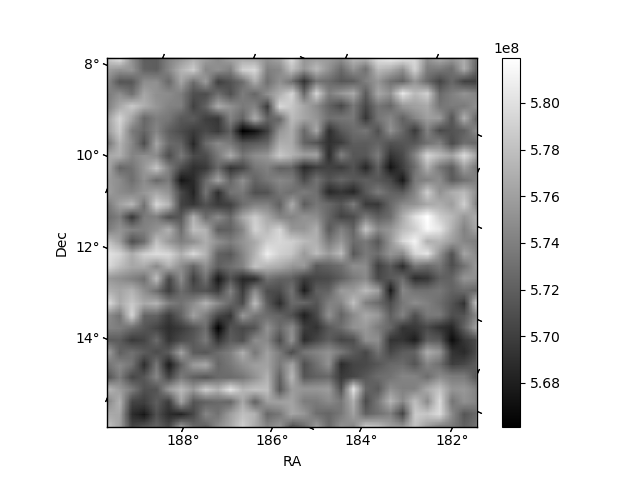
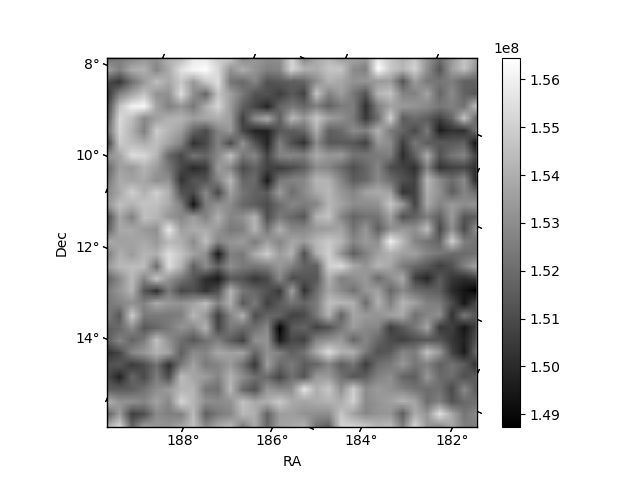
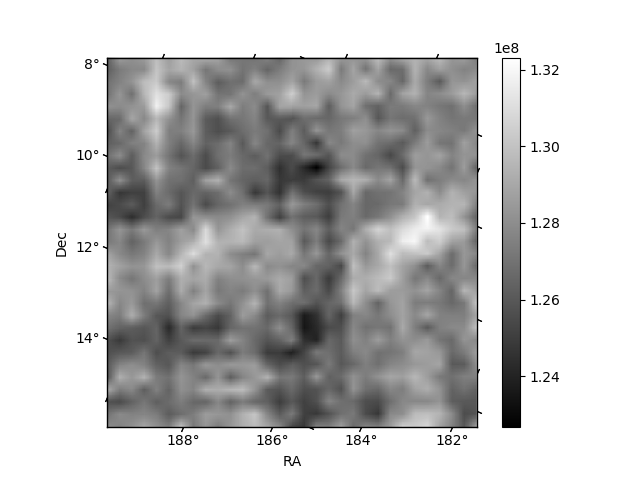
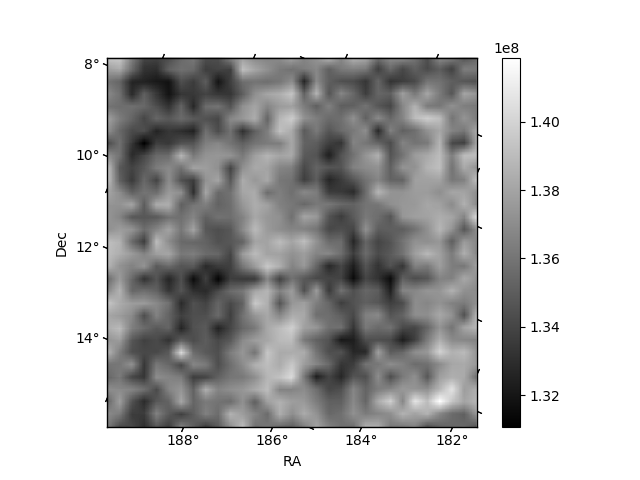
Histogram calculated using DETX and DETY for each event in the final _common_clean file
| Quadrant A | 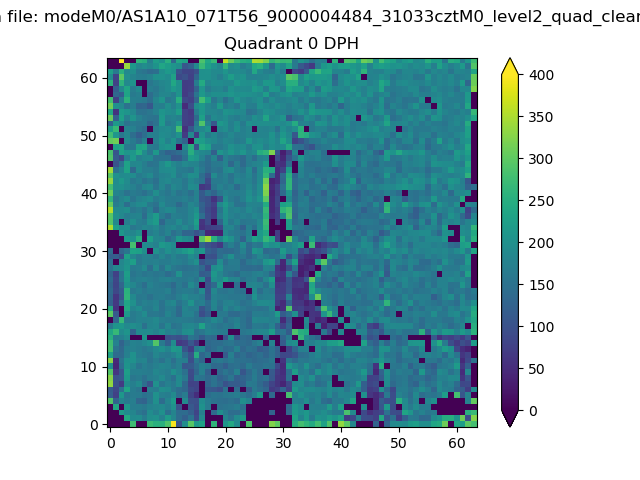 |
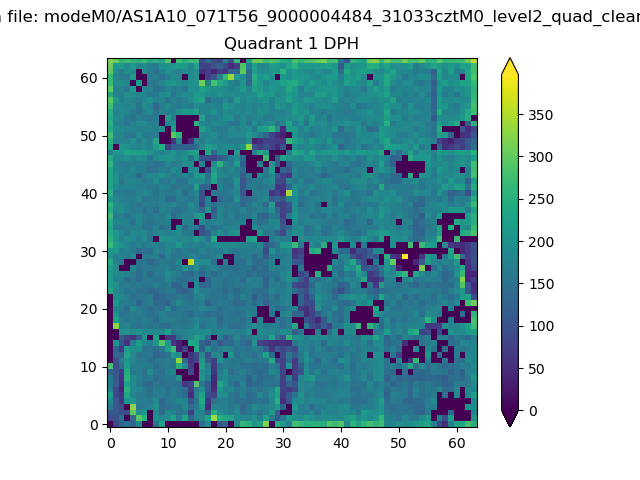 |
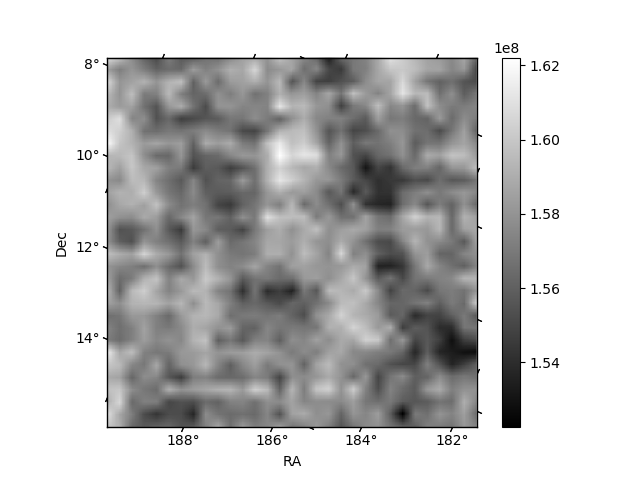
Quadrant B |
|---|---|---|---|
| Quadrant D | 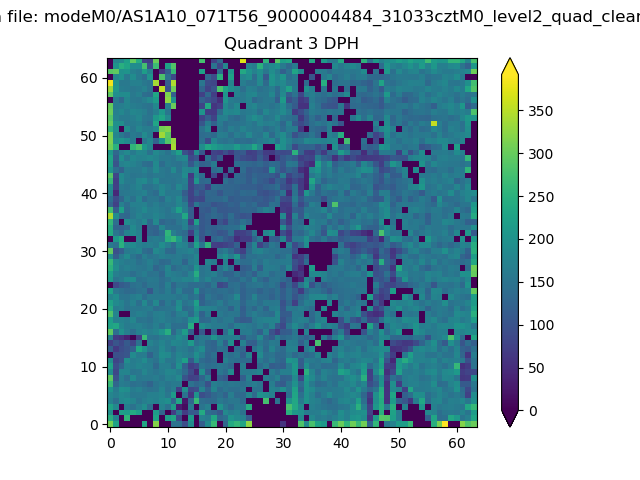 |
 |
Quadrant C |
| Plot type | Count rate plots | Images |
|---|---|---|
| Comparison with Poisson distribution Blue bars denote a histogram of data divided into 1 sec bins. Red curve is a Poisson curve with rate = median count rate of data. |
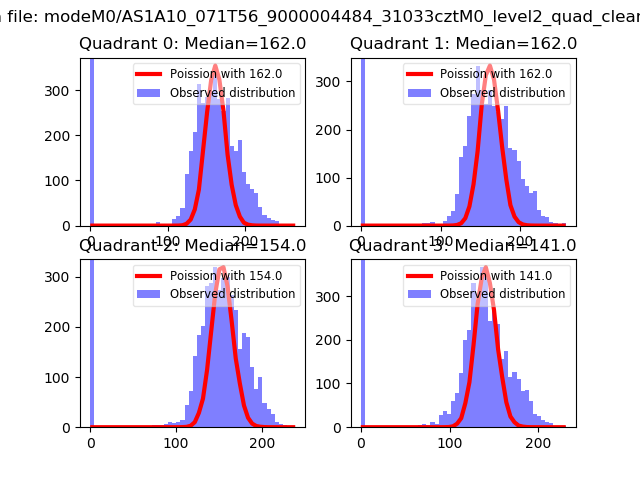 |
 |
| Quadrant-wise count rates Data is divided into 100 sec bins |
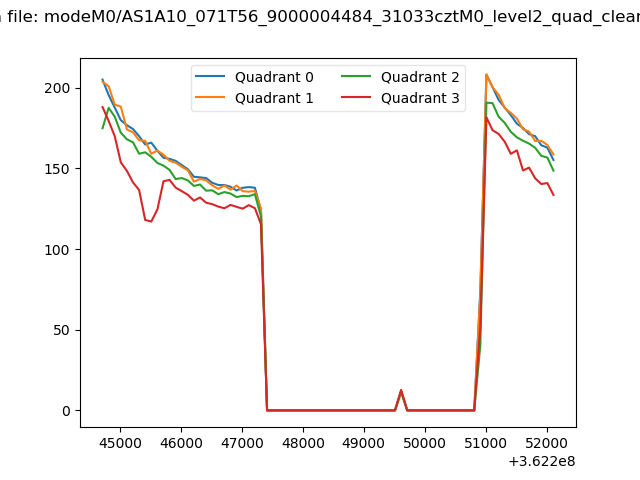 |
|
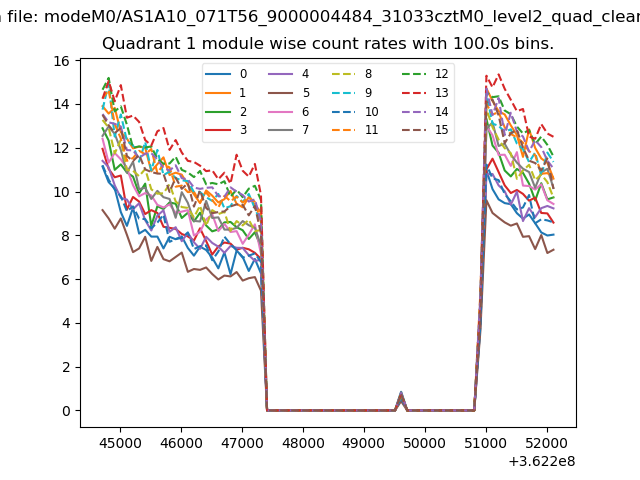
| Module-wise count rates for Quadrant A Data is divided into 100 sec bins |
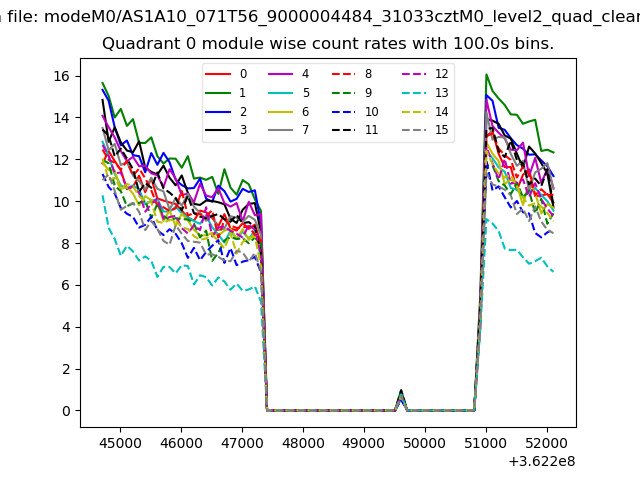 |
 |
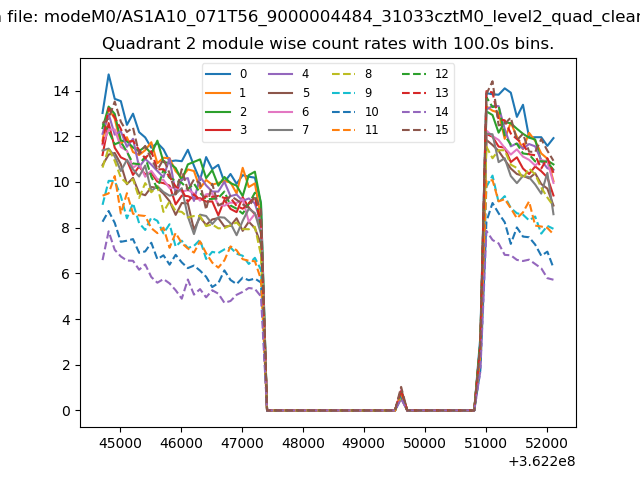
| Module-wise count rates for Quadrant B Data is divided into 100 sec bins |
 |
 |
| Module-wise count rates for Quadrant C Data is divided into 100 sec bins |
 |
 |
| Module-wise count rates for Quadrant D Data is divided into 100 sec bins |
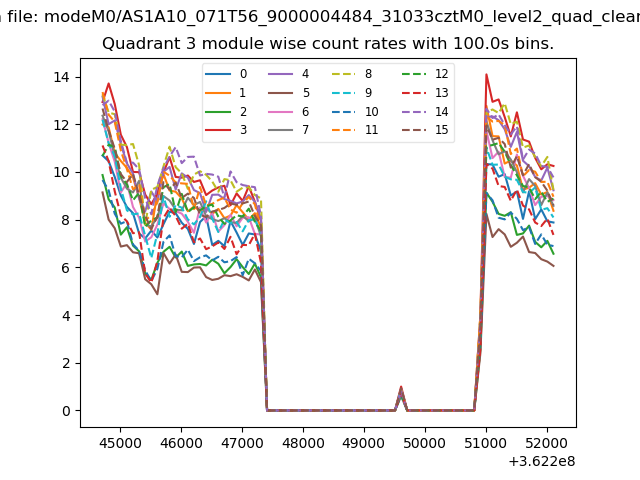 |
 |
| Parameter | Plot |
|---|---|
| CZT HV Monitor |  |
| D_VDD | 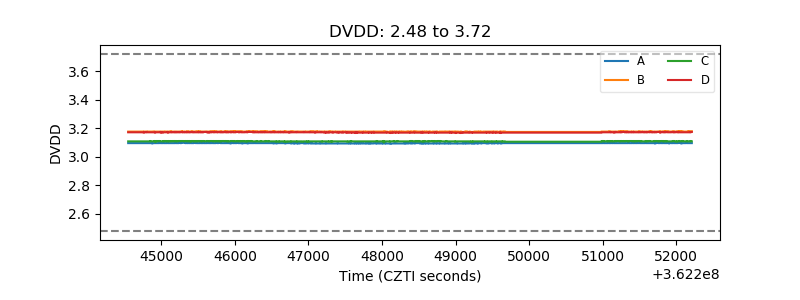 |
| Temperature 1 | 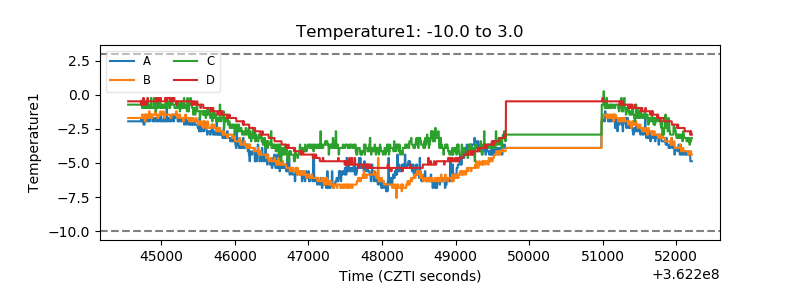 |
| Veto HV Monitor | 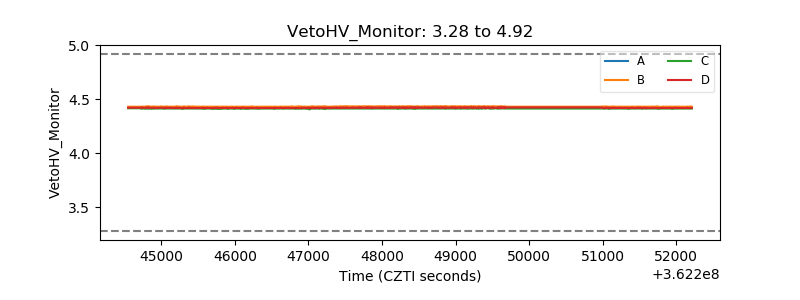 |
| Veto LLD | 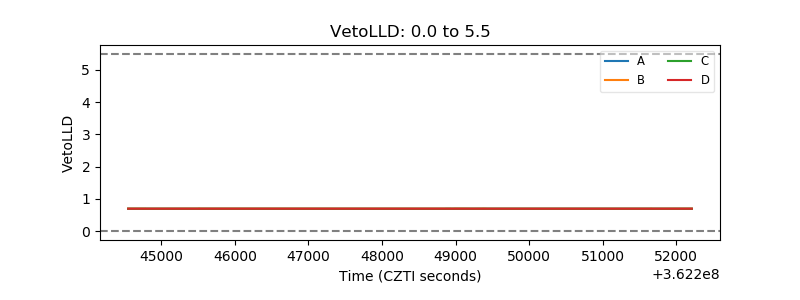 |
| Alpha Counter | 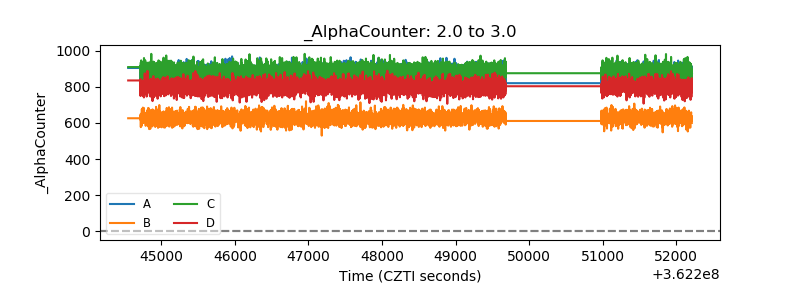 |
| _CPM_Rate | 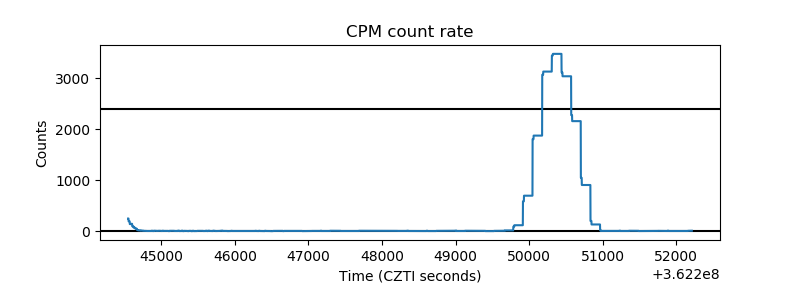 |
| CZT Counter |  |
| +2.5 Volts monitor |  |
| +5 Volts monitor | 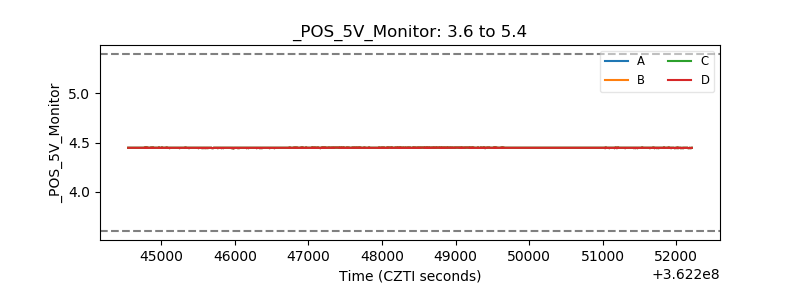 |
| _ROLL_ROT | 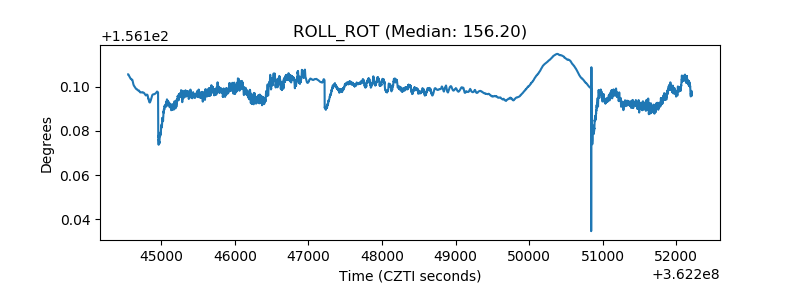 |
| _Roll_DEC | 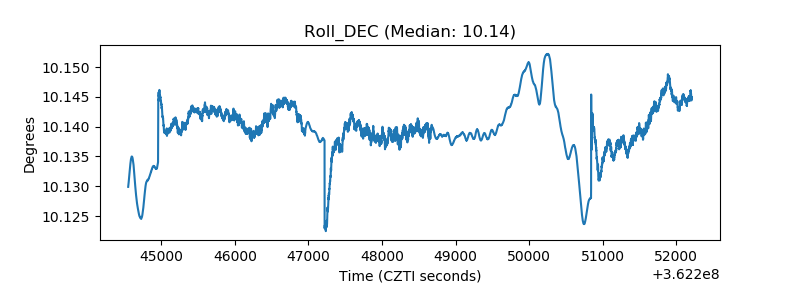 |
| _Roll_RA | 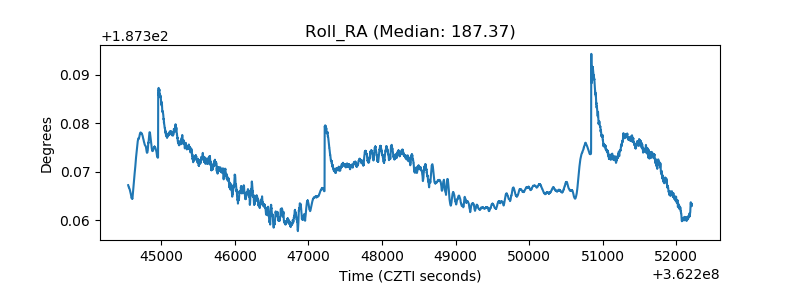 |
| Veto Counter | 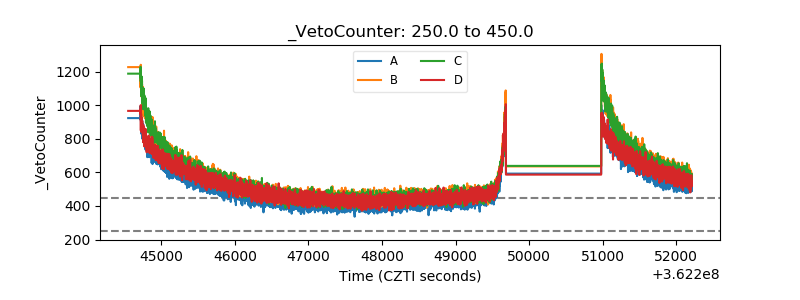 |