| Param | Original file | Final file |
|---|---|---|
| Filename | modeM0/AS1A10_071T56_9000004484_31034cztM0_level2.evt | modeM0/AS1A10_071T56_9000004484_31034cztM0_level2_quad_clean.evt |
| Size (bytes) | 628,312,320 | 94,438,080 |
| Size | 599.2 MB | 90.1 MB |
| Events in quadrant A | 3,313,595 | 637,346 |
| Events in quadrant B | 5,385,451 | 636,781 |
| Events in quadrant C | 3,452,285 | 601,523 |
| Events in quadrant D | 6,469,473 | 562,046 |
| Mode M0 | |||
|---|---|---|---|
| Quadrant | BADHDUFLAG | Total packets | Discarded packets |
| A | 0 | 13653 | 2 |
| B | 0 | 19957 | 3 |
| C | 0 | 13989 | 2 |
| D | 0 | 23618 | 2 |
| Mode SS | |||
|---|---|---|---|
| Quadrant | BADHDUFLAG | Total packets | Discarded packets |
| A | 0 | 124 | 0 |
| B | 0 | 124 | 0 |
| C | 0 | 124 | 0 |
| D | 0 | 124 | 0 |
| Mode M9 | |||
|---|---|---|---|
| Quadrant | BADHDUFLAG | Total packets | Discarded packets |
| A | 0 | 13 | 0 |
| B | 0 | 14 | 0 |
| C | 0 | 14 | 0 |
| D | 0 | 14 | 0 |
| Quadrant | Total seconds | Saturated seconds | Saturation percentage |
|---|---|---|---|
| A | 6040 | 60 | 0.993377% |
| B | 6039 | 230 | 3.808578% |
| C | 6039 | 198 | 3.278689% |
| D | 6039 | 275 | 4.553734% |
Noise dominated data is calculated using 1-second bins in cleaned event files. If a bin has >2000 counts, and if more than 50% of those come from <1% of pixels, then it is considered to be noise-dominated and hence unusable.
| Quadrant | # 1 sec bins | Bins with >0 counts | Bins with >2000 counts | High rate bins dominated by noise | Noise dominated (total time) | Noise dominated (detector-on time) | Marked lightcurve |
|---|---|---|---|---|---|---|---|
| A | 7420 | 6040 | 0 | 0 | 0.00% | 0.00% | 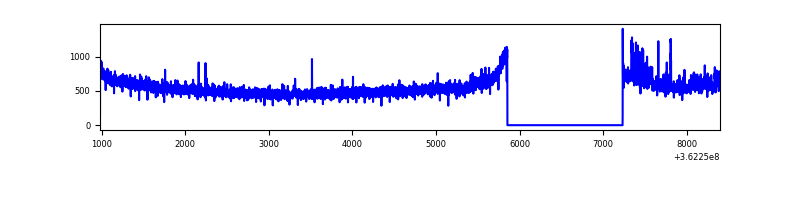 |
| B | 7419 | 6039 | 58 | 58 | 0.78% | 0.96% | 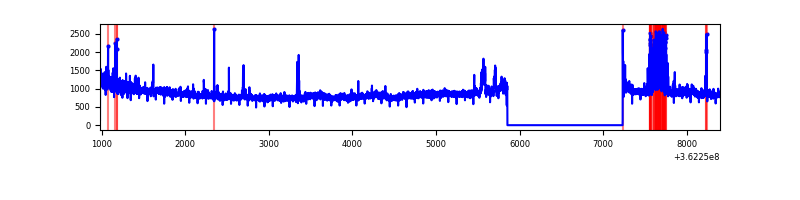 |
| C | 7419 | 6039 | 41 | 41 | 0.55% | 0.68% | 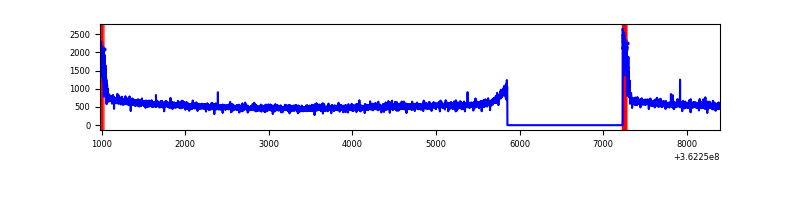 |
| D | 7419 | 6039 | 216 | 216 | 2.91% | 3.58% | 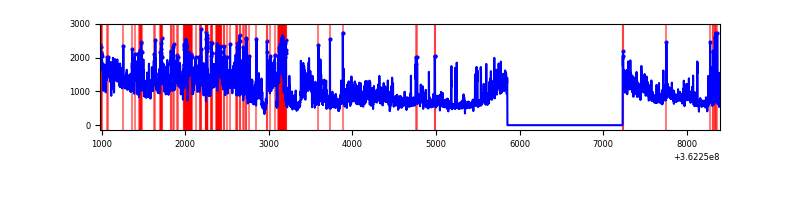 |
Top three noisy pixels from each quadrant. If the there are fewer than three noisy pixels in the level2.evt file, extra rows are filled as -1
| Pixel properties | Quadrant properties | ||||||
|---|---|---|---|---|---|---|---|
| Quadrant | DetID | PixID | Counts | Sigma | Mean | Median | Sigma |
| A | 11 | 47 | 105359 | 632.87 | 831 | 816 | 165.2 |
| A | 13 | 254 | 12133 | 68.51 | 831 | 816 | 165.2 |
| A | 3 | 137 | 7760 | 42.04 | 831 | 816 | 165.2 |
| B | 6 | 159 | 1760661 | 11485.31 | 824 | 805 | 153.2 |
| B | 5 | 172 | 184251 | 1197.22 | 824 | 805 | 153.2 |
| B | 0 | 155 | 68241 | 440.11 | 824 | 805 | 153.2 |
| C | 0 | 10 | 179184 | 974.62 | 788 | 795 | 183.0 |
| C | 14 | 238 | 130324 | 707.68 | 788 | 795 | 183.0 |
| C | 3 | 233 | 26024 | 137.84 | 788 | 795 | 183.0 |
| D | 13 | 174 | 2568305 | 13778.12 | 784 | 766 | 186.3 |
| D | 8 | 195 | 747082 | 4004.94 | 784 | 766 | 186.3 |
| D | 1 | 52 | 79603 | 423.06 | 784 | 766 | 186.3 |
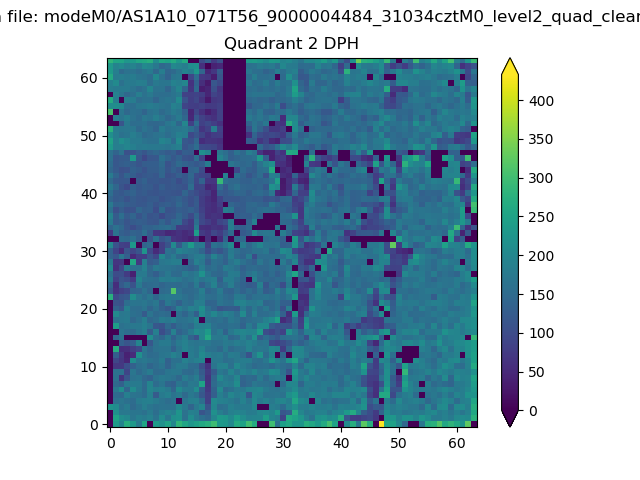
Histogram calculated using DETX and DETY for each event in the final _common_clean file
| Quadrant A | 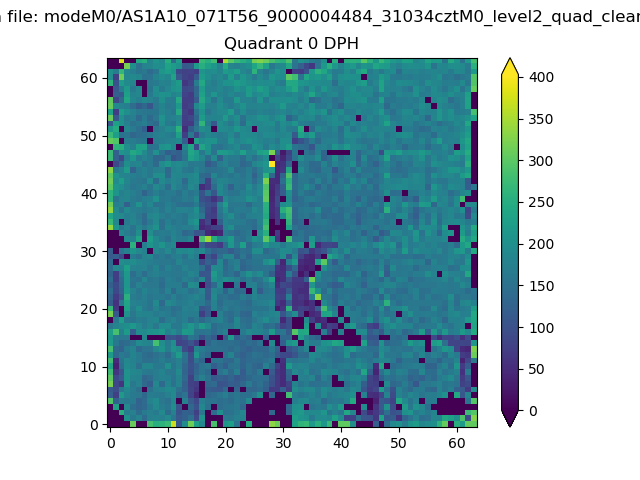 |
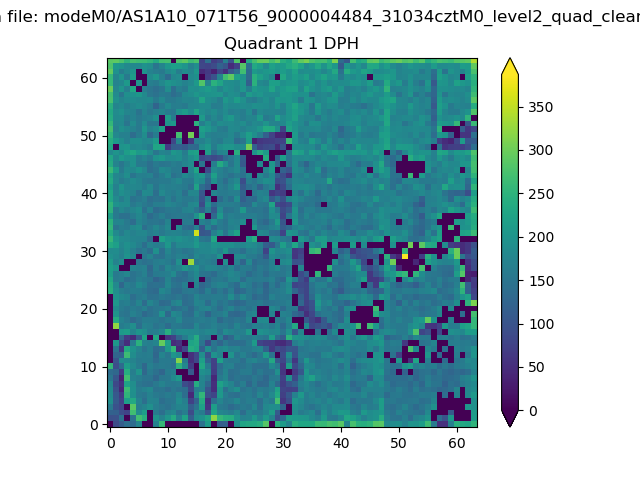 |
Quadrant B |
|---|---|---|---|
| Quadrant D | 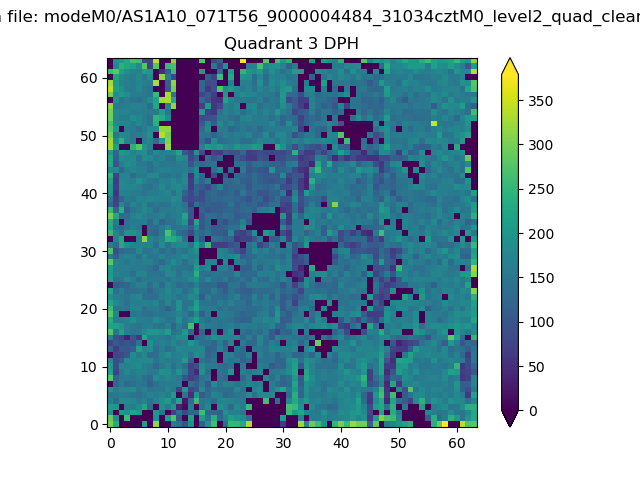 |
 |
Quadrant C |
| Plot type | Count rate plots | Images |
|---|---|---|
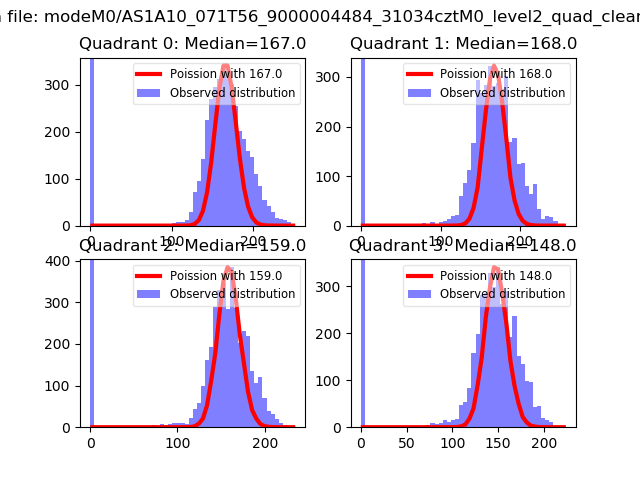
| Comparison with Poisson distribution Blue bars denote a histogram of data divided into 1 sec bins. Red curve is a Poisson curve with rate = median count rate of data. |
 |
 |
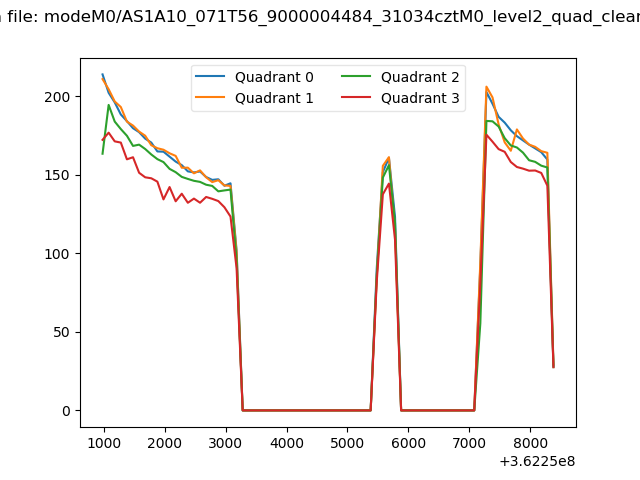
| Quadrant-wise count rates Data is divided into 100 sec bins |
 |
|
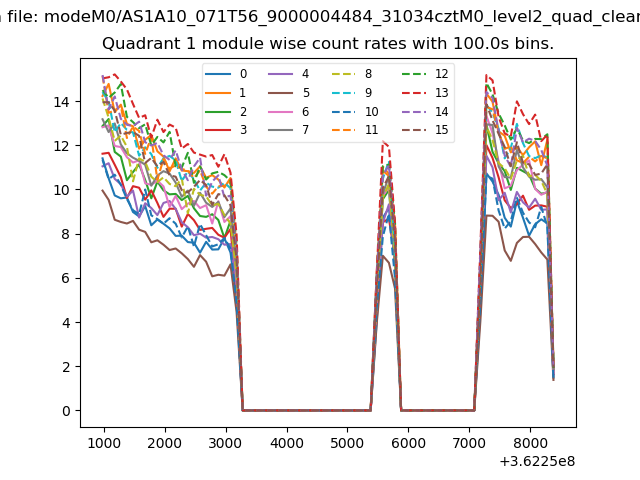
| Module-wise count rates for Quadrant A Data is divided into 100 sec bins |
 |
 |
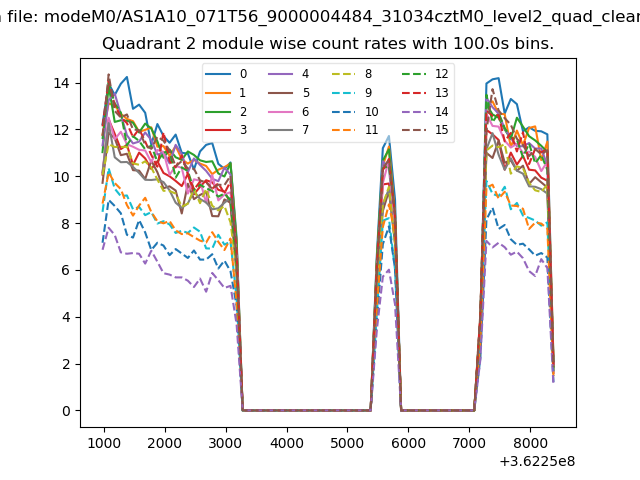
| Module-wise count rates for Quadrant B Data is divided into 100 sec bins |
 |
 |
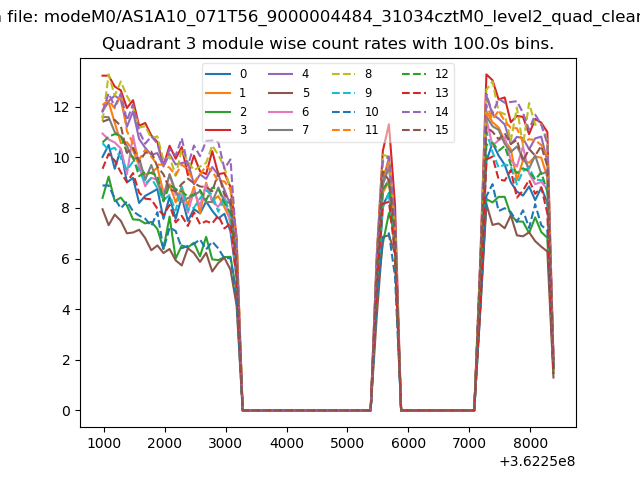
| Module-wise count rates for Quadrant C Data is divided into 100 sec bins |
 |
 |
| Module-wise count rates for Quadrant D Data is divided into 100 sec bins |
 |
 |
| Parameter | Plot |
|---|---|
| CZT HV Monitor |  |
| D_VDD | 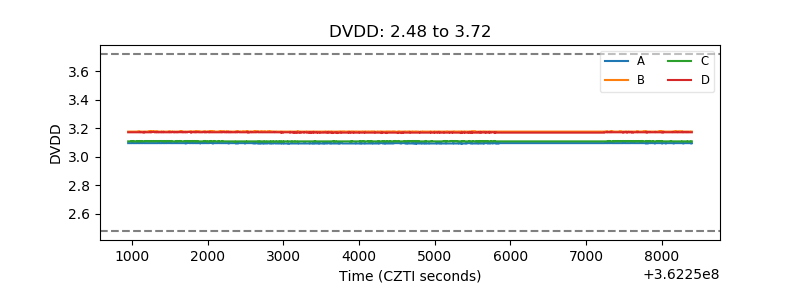 |
| Temperature 1 | 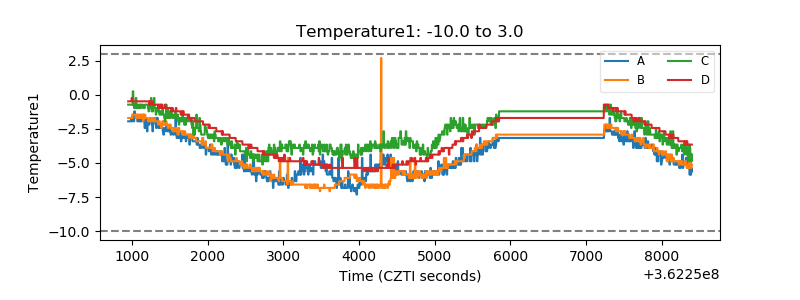 |
| Veto HV Monitor | 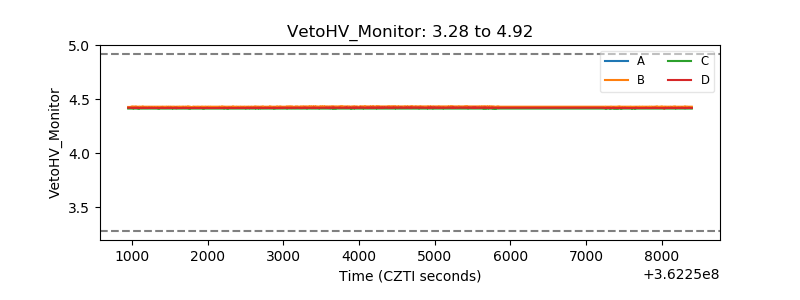 |
| Veto LLD | 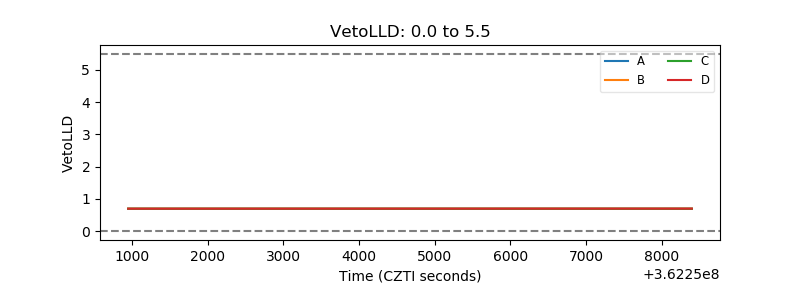 |
| Alpha Counter | 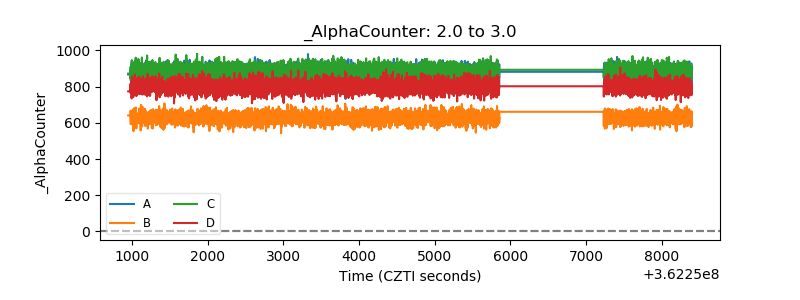 |
| _CPM_Rate | 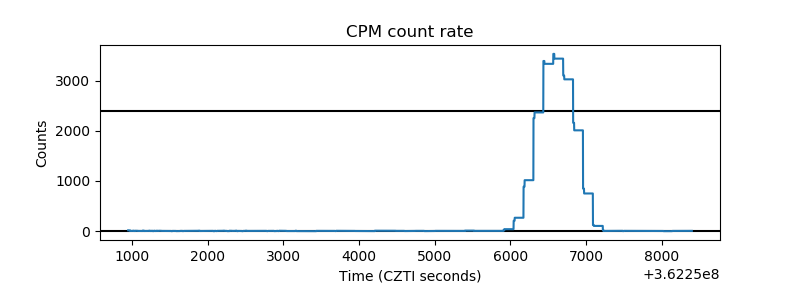 |
| CZT Counter | 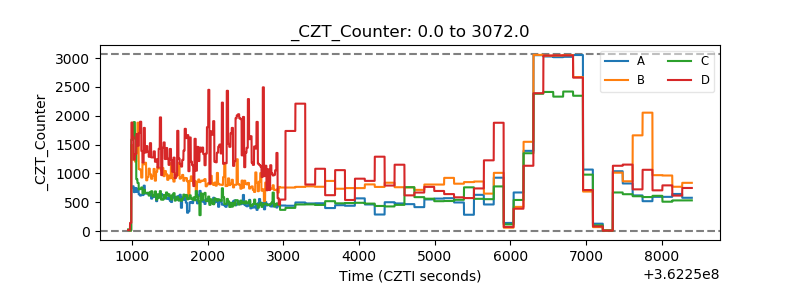 |
| +2.5 Volts monitor |  |
| +5 Volts monitor |  |
| _ROLL_ROT | 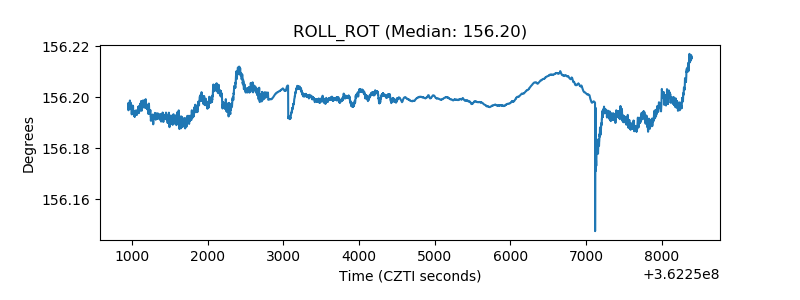 |
| _Roll_DEC | 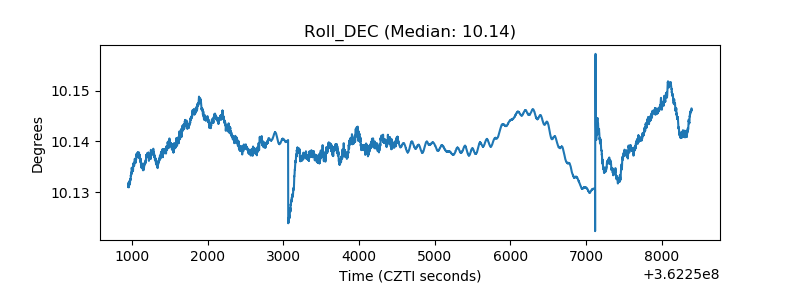 |
| _Roll_RA | 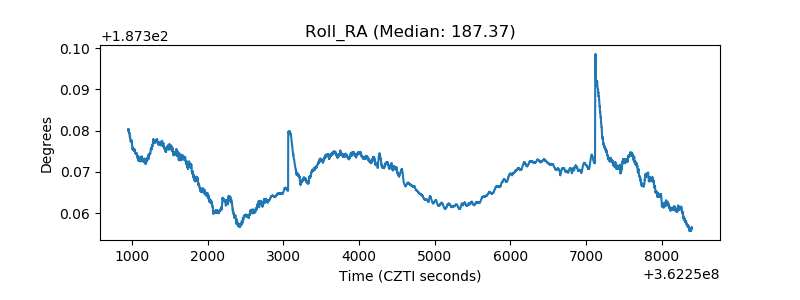 |
| Veto Counter |  |