| Param | Original file | Final file |
|---|---|---|
| Filename | modeM0/AS1A10_071T56_9000004484_31035cztM0_level2.evt | modeM0/AS1A10_071T56_9000004484_31035cztM0_level2_quad_clean.evt |
| Size (bytes) | 559,638,720 | 95,676,480 |
| Size | 533.7 MB | 91.2 MB |
| Events in quadrant A | 3,407,695 | 641,350 |
| Events in quadrant B | 5,396,516 | 637,992 |
| Events in quadrant C | 3,474,878 | 606,142 |
| Events in quadrant D | 4,252,332 | 581,314 |
| Mode M0 | |||
|---|---|---|---|
| Quadrant | BADHDUFLAG | Total packets | Discarded packets |
| A | 0 | 13808 | 2 |
| B | 0 | 19988 | 3 |
| C | 0 | 13977 | 2 |
| D | 0 | 16696 | 2 |
| Mode SS | |||
|---|---|---|---|
| Quadrant | BADHDUFLAG | Total packets | Discarded packets |
| A | 0 | 126 | 0 |
| B | 0 | 126 | 0 |
| C | 0 | 126 | 0 |
| D | 0 | 126 | 0 |
| Mode M9 | |||
|---|---|---|---|
| Quadrant | BADHDUFLAG | Total packets | Discarded packets |
| A | 0 | 23 | 0 |
| B | 0 | 24 | 0 |
| C | 0 | 24 | 0 |
| D | 0 | 24 | 0 |
| Quadrant | Total seconds | Saturated seconds | Saturation percentage |
|---|---|---|---|
| A | 6167 | 57 | 0.924274% |
| B | 6166 | 235 | 3.811223% |
| C | 6166 | 174 | 2.821927% |
| D | 6166 | 79 | 1.281220% |
Noise dominated data is calculated using 1-second bins in cleaned event files. If a bin has >2000 counts, and if more than 50% of those come from <1% of pixels, then it is considered to be noise-dominated and hence unusable.
| Quadrant | # 1 sec bins | Bins with >0 counts | Bins with >2000 counts | High rate bins dominated by noise | Noise dominated (total time) | Noise dominated (detector-on time) | Marked lightcurve |
|---|---|---|---|---|---|---|---|
| A | 7552 | 6167 | 13 | 13 | 0.17% | 0.21% |  |
| B | 7551 | 6166 | 95 | 95 | 1.26% | 1.54% | 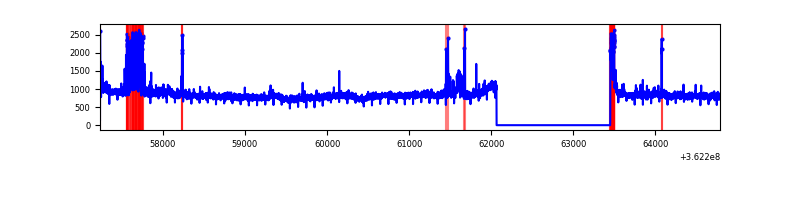 |
| C | 7551 | 6166 | 41 | 41 | 0.54% | 0.66% | 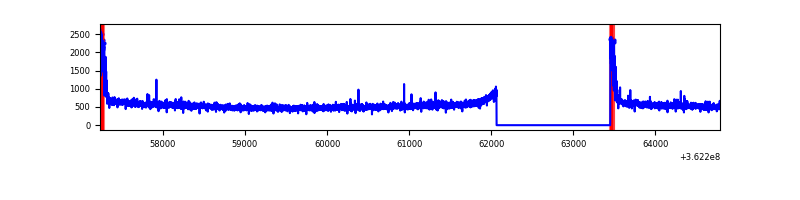 |
| D | 7551 | 6167 | 40 | 40 | 0.53% | 0.65% | 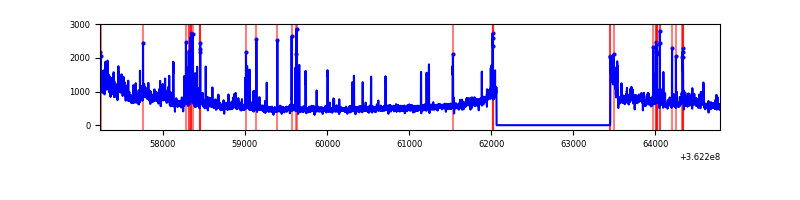 |
Top three noisy pixels from each quadrant. If the there are fewer than three noisy pixels in the level2.evt file, extra rows are filled as -1
| Pixel properties | Quadrant properties | ||||||
|---|---|---|---|---|---|---|---|
| Quadrant | DetID | PixID | Counts | Sigma | Mean | Median | Sigma |
| A | 11 | 47 | 113065 | 674.71 | 838 | 825 | 166.4 |
| A | 0 | 13 | 60520 | 358.85 | 838 | 825 | 166.4 |
| A | 13 | 254 | 12566 | 70.58 | 838 | 825 | 166.4 |
| B | 6 | 159 | 1741314 | 11323.56 | 825 | 806 | 153.7 |
| B | 5 | 172 | 274350 | 1779.65 | 825 | 806 | 153.7 |
| B | 0 | 190 | 64840 | 416.6 | 825 | 806 | 153.7 |
| C | 0 | 10 | 186295 | 996.56 | 792 | 799 | 186.1 |
| C | 14 | 238 | 130532 | 696.98 | 792 | 799 | 186.1 |
| C | 3 | 233 | 35509 | 186.48 | 792 | 799 | 186.1 |
| D | 8 | 195 | 557905 | 2956.55 | 791 | 770 | 188.4 |
| D | 13 | 174 | 545715 | 2891.87 | 791 | 770 | 188.4 |
| D | 13 | 249 | 60522 | 317.08 | 791 | 770 | 188.4 |
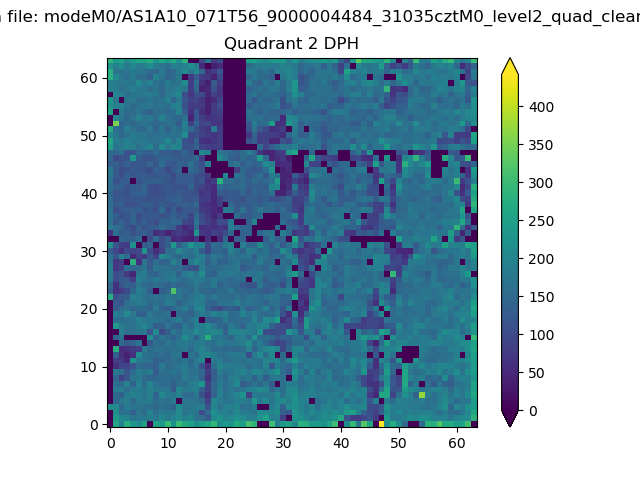
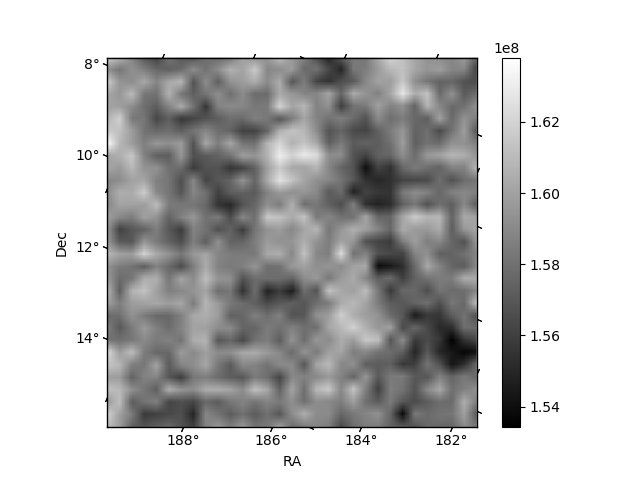
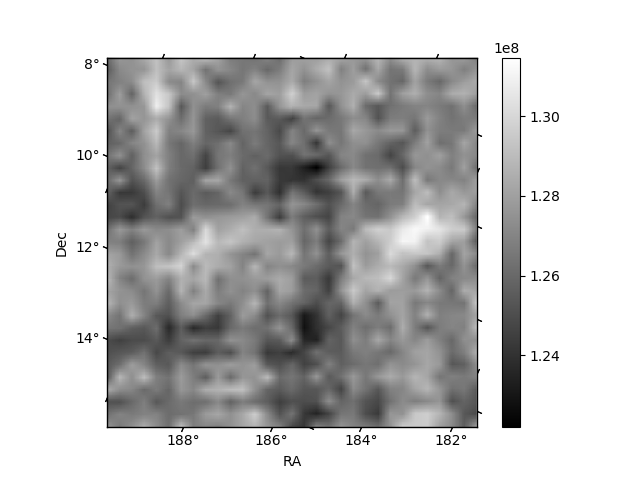
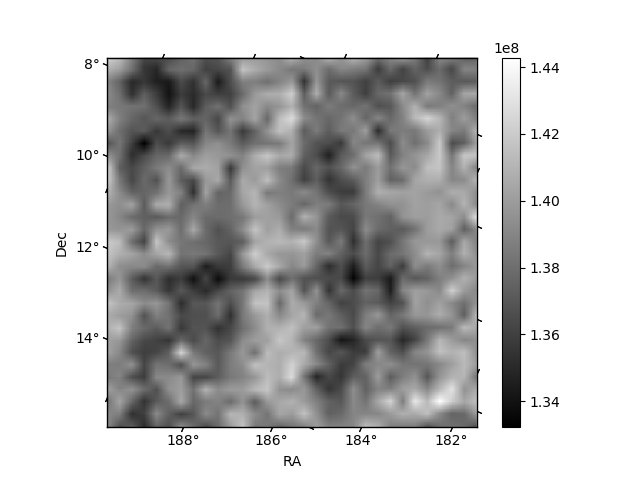
Histogram calculated using DETX and DETY for each event in the final _common_clean file
| Quadrant A | 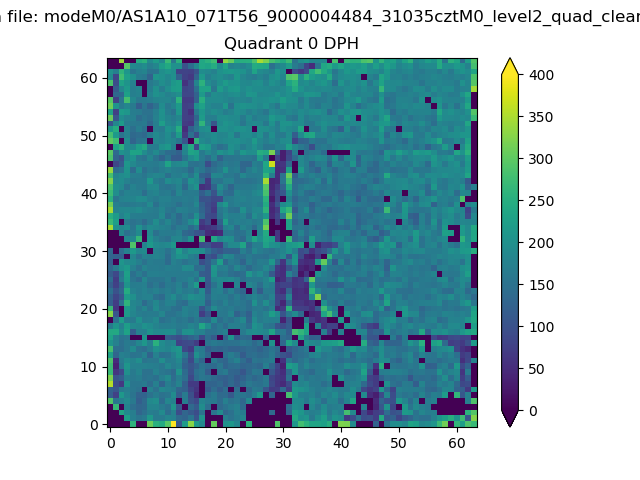 |
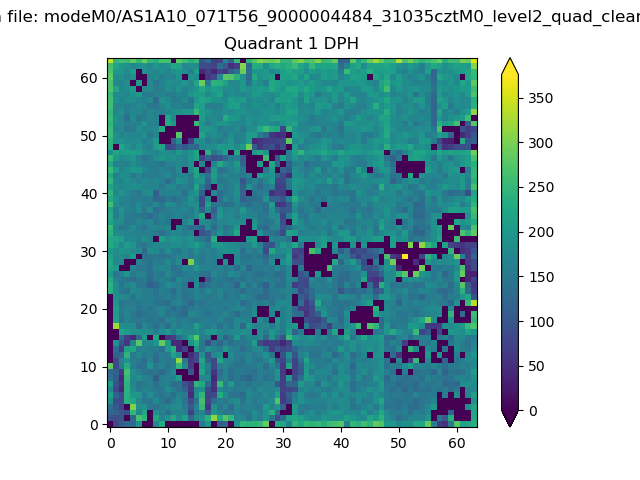 |
Quadrant B |
|---|---|---|---|
| Quadrant D | 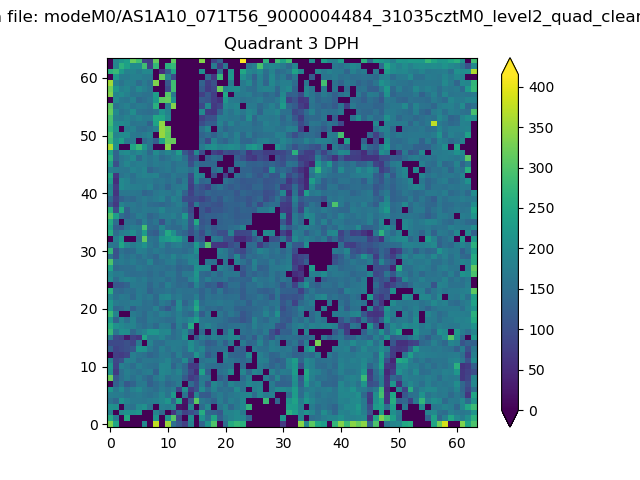 |
 |
Quadrant C |
| Plot type | Count rate plots | Images |
|---|---|---|
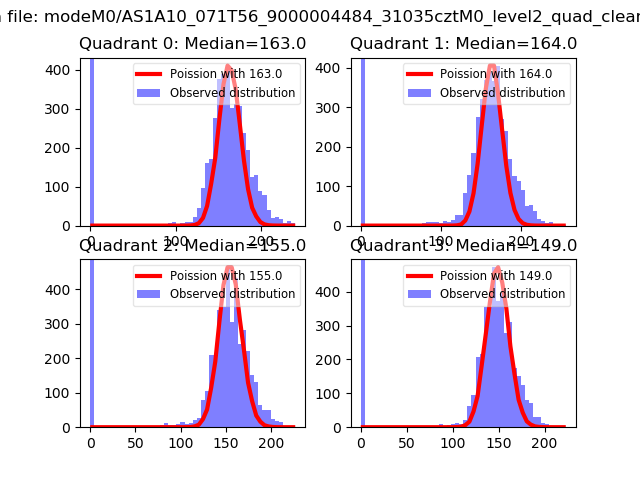
| Comparison with Poisson distribution Blue bars denote a histogram of data divided into 1 sec bins. Red curve is a Poisson curve with rate = median count rate of data. |
 |
 |
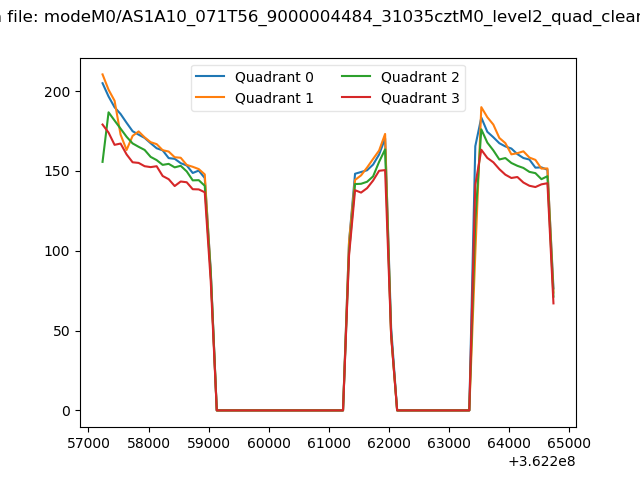
| Quadrant-wise count rates Data is divided into 100 sec bins |
 |
|
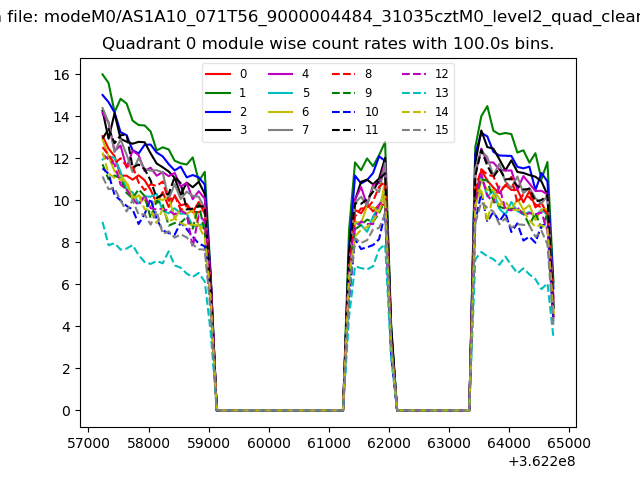
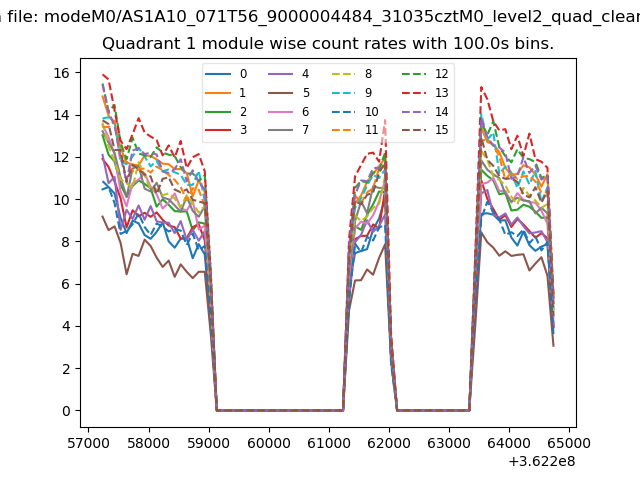
| Module-wise count rates for Quadrant A Data is divided into 100 sec bins |
 |
 |
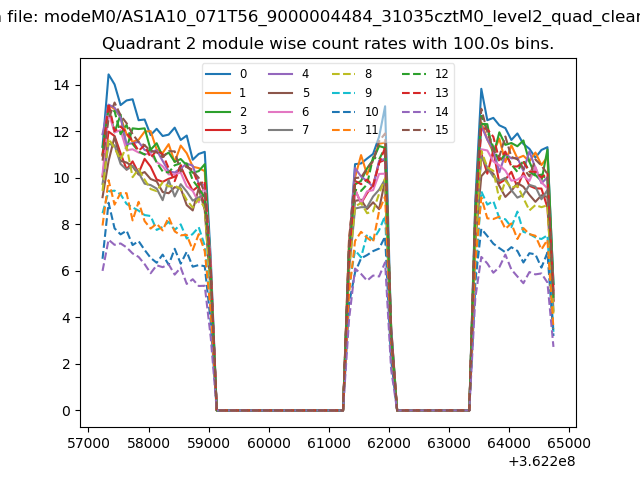
| Module-wise count rates for Quadrant B Data is divided into 100 sec bins |
 |
 |
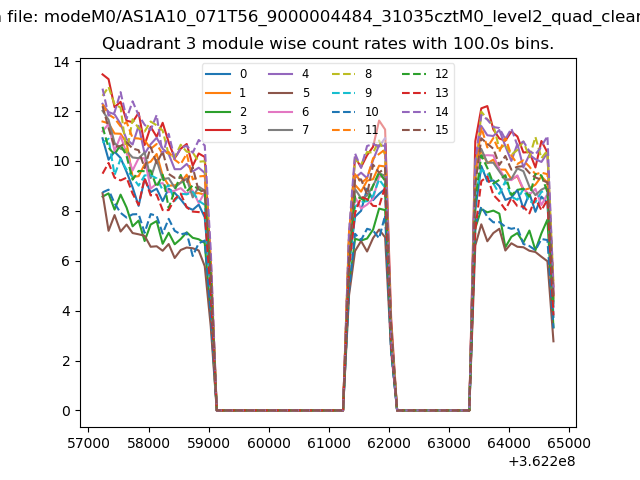
| Module-wise count rates for Quadrant C Data is divided into 100 sec bins |
 |
 |
| Module-wise count rates for Quadrant D Data is divided into 100 sec bins |
 |
 |
| Parameter | Plot |
|---|---|
| CZT HV Monitor |  |
| D_VDD | 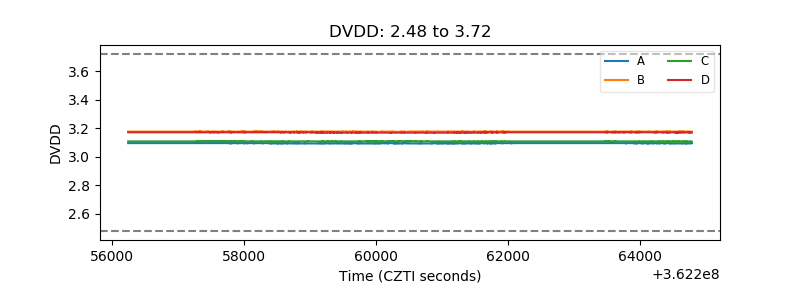 |
| Temperature 1 | 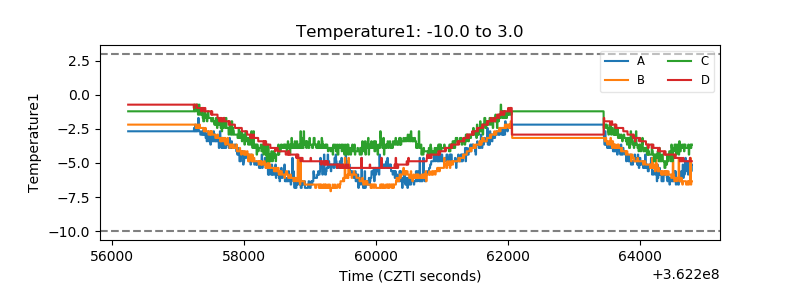 |
| Veto HV Monitor | 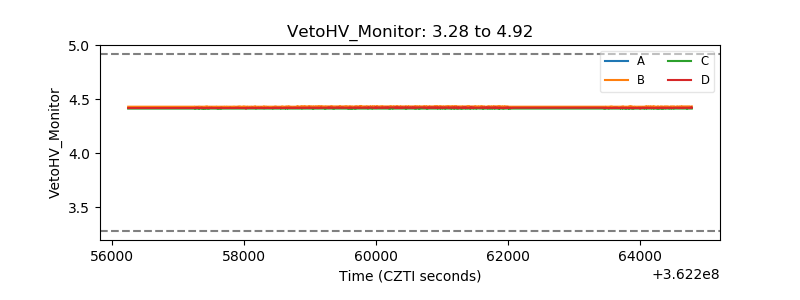 |
| Veto LLD | 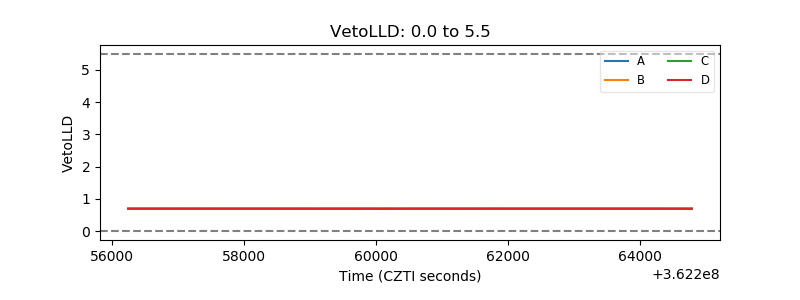 |
| Alpha Counter | 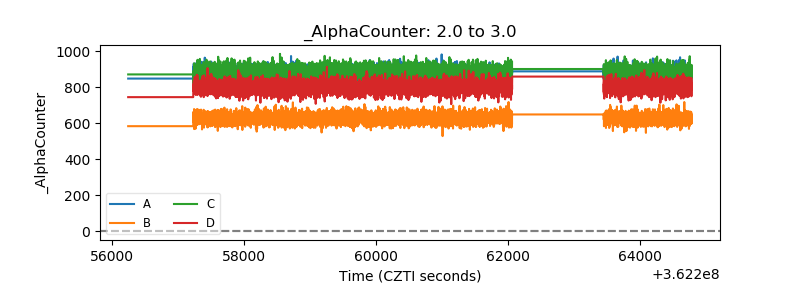 |
| _CPM_Rate | 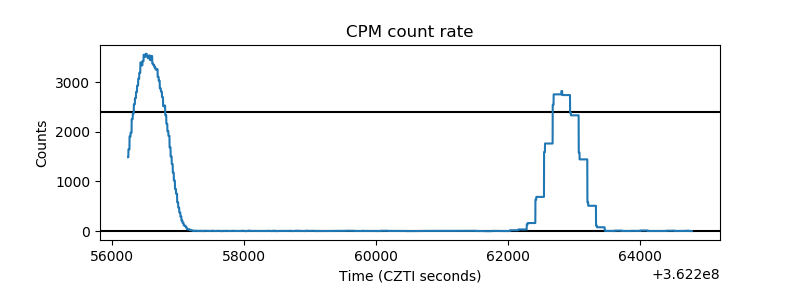 |
| CZT Counter | 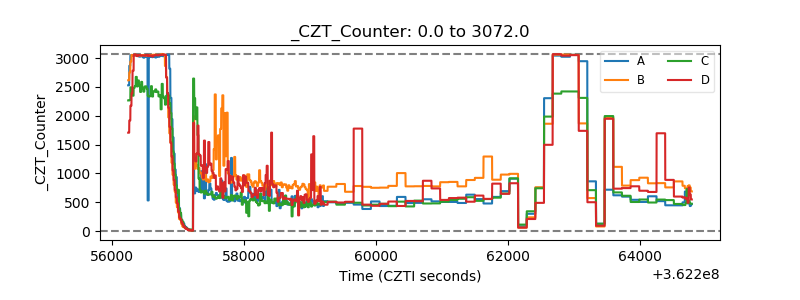 |
| +2.5 Volts monitor |  |
| +5 Volts monitor |  |
| _ROLL_ROT | 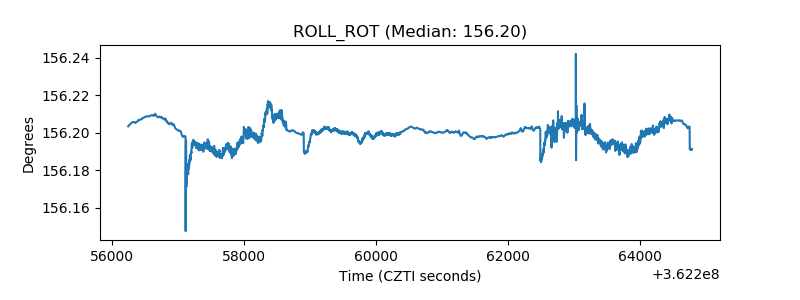 |
| _Roll_DEC | 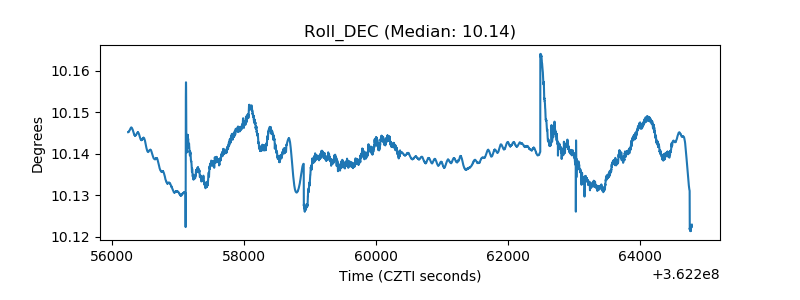 |
| _Roll_RA | 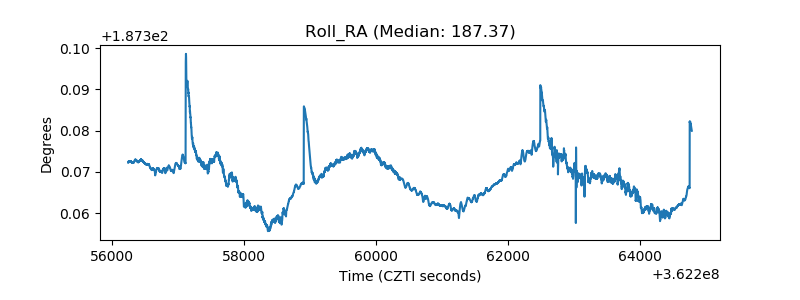 |
| Veto Counter |  |