| Param | Original file | Final file |
|---|---|---|
| Filename | modeM0/AS1A10_071T63_9000004486cztM0_level2.fits | modeM0/AS1A10_071T63_9000004486cztM0_level2_quad_clean.evt |
| Size (bytes) | 679,898,880 | 526,282,560 |
| Size | 648.4 MB | 501.9 MB |
| Events in quadrant A | 4,274,792 | 2,982,741 |
| Events in quadrant B | 3,979,994 | 2,919,715 |
| Events in quadrant C | 4,084,572 | 2,790,221 |
| Events in quadrant D | 3,576,756 | 2,570,375 |
| Mode M9 | |||
|---|---|---|---|
| Quadrant | BADHDUFLAG | Total packets | Discarded packets |
| A | 0 | 108 | 0 |
| B | 0 | 108 | 0 |
| C | 0 | 108 | 0 |
| D | 0 | 108 | 0 |
| Mode SS | |||
|---|---|---|---|
| Quadrant | BADHDUFLAG | Total packets | Discarded packets |
| A | 0 | 1392 | 0 |
| B | 0 | 1392 | 0 |
| C | 0 | 1392 | 0 |
| D | 0 | 1392 | 0 |
| Mode M0 | |||
|---|---|---|---|
| Quadrant | BADHDUFLAG | Total packets | Discarded packets |
| A | 0 | 142461 | 0 |
| B | 0 | 213834 | 0 |
| C | 0 | 146393 | 0 |
| D | 0 | 177911 | 0 |
| Quadrant | Total seconds | Saturated seconds | Saturation percentage |
|---|---|---|---|
| A | 68142 | 987 | 1.448446% |
| B | 68142 | 2189 | 3.212409% |
| C | 68142 | 1668 | 2.447830% |
| D | 68142 | 2090 | 3.067125% |
Noise dominated data is calculated using 1-second bins in cleaned event files. If a bin has >2000 counts, and if more than 50% of those come from <1% of pixels, then it is considered to be noise-dominated and hence unusable.
| Quadrant | # 1 sec bins | Bins with >0 counts | Bins with >2000 counts | High rate bins dominated by noise | Noise dominated (total time) | Noise dominated (detector-on time) | Marked lightcurve |
|---|---|---|---|---|---|---|---|
| A | 79036 | 68129 | 0 | 0 | 0.00% | 0.00% |  |
| B | 79036 | 68124 | 0 | 0 | 0.00% | 0.00% |  |
| C | 79036 | 68126 | 0 | 0 | 0.00% | 0.00% |  |
| D | 79036 | 68105 | 0 | 0 | 0.00% | 0.00% |  |
Top three noisy pixels from each quadrant. If the there are fewer than three noisy pixels in the level2.evt file, extra rows are filled as -1
| Pixel properties | Quadrant properties | ||||||
|---|---|---|---|---|---|---|---|
| Quadrant | DetID | PixID | Counts | Sigma | Mean | Median | Sigma |
| A | 0 | 29 | 4131 | 11.37 | 1112 | 1044 | 271.5 |
| A | 7 | 110 | 3360 | 8.53 | 1112 | 1044 | 271.5 |
| A | 9 | 19 | 3281 | 8.24 | 1112 | 1044 | 271.5 |
| B | 2 | 9 | 3184 | 10.45 | 1052 | 1002 | 208.8 |
| B | 5 | 255 | 2691 | 8.09 | 1052 | 1002 | 208.8 |
| B | 3 | 17 | 2687 | 8.07 | 1052 | 1002 | 208.8 |
| C | 9 | 233 | 2804 | 6.5 | 1081 | 1009 | 275.9 |
| C | 3 | 126 | 2783 | 6.43 | 1081 | 1009 | 275.9 |
| C | 9 | 209 | 2780 | 6.42 | 1081 | 1009 | 275.9 |
| D | 15 | 46 | 2697 | 6.44 | 1022 | 928 | 274.4 |
| D | 3 | 14 | 2599 | 6.09 | 1022 | 928 | 274.4 |
| D | 10 | 189 | 2524 | 5.81 | 1022 | 928 | 274.4 |
Histogram calculated using DETX and DETY for each event in the final _common_clean file
| Quadrant A | 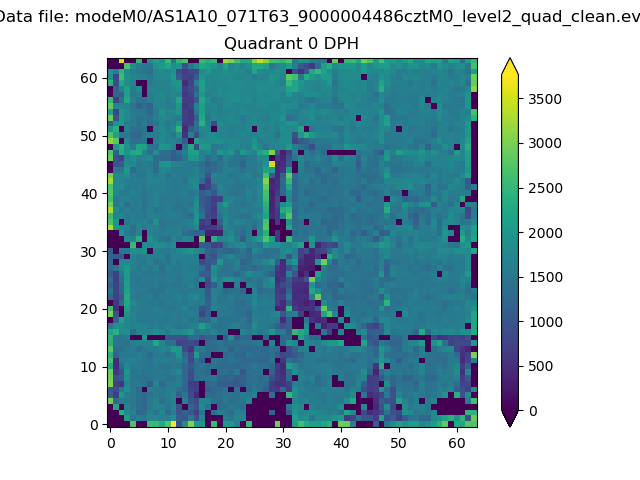 |
 |
Quadrant B |
|---|---|---|---|
| Quadrant D |  |
 |
Quadrant C |
| Plot type | Count rate plots | Images |
|---|---|---|
| Comparison with Poisson distribution Blue bars denote a histogram of data divided into 1 sec bins. Red curve is a Poisson curve with rate = median count rate of data. |
 |
 |
| Quadrant-wise count rates Data is divided into 100 sec bins |
 |
|
| Module-wise count rates for Quadrant A Data is divided into 100 sec bins |
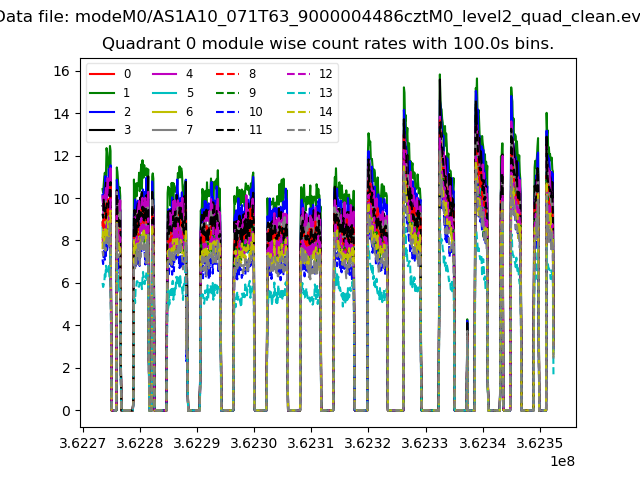 |
 |
| Module-wise count rates for Quadrant B Data is divided into 100 sec bins |
 |
 |
| Module-wise count rates for Quadrant C Data is divided into 100 sec bins |
 |
 |
| Module-wise count rates for Quadrant D Data is divided into 100 sec bins |
 |
 |
| Parameter | Plot |
|---|---|
| CZT HV Monitor |  |
| D_VDD |  |
| Temperature 1 |  |
| Veto HV Monitor |  |
| Veto LLD |  |
| Alpha Counter |  |
| _CPM_Rate |  |
| CZT Counter |  |
| +2.5 Volts monitor |  |
| +5 Volts monitor |  |
| _ROLL_ROT |  |
| _Roll_DEC |  |
| _Roll_RA |  |
| Veto Counter |  |