| Param | Original file | Final file |
|---|---|---|
| Filename | modeM0/AS1A10_071T63_9000004486_31037cztM0_level2.evt | modeM0/AS1A10_071T63_9000004486_31037cztM0_level2_quad_clean.evt |
| Size (bytes) | 254,960,640 | 48,787,200 |
| Size | 243.1 MB | 46.5 MB |
| Events in quadrant A | 1,525,361 | 325,425 |
| Events in quadrant B | 2,444,385 | 324,071 |
| Events in quadrant C | 1,662,564 | 309,846 |
| Events in quadrant D | 1,885,283 | 305,235 |
| Mode M9 | |||
|---|---|---|---|
| Quadrant | BADHDUFLAG | Total packets | Discarded packets |
| A | 0 | 9 | 0 |
| B | 0 | 9 | 0 |
| C | 0 | 9 | 0 |
| D | 0 | 9 | 0 |
| Mode SS | |||
|---|---|---|---|
| Quadrant | BADHDUFLAG | Total packets | Discarded packets |
| A | 0 | 64 | 0 |
| B | 0 | 64 | 0 |
| C | 0 | 64 | 0 |
| D | 0 | 64 | 0 |
| Mode M0 | |||
|---|---|---|---|
| Quadrant | BADHDUFLAG | Total packets | Discarded packets |
| A | 0 | 6261 | 1 |
| B | 0 | 9296 | 1 |
| C | 0 | 6729 | 1 |
| D | 0 | 7749 | 1 |
| Quadrant | Total seconds | Saturated seconds | Saturation percentage |
|---|---|---|---|
| A | 2973 | 26 | 0.874538% |
| B | 2973 | 95 | 3.195425% |
| C | 2973 | 76 | 2.556340% |
| D | 2973 | 11 | 0.369997% |
Noise dominated data is calculated using 1-second bins in cleaned event files. If a bin has >2000 counts, and if more than 50% of those come from <1% of pixels, then it is considered to be noise-dominated and hence unusable.
| Quadrant | # 1 sec bins | Bins with >0 counts | Bins with >2000 counts | High rate bins dominated by noise | Noise dominated (total time) | Noise dominated (detector-on time) | Marked lightcurve |
|---|---|---|---|---|---|---|---|
| A | 3938 | 2973 | 0 | 0 | 0.00% | 0.00% | 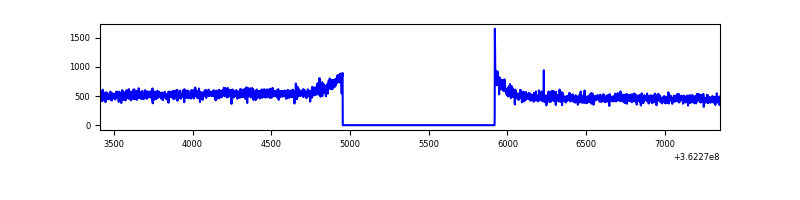 |
| B | 3938 | 2973 | 11 | 11 | 0.28% | 0.37% | 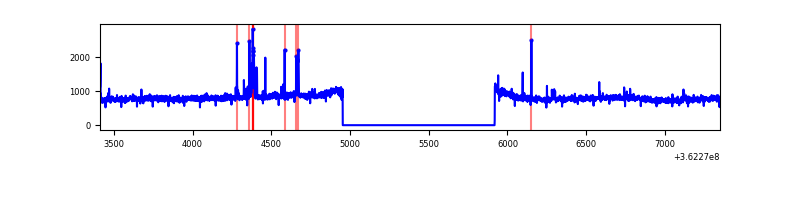 |
| C | 3938 | 2973 | 5 | 5 | 0.13% | 0.17% | 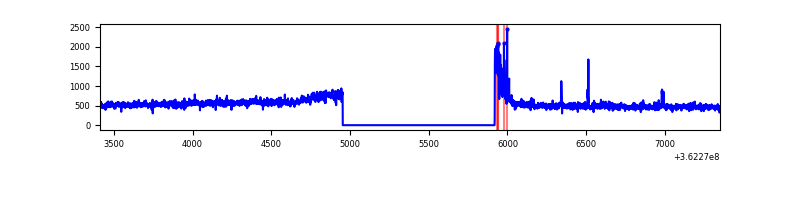 |
| D | 3938 | 2974 | 1 | 1 | 0.03% | 0.03% | 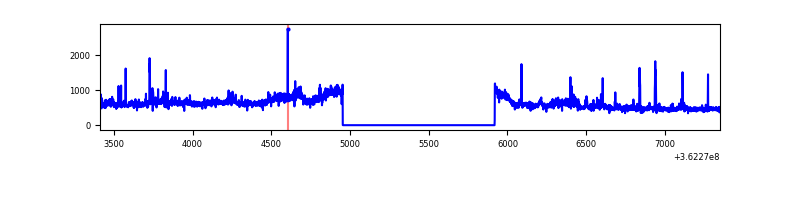 |
Top three noisy pixels from each quadrant. If the there are fewer than three noisy pixels in the level2.evt file, extra rows are filled as -1
| Pixel properties | Quadrant properties | ||||||
|---|---|---|---|---|---|---|---|
| Quadrant | DetID | PixID | Counts | Sigma | Mean | Median | Sigma |
| A | 13 | 254 | 6230 | 72.09 | 394 | 385 | 81.1 |
| A | 3 | 137 | 4154 | 46.49 | 394 | 385 | 81.1 |
| A | 0 | 226 | 3311 | 36.09 | 394 | 385 | 81.1 |
| B | 6 | 159 | 803484 | 10421.22 | 388 | 378 | 77.1 |
| B | 4 | 171 | 37184 | 477.6 | 388 | 378 | 77.1 |
| B | 0 | 190 | 17586 | 223.29 | 388 | 378 | 77.1 |
| C | 0 | 10 | 62765 | 702.46 | 373 | 375 | 88.8 |
| C | 14 | 238 | 60286 | 674.55 | 373 | 375 | 88.8 |
| C | 3 | 233 | 58910 | 659.06 | 373 | 375 | 88.8 |
| D | 8 | 195 | 356876 | 3765.94 | 379 | 370 | 94.7 |
| D | 13 | 174 | 59300 | 622.5 | 379 | 370 | 94.7 |
| D | 2 | 250 | 13876 | 142.67 | 379 | 370 | 94.7 |
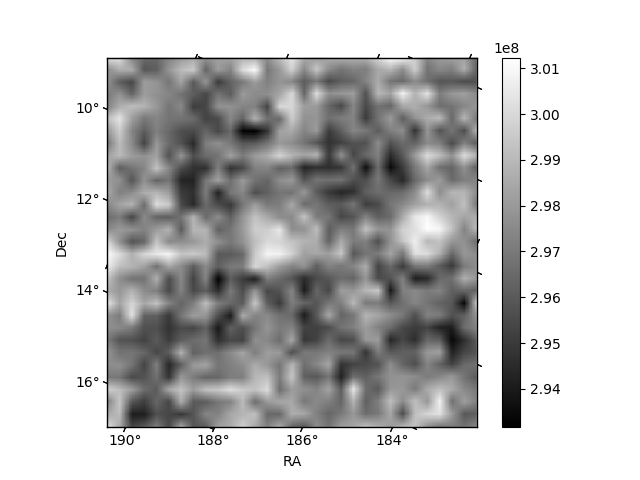
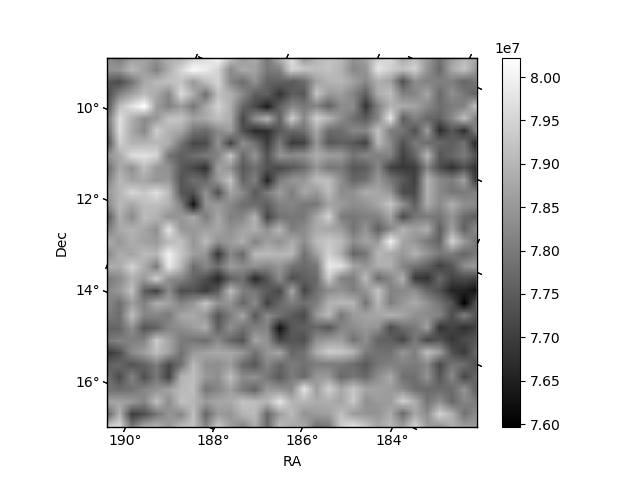
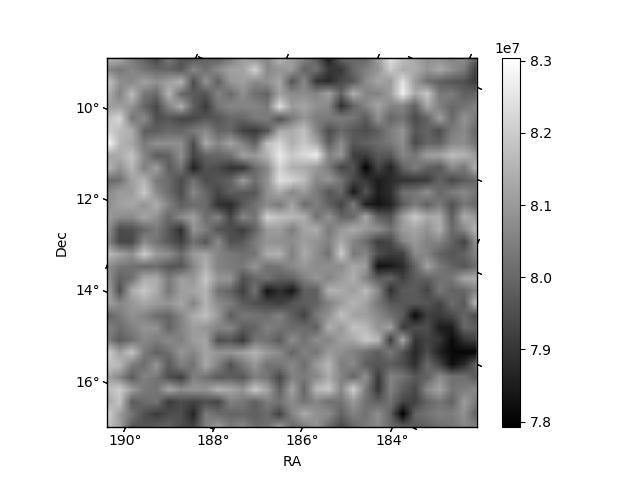
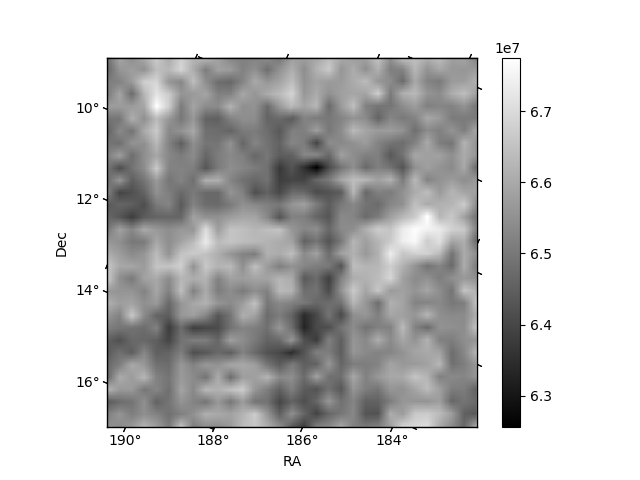
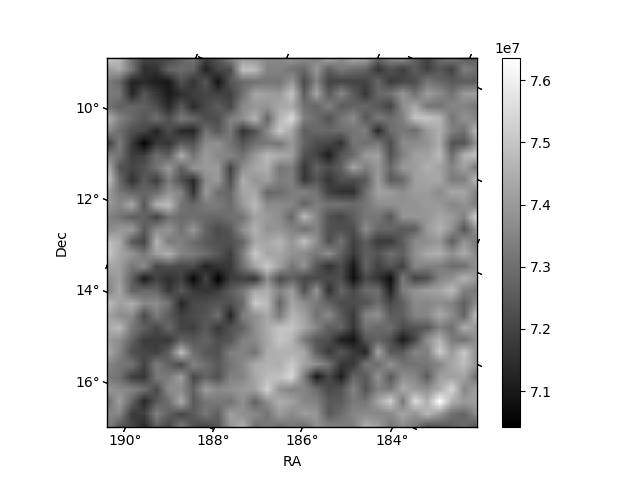
Histogram calculated using DETX and DETY for each event in the final _common_clean file
| Quadrant A | 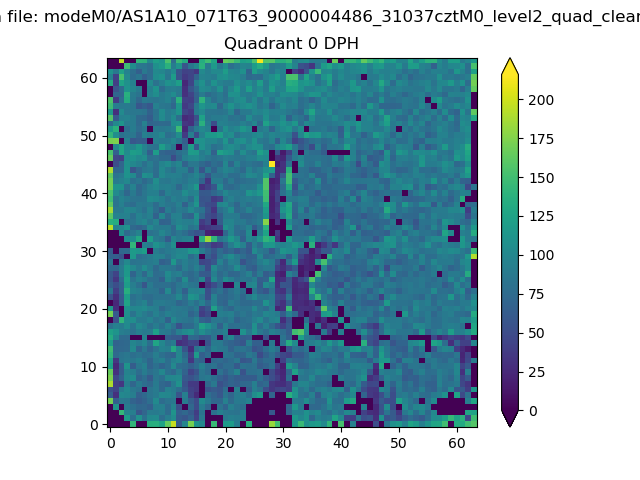 |
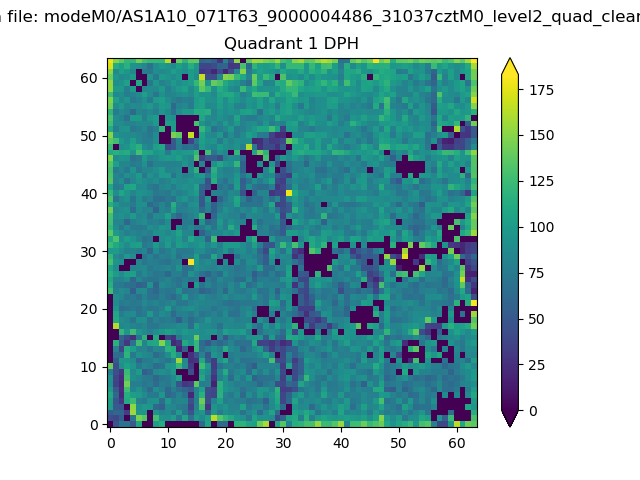 |
Quadrant B |
|---|---|---|---|
| Quadrant D | 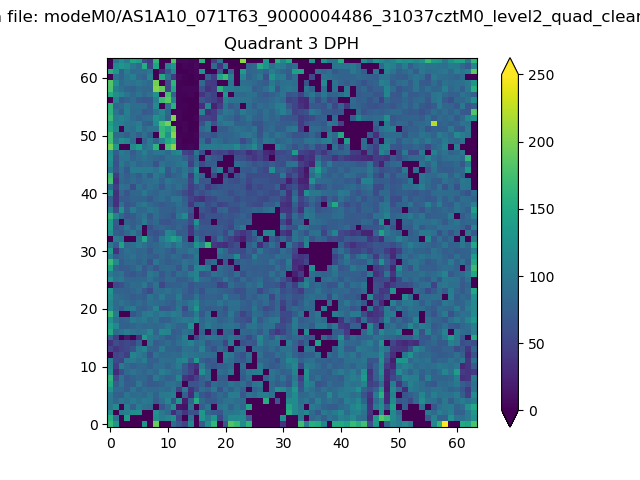 |
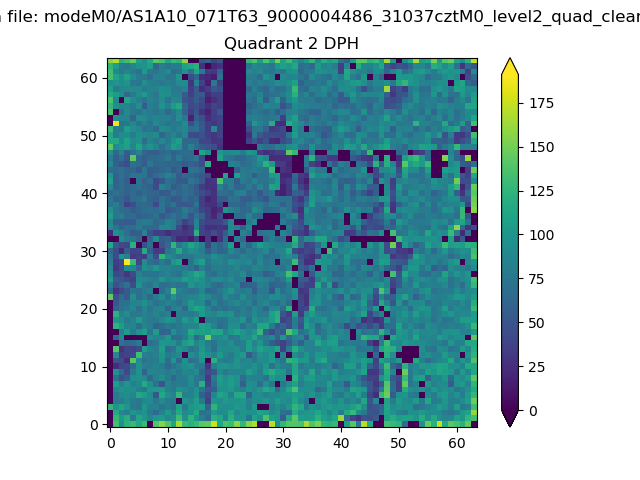 |
Quadrant C |
| Plot type | Count rate plots | Images |
|---|---|---|
| Comparison with Poisson distribution Blue bars denote a histogram of data divided into 1 sec bins. Red curve is a Poisson curve with rate = median count rate of data. |
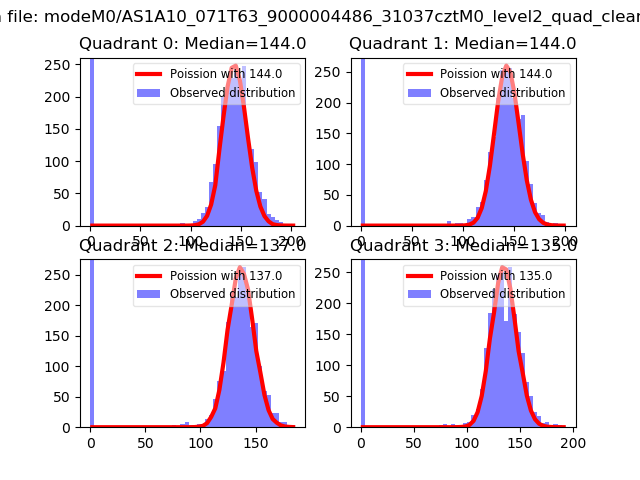 |
 |
| Quadrant-wise count rates Data is divided into 100 sec bins |
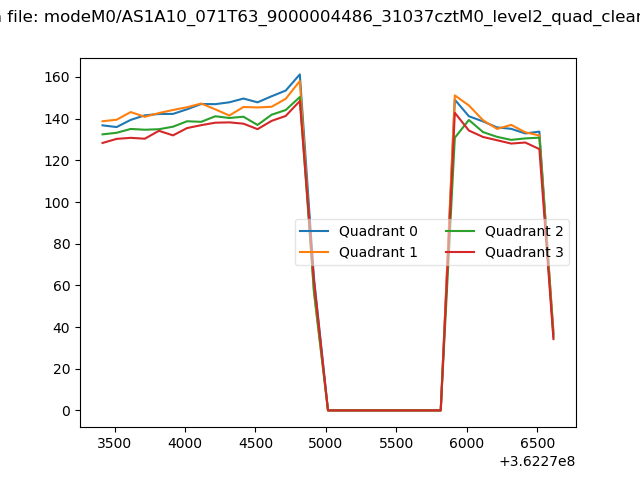 |
|
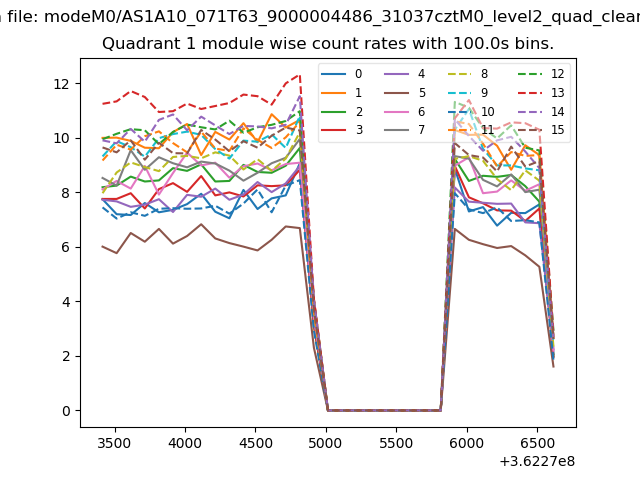
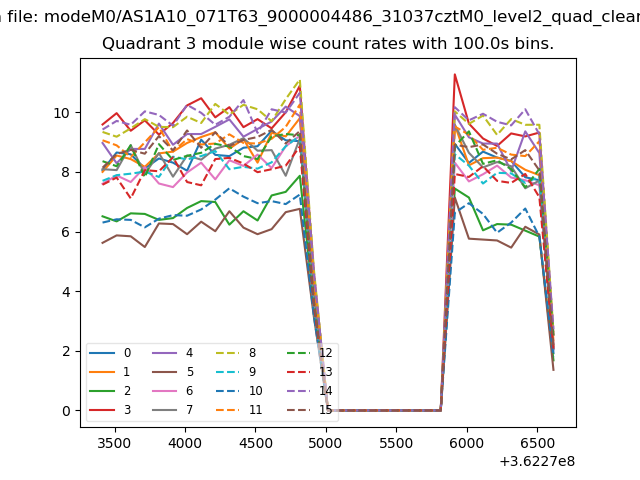
| Module-wise count rates for Quadrant A Data is divided into 100 sec bins |
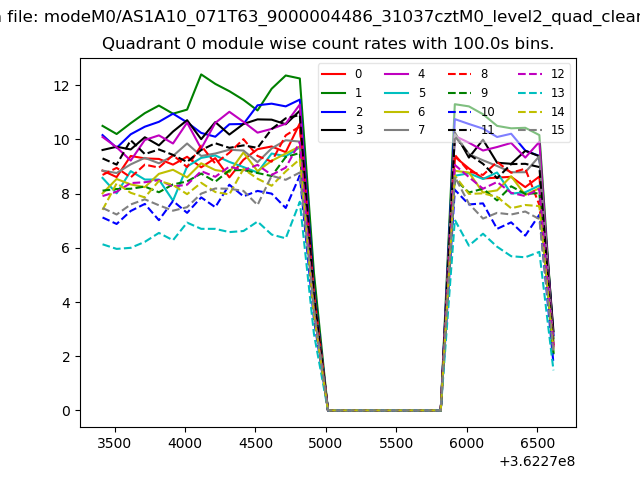 |
 |
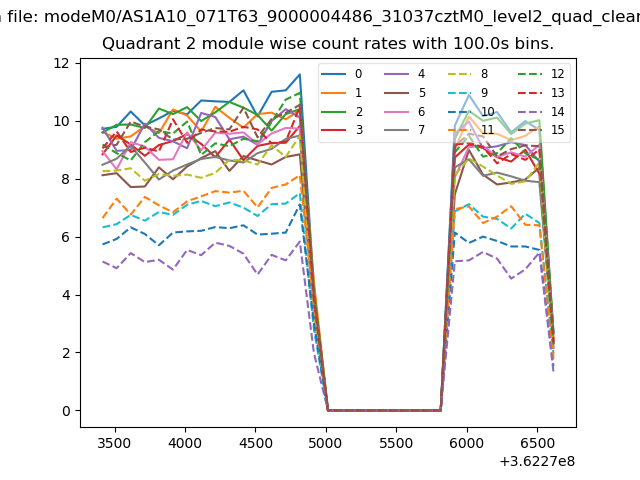
| Module-wise count rates for Quadrant B Data is divided into 100 sec bins |
 |
 |
| Module-wise count rates for Quadrant C Data is divided into 100 sec bins |
 |
 |
| Module-wise count rates for Quadrant D Data is divided into 100 sec bins |
 |
 |
| Parameter | Plot |
|---|---|
| CZT HV Monitor | 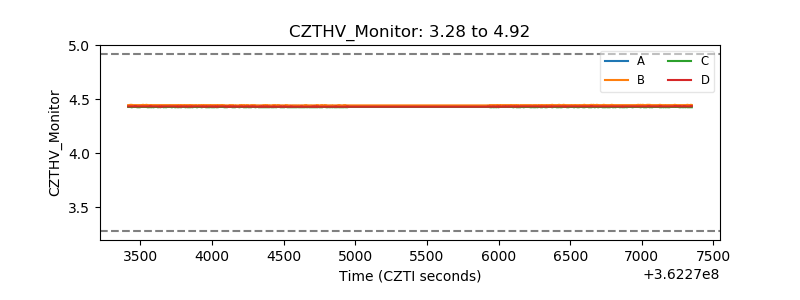 |
| D_VDD | 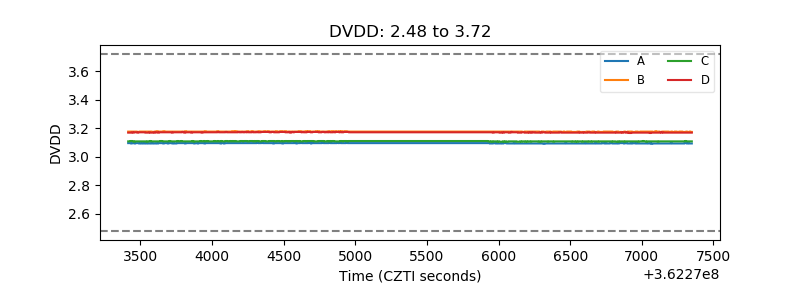 |
| Temperature 1 | 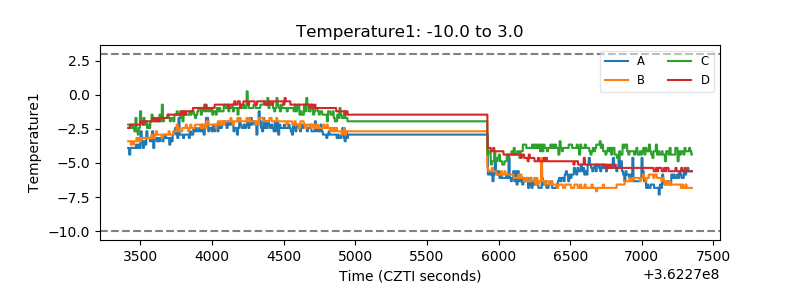 |
| Veto HV Monitor | 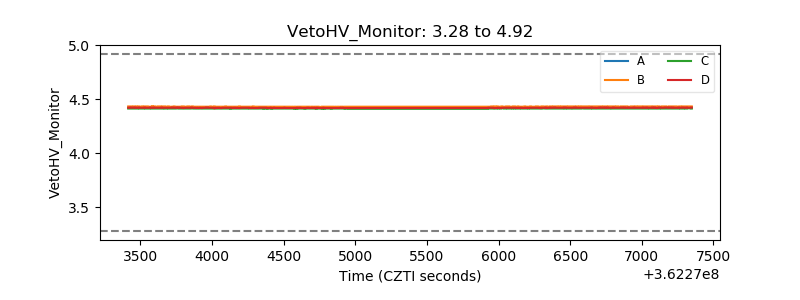 |
| Veto LLD | 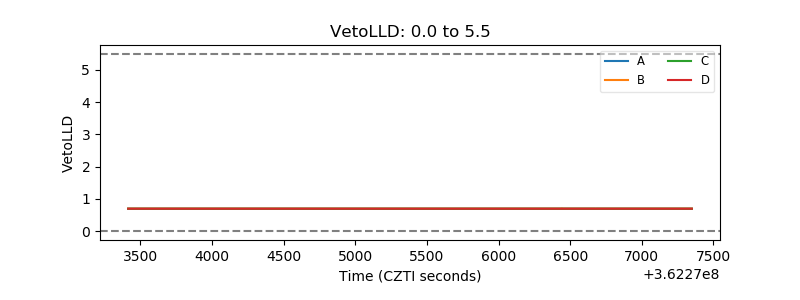 |
| Alpha Counter | 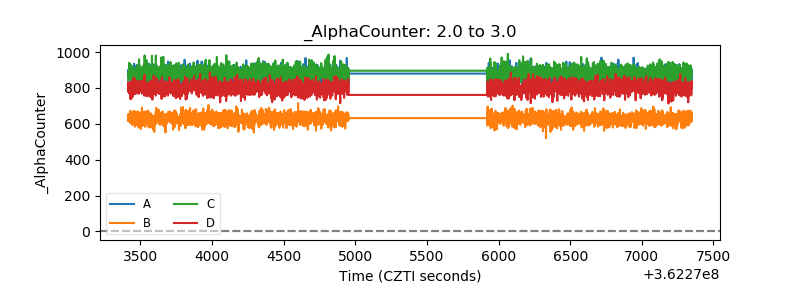 |
| _CPM_Rate | 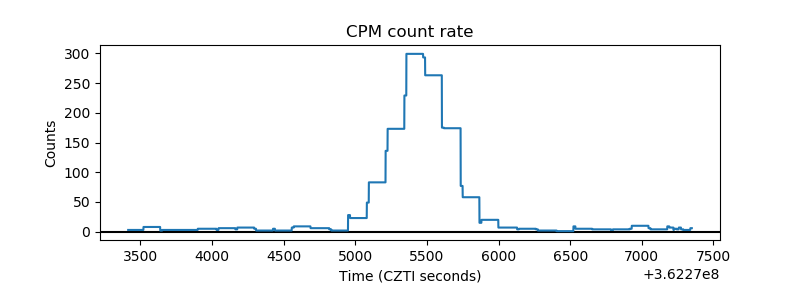 |
| CZT Counter | 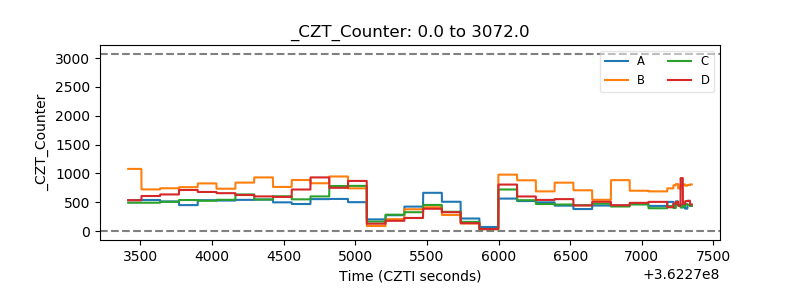 |
| +2.5 Volts monitor | 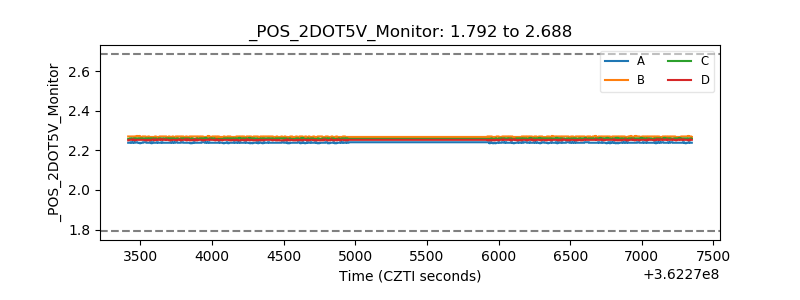 |
| +5 Volts monitor |  |
| _ROLL_ROT |  |
| _Roll_DEC |  |
| _Roll_RA | 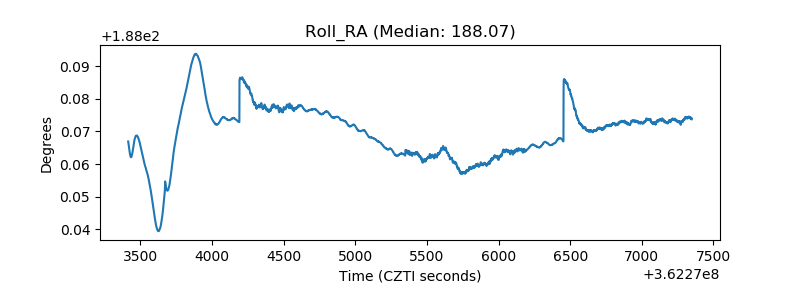 |
| Veto Counter | 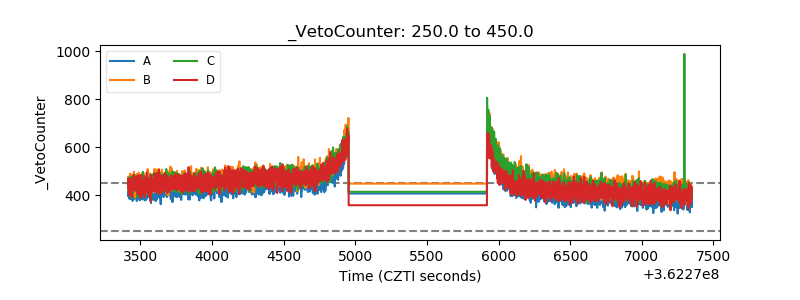 |