| Param | Original file | Final file |
|---|---|---|
| Filename | modeM0/AS1A10_071T63_9000004486_31038cztM0_level2.evt | modeM0/AS1A10_071T63_9000004486_31038cztM0_level2_quad_clean.evt |
| Size (bytes) | 533,136,960 | 75,539,520 |
| Size | 508.4 MB | 72.0 MB |
| Events in quadrant A | 3,219,089 | 468,364 |
| Events in quadrant B | 5,352,217 | 465,693 |
| Events in quadrant C | 3,382,307 | 446,129 |
| Events in quadrant D | 3,733,454 | 435,053 |
| Mode M9 | |||
|---|---|---|---|
| Quadrant | BADHDUFLAG | Total packets | Discarded packets |
| A | 0 | 5 | 0 |
| B | 0 | 5 | 0 |
| C | 0 | 5 | 0 |
| D | 0 | 5 | 0 |
| Mode SS | |||
|---|---|---|---|
| Quadrant | BADHDUFLAG | Total packets | Discarded packets |
| A | 0 | 140 | 0 |
| B | 0 | 140 | 0 |
| C | 0 | 140 | 0 |
| D | 0 | 140 | 0 |
| Mode M0 | |||
|---|---|---|---|
| Quadrant | BADHDUFLAG | Total packets | Discarded packets |
| A | 0 | 13798 | 2 |
| B | 0 | 20775 | 1 |
| C | 0 | 14057 | 1 |
| D | 0 | 15411 | 1 |
| Quadrant | Total seconds | Saturated seconds | Saturation percentage |
|---|---|---|---|
| A | 6764 | 18 | 0.266115% |
| B | 6765 | 77 | 1.138211% |
| C | 6765 | 62 | 0.916482% |
| D | 6765 | 55 | 0.813008% |
Noise dominated data is calculated using 1-second bins in cleaned event files. If a bin has >2000 counts, and if more than 50% of those come from <1% of pixels, then it is considered to be noise-dominated and hence unusable.
| Quadrant | # 1 sec bins | Bins with >0 counts | Bins with >2000 counts | High rate bins dominated by noise | Noise dominated (total time) | Noise dominated (detector-on time) | Marked lightcurve |
|---|---|---|---|---|---|---|---|
| A | 7334 | 6765 | 0 | 0 | 0.00% | 0.00% | 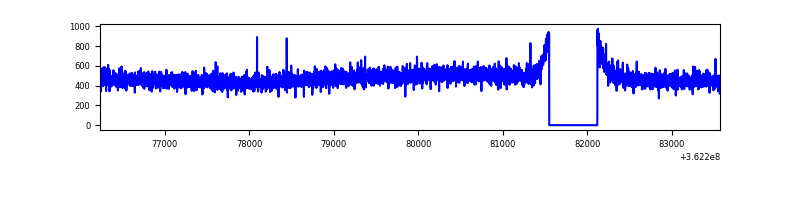 |
| B | 7335 | 6765 | 6 | 6 | 0.08% | 0.09% | 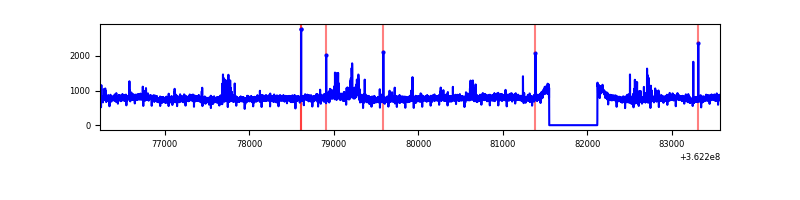 |
| C | 7335 | 6766 | 0 | 0 | 0.00% | 0.00% | 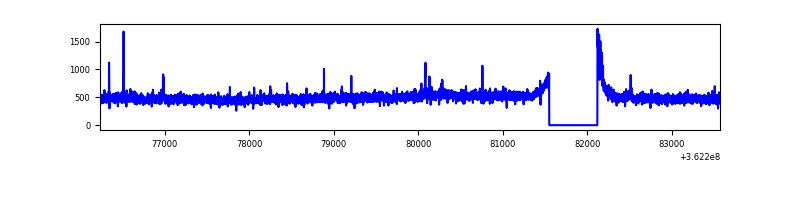 |
| D | 7335 | 6765 | 54 | 54 | 0.74% | 0.80% | 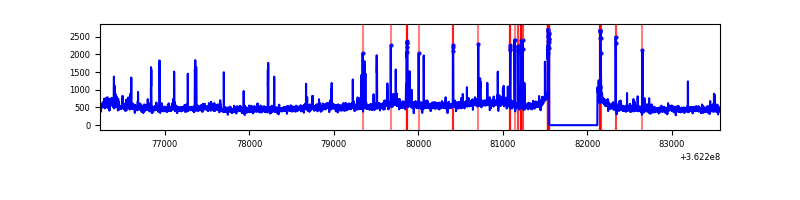 |
Top three noisy pixels from each quadrant. If the there are fewer than three noisy pixels in the level2.evt file, extra rows are filled as -1
| Pixel properties | Quadrant properties | ||||||
|---|---|---|---|---|---|---|---|
| Quadrant | DetID | PixID | Counts | Sigma | Mean | Median | Sigma |
| A | 13 | 254 | 13091 | 73.01 | 834 | 817 | 168.1 |
| A | 3 | 137 | 8759 | 47.24 | 834 | 817 | 168.1 |
| A | 0 | 226 | 7075 | 37.23 | 834 | 817 | 168.1 |
| B | 6 | 159 | 1881150 | 11619.27 | 828 | 807 | 161.8 |
| B | 0 | 190 | 128948 | 791.83 | 828 | 807 | 161.8 |
| B | 0 | 230 | 22828 | 136.08 | 828 | 807 | 161.8 |
| C | 14 | 238 | 129822 | 677.64 | 798 | 803 | 190.4 |
| C | 3 | 233 | 68333 | 354.68 | 798 | 803 | 190.4 |
| C | 0 | 10 | 35533 | 182.41 | 798 | 803 | 190.4 |
| D | 8 | 195 | 540268 | 2797.49 | 796 | 777 | 192.8 |
| D | 12 | 0 | 57141 | 292.27 | 796 | 777 | 192.8 |
| D | 2 | 250 | 56431 | 288.59 | 796 | 777 | 192.8 |
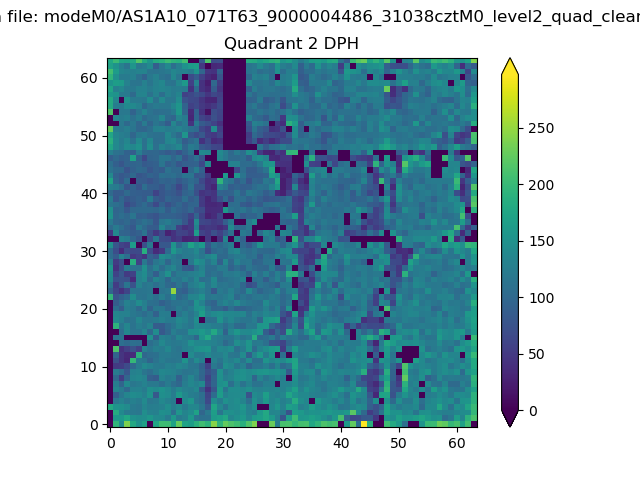
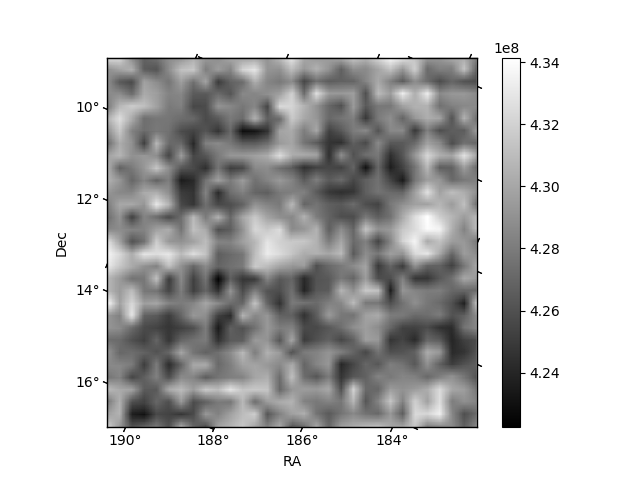
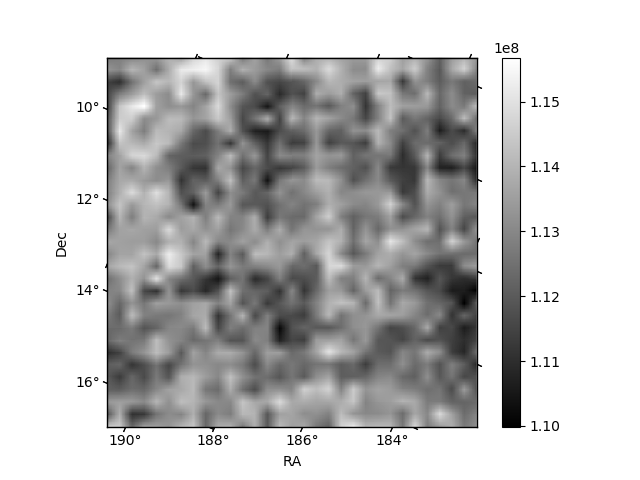
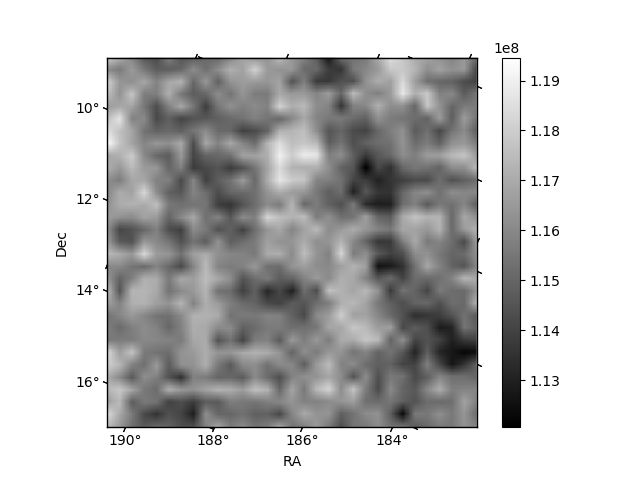
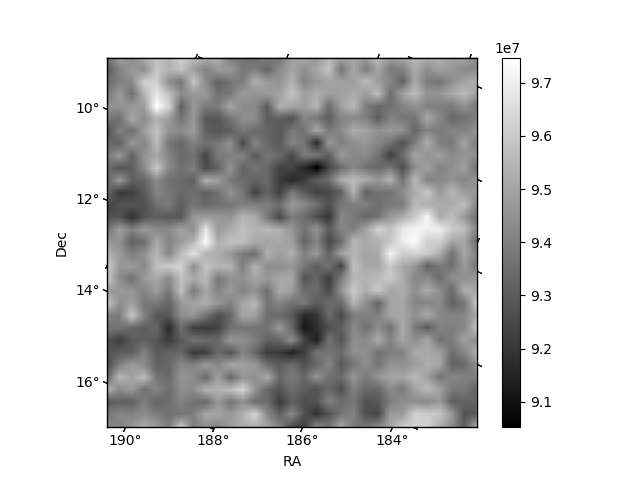
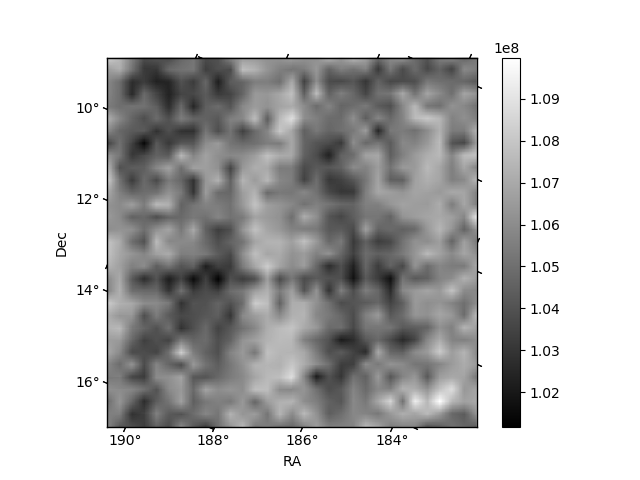
Histogram calculated using DETX and DETY for each event in the final _common_clean file
| Quadrant A | 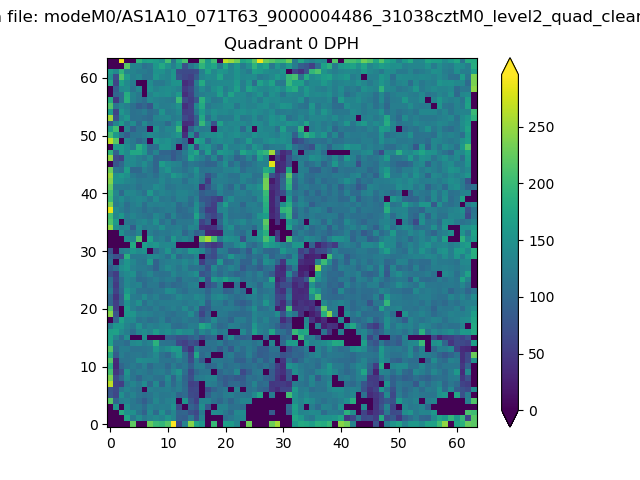 |
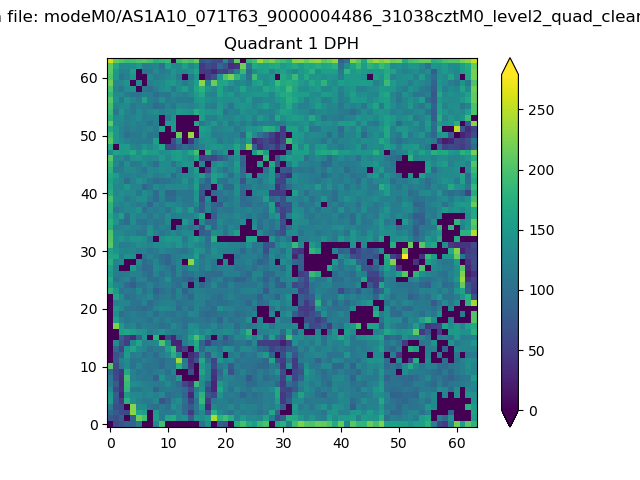 |
Quadrant B |
|---|---|---|---|
| Quadrant D | 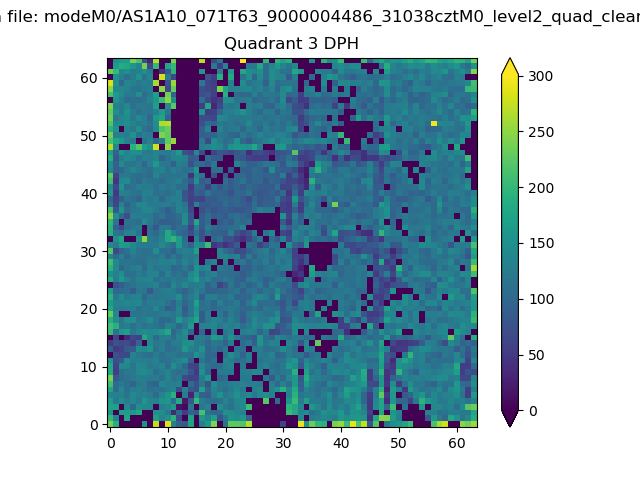 |
 |
Quadrant C |
| Plot type | Count rate plots | Images |
|---|---|---|
| Comparison with Poisson distribution Blue bars denote a histogram of data divided into 1 sec bins. Red curve is a Poisson curve with rate = median count rate of data. |
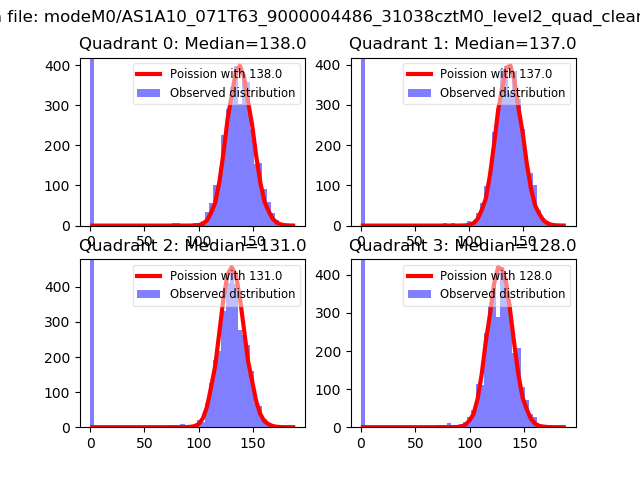 |
 |
| Quadrant-wise count rates Data is divided into 100 sec bins |
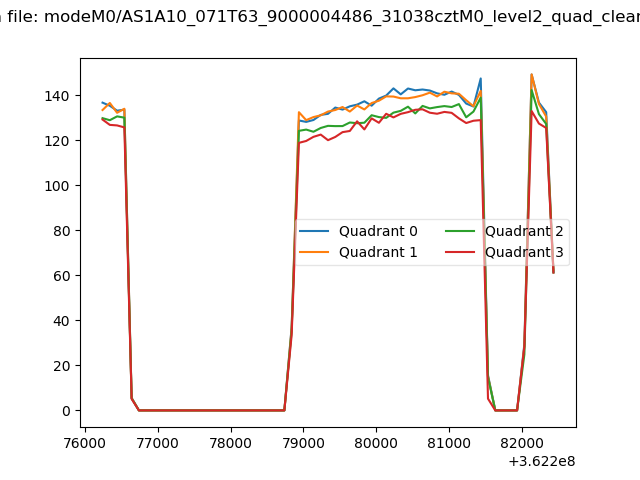 |
|
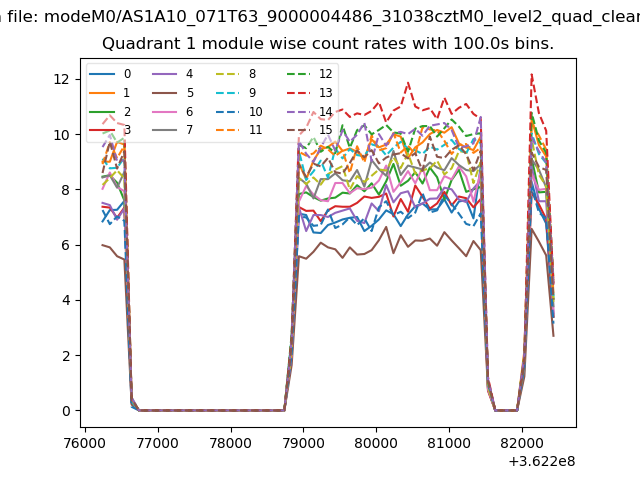
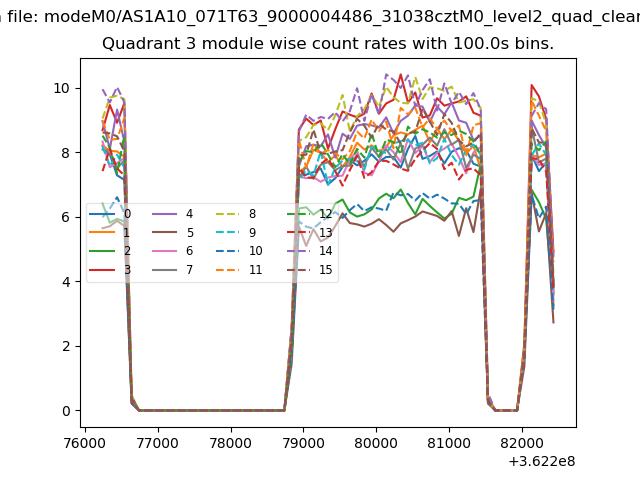
| Module-wise count rates for Quadrant A Data is divided into 100 sec bins |
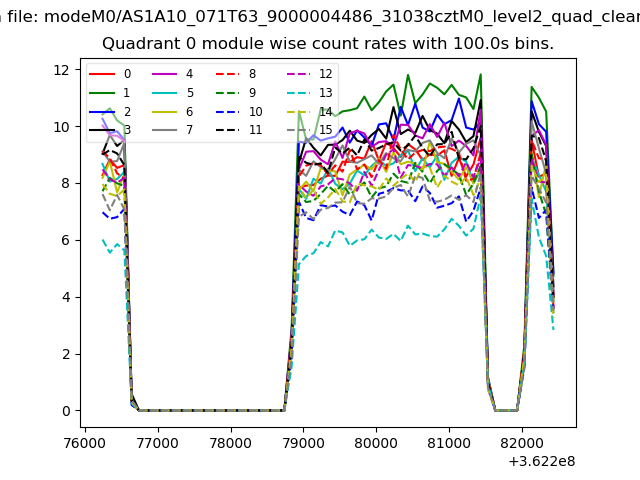 |
 |
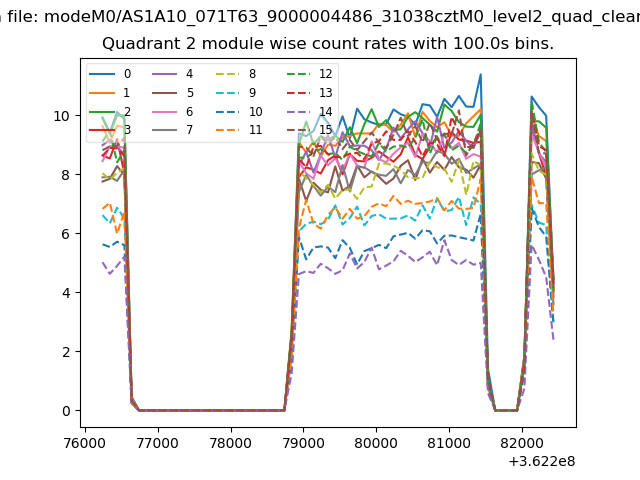
| Module-wise count rates for Quadrant B Data is divided into 100 sec bins |
 |
 |
| Module-wise count rates for Quadrant C Data is divided into 100 sec bins |
 |
 |
| Module-wise count rates for Quadrant D Data is divided into 100 sec bins |
 |
 |
| Parameter | Plot |
|---|---|
| CZT HV Monitor | 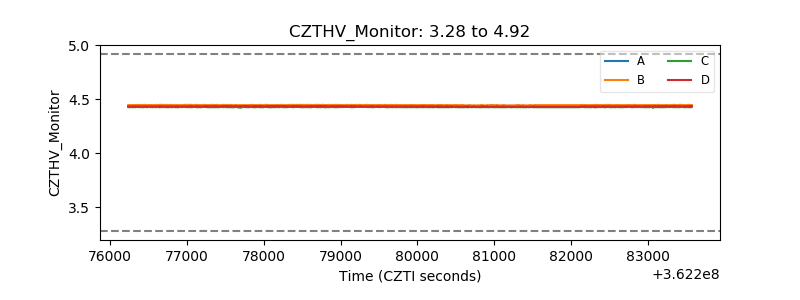 |
| D_VDD | 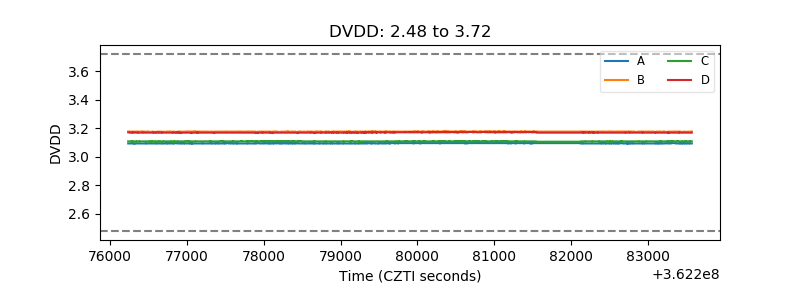 |
| Temperature 1 | 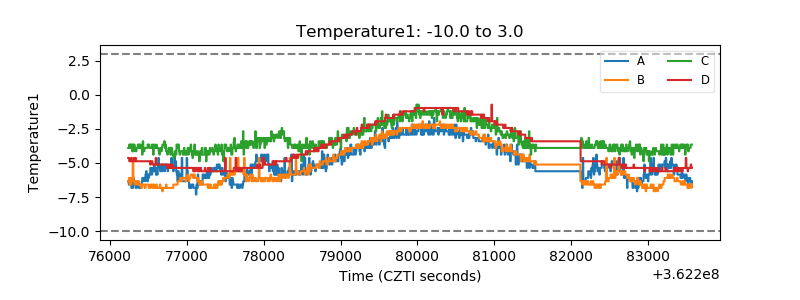 |
| Veto HV Monitor | 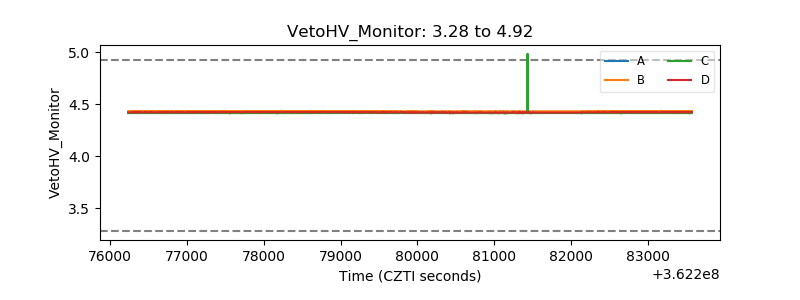 |
| Veto LLD | 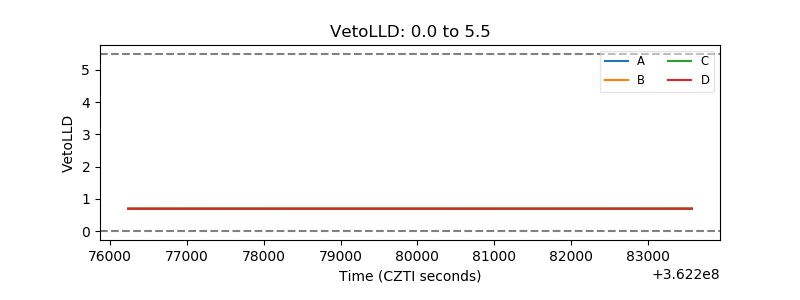 |
| Alpha Counter | 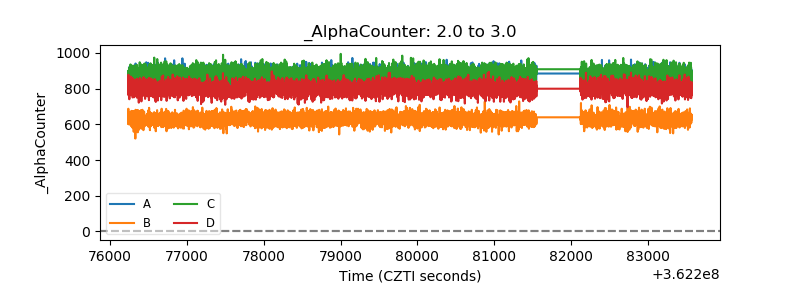 |
| _CPM_Rate | 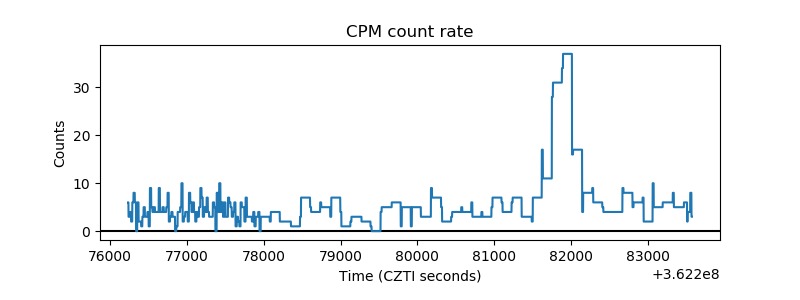 |
| CZT Counter | 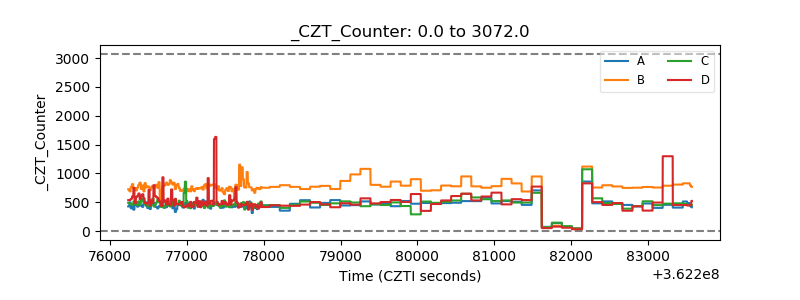 |
| +2.5 Volts monitor | 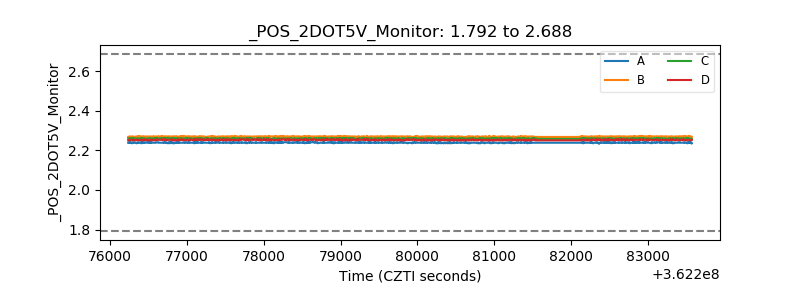 |
| +5 Volts monitor |  |
| _ROLL_ROT | 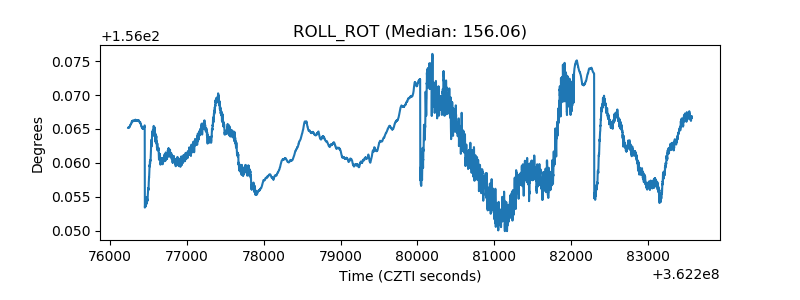 |
| _Roll_DEC | 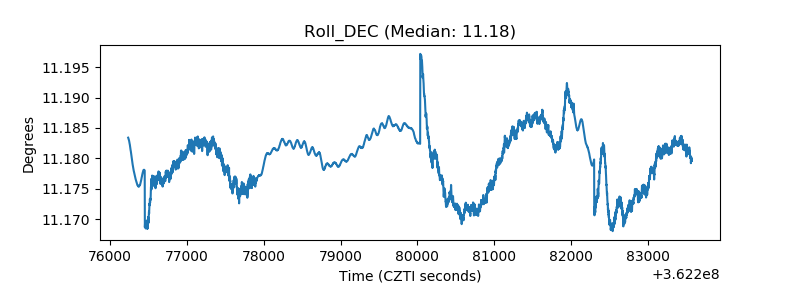 |
| _Roll_RA | 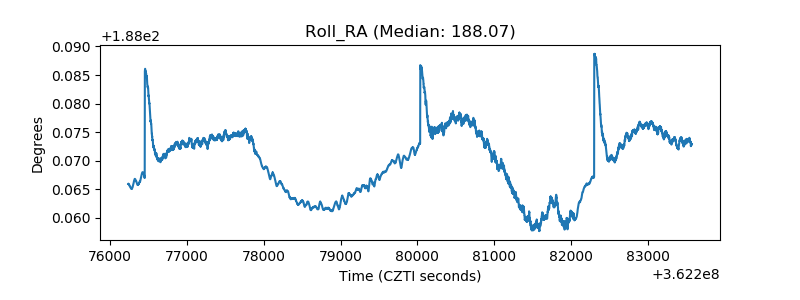 |
| Veto Counter | 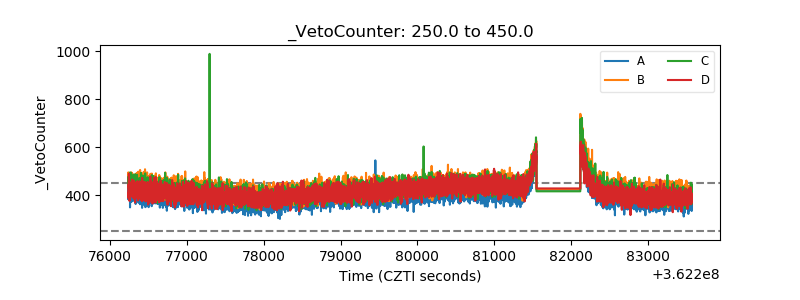 |