| Param | Original file | Final file |
|---|---|---|
| Filename | modeM0/AS1A10_071T63_9000004486_31040cztM0_level2.evt | modeM0/AS1A10_071T63_9000004486_31040cztM0_level2_quad_clean.evt |
| Size (bytes) | 621,385,920 | 78,085,440 |
| Size | 592.6 MB | 74.5 MB |
| Events in quadrant A | 3,768,624 | 470,265 |
| Events in quadrant B | 6,104,597 | 466,516 |
| Events in quadrant C | 3,906,618 | 451,162 |
| Events in quadrant D | 4,517,789 | 441,279 |
| Mode M9 | |||
|---|---|---|---|
| Quadrant | BADHDUFLAG | Total packets | Discarded packets |
| A | 0 | 2 | 0 |
| B | 0 | 2 | 0 |
| C | 0 | 2 | 0 |
| D | 0 | 2 | 0 |
| Mode SS | |||
|---|---|---|---|
| Quadrant | BADHDUFLAG | Total packets | Discarded packets |
| A | 0 | 156 | 0 |
| B | 0 | 156 | 0 |
| C | 0 | 156 | 0 |
| D | 0 | 156 | 0 |
| Mode M0 | |||
|---|---|---|---|
| Quadrant | BADHDUFLAG | Total packets | Discarded packets |
| A | 0 | 16055 | 2 |
| B | 0 | 23771 | 2 |
| C | 0 | 16164 | 2 |
| D | 0 | 18115 | 2 |
| Quadrant | Total seconds | Saturated seconds | Saturation percentage |
|---|---|---|---|
| A | 7693 | 245 | 3.184713% |
| B | 7693 | 374 | 4.861562% |
| C | 7693 | 278 | 3.613675% |
| D | 7693 | 203 | 2.638763% |
Noise dominated data is calculated using 1-second bins in cleaned event files. If a bin has >2000 counts, and if more than 50% of those come from <1% of pixels, then it is considered to be noise-dominated and hence unusable.
| Quadrant | # 1 sec bins | Bins with >0 counts | Bins with >2000 counts | High rate bins dominated by noise | Noise dominated (total time) | Noise dominated (detector-on time) | Marked lightcurve |
|---|---|---|---|---|---|---|---|
| A | 7853 | 7693 | 4 | 4 | 0.05% | 0.05% | 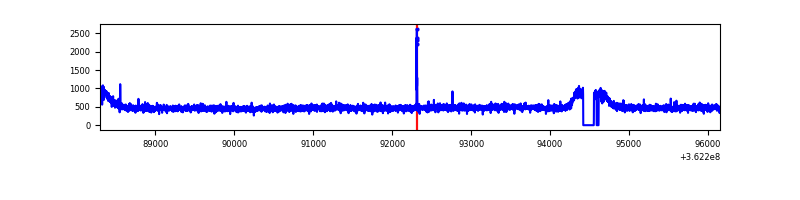 |
| B | 7853 | 7693 | 4 | 4 | 0.05% | 0.05% | 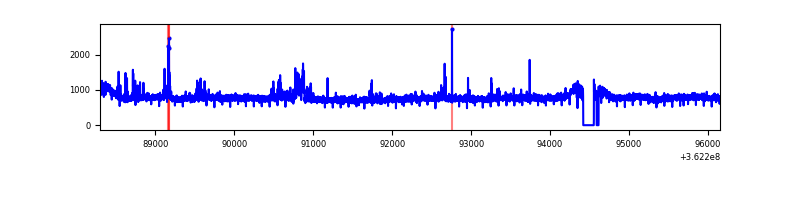 |
| C | 7853 | 7693 | 0 | 0 | 0.00% | 0.00% | 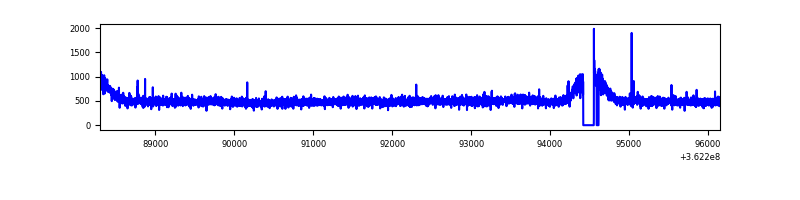 |
| D | 7853 | 7693 | 22 | 22 | 0.28% | 0.29% | 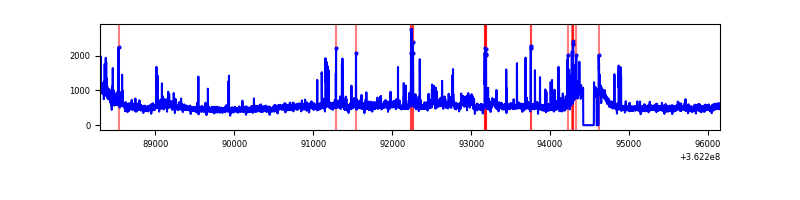 |
Top three noisy pixels from each quadrant. If the there are fewer than three noisy pixels in the level2.evt file, extra rows are filled as -1
| Pixel properties | Quadrant properties | ||||||
|---|---|---|---|---|---|---|---|
| Quadrant | DetID | PixID | Counts | Sigma | Mean | Median | Sigma |
| A | 13 | 254 | 14020 | 66.0 | 973 | 950 | 198.0 |
| A | 6 | 10 | 12513 | 58.39 | 973 | 950 | 198.0 |
| A | 3 | 137 | 10462 | 48.03 | 973 | 950 | 198.0 |
| B | 6 | 159 | 2124500 | 11221.15 | 955 | 928 | 189.2 |
| B | 0 | 190 | 117728 | 617.18 | 955 | 928 | 189.2 |
| B | 4 | 80 | 32825 | 168.55 | 955 | 928 | 189.2 |
| C | 14 | 238 | 148561 | 664.02 | 929 | 932 | 222.3 |
| C | 3 | 233 | 72744 | 323.0 | 929 | 932 | 222.3 |
| C | 2 | 114 | 18017 | 76.85 | 929 | 932 | 222.3 |
| D | 8 | 195 | 723892 | 3223.54 | 935 | 907 | 224.3 |
| D | 2 | 250 | 134843 | 597.17 | 935 | 907 | 224.3 |
| D | 12 | 218 | 54533 | 239.1 | 935 | 907 | 224.3 |
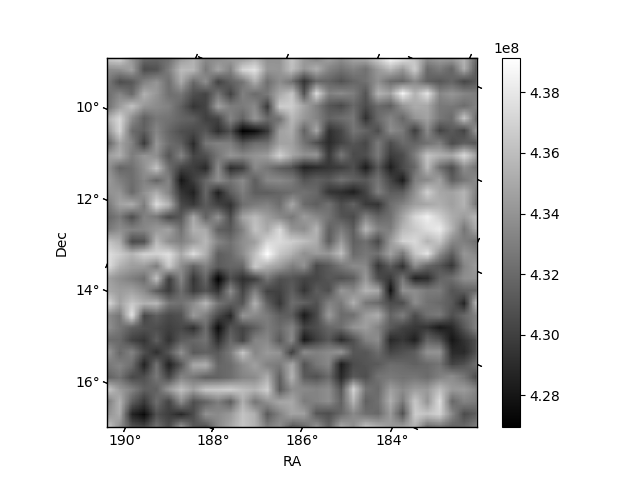
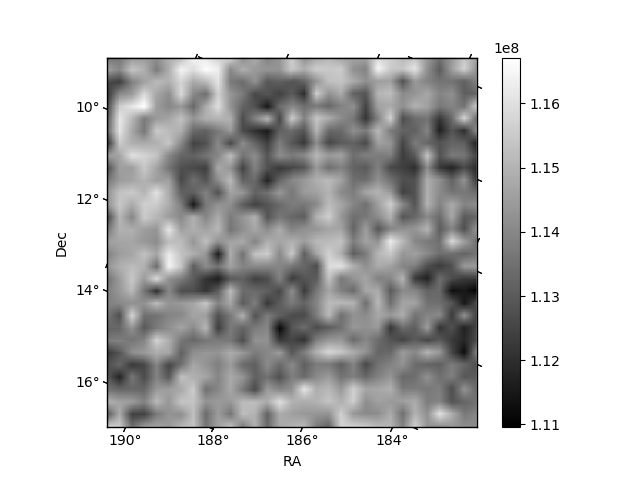
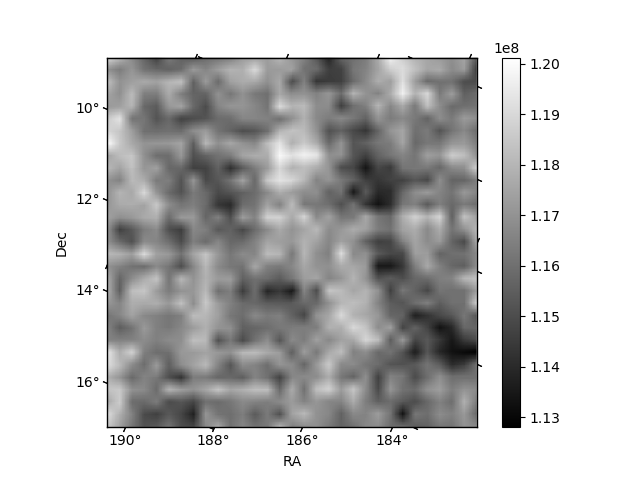
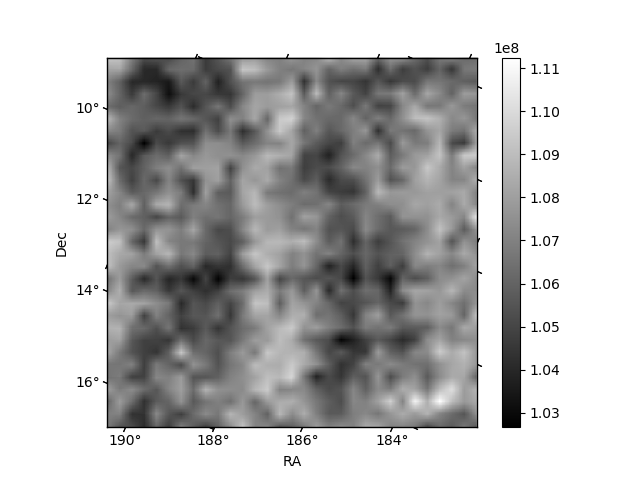
Histogram calculated using DETX and DETY for each event in the final _common_clean file
| Quadrant A | 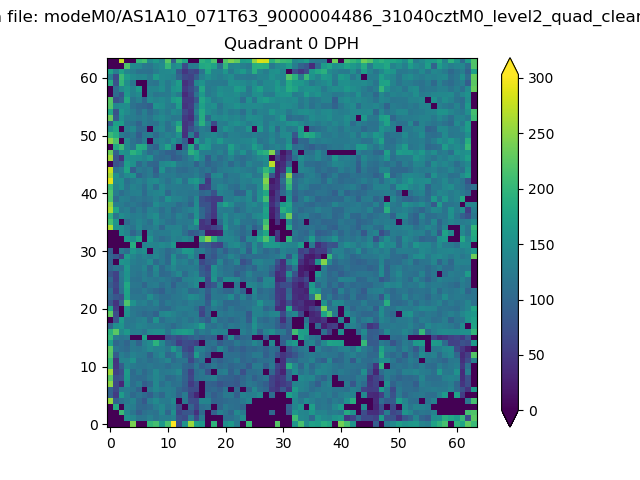 |
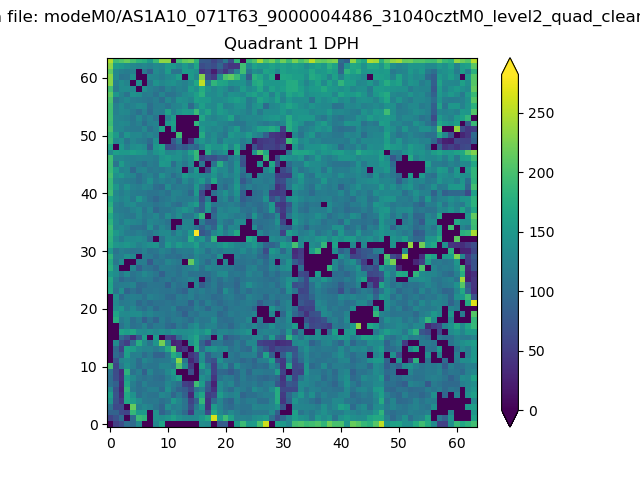 |
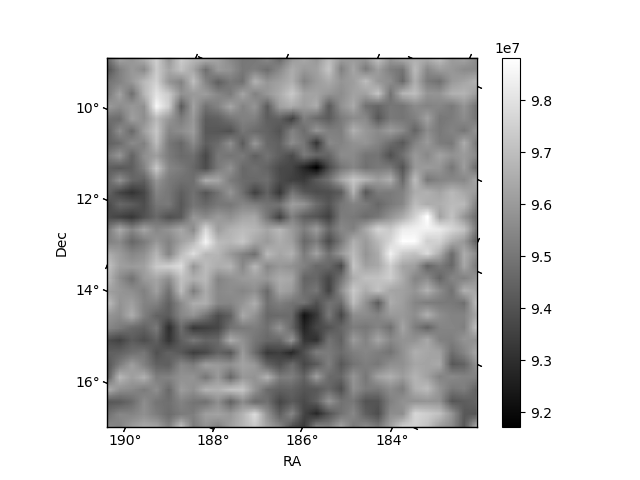
Quadrant B |
|---|---|---|---|
| Quadrant D |  |
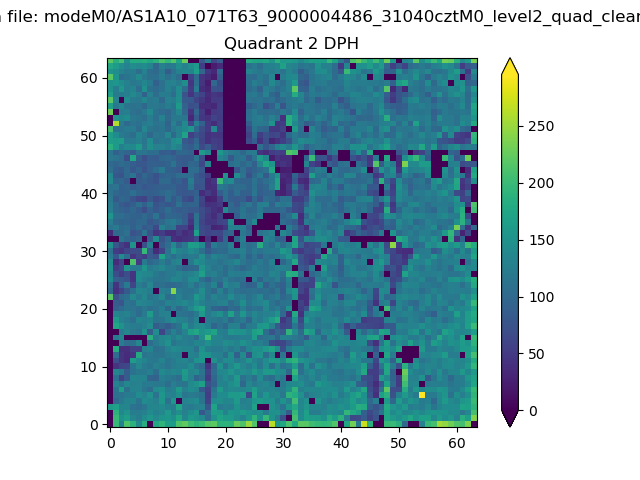 |
Quadrant C |
| Plot type | Count rate plots | Images |
|---|---|---|
| Comparison with Poisson distribution Blue bars denote a histogram of data divided into 1 sec bins. Red curve is a Poisson curve with rate = median count rate of data. |
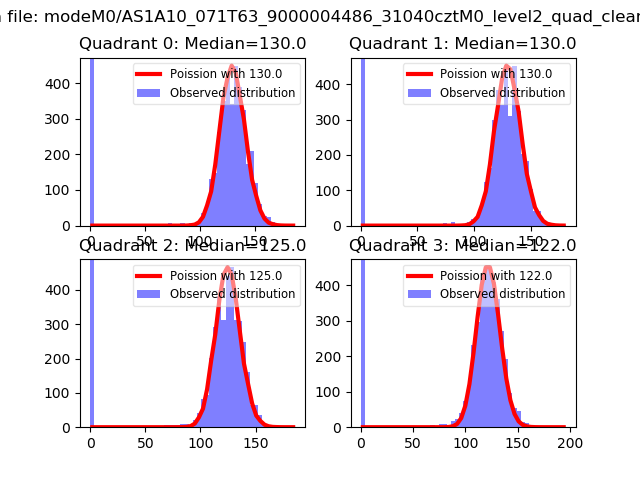 |
 |
| Quadrant-wise count rates Data is divided into 100 sec bins |
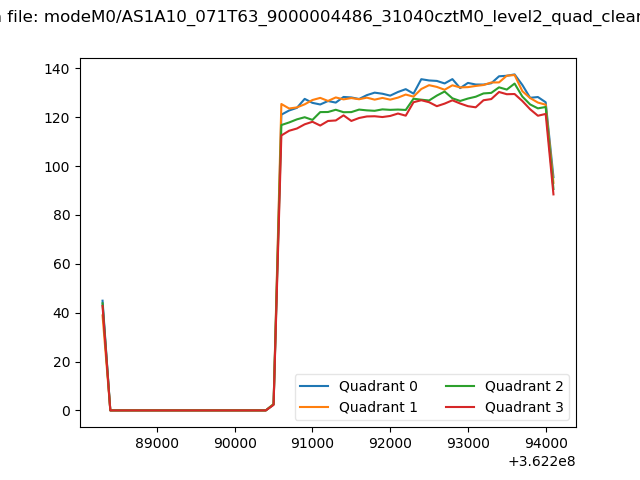 |
|
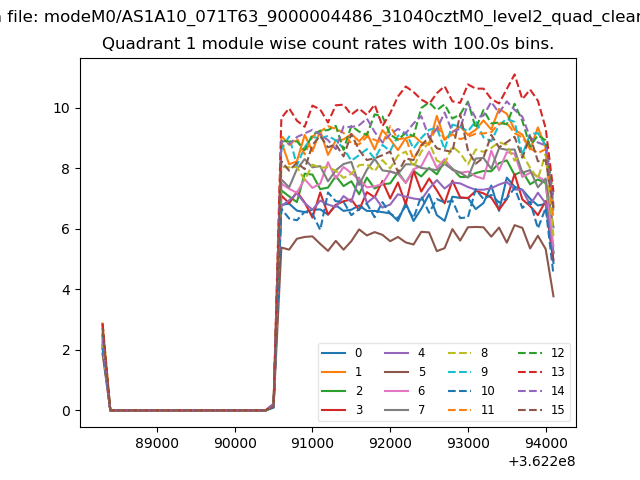
| Module-wise count rates for Quadrant A Data is divided into 100 sec bins |
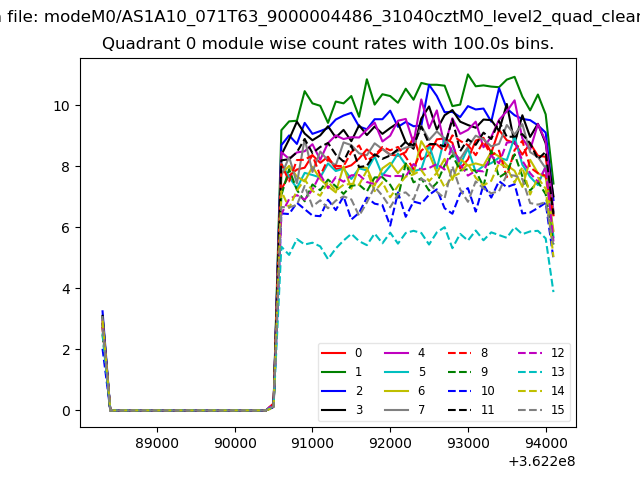 |
 |
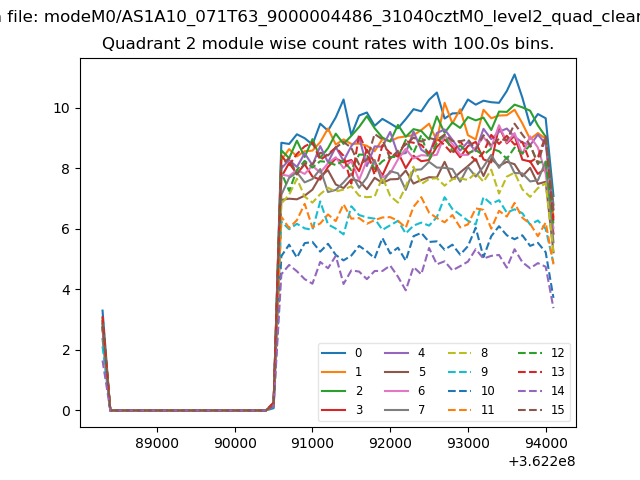
| Module-wise count rates for Quadrant B Data is divided into 100 sec bins |
 |
 |
| Module-wise count rates for Quadrant C Data is divided into 100 sec bins |
 |
 |
| Module-wise count rates for Quadrant D Data is divided into 100 sec bins |
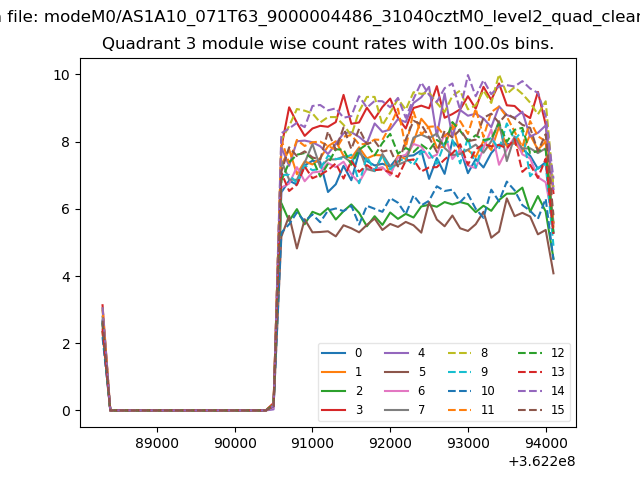 |
 |
| Parameter | Plot |
|---|---|
| CZT HV Monitor | 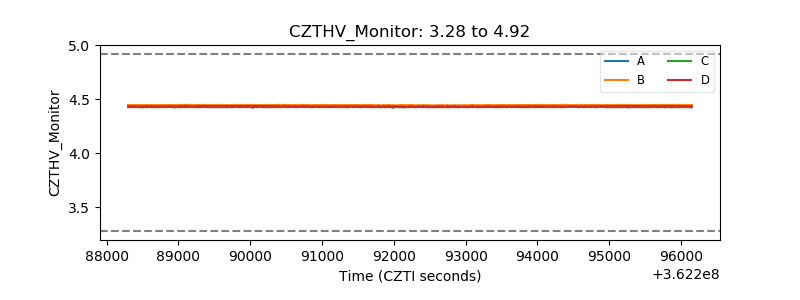 |
| D_VDD | 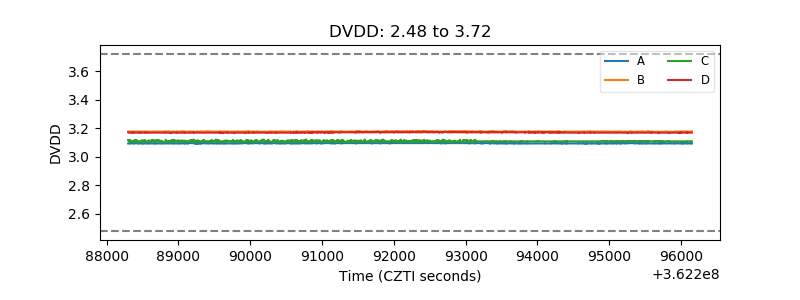 |
| Temperature 1 | 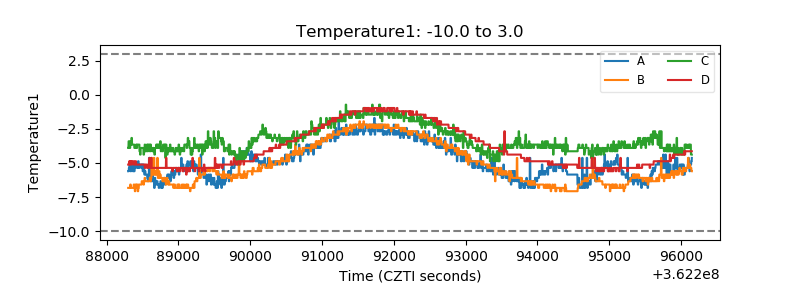 |
| Veto HV Monitor | 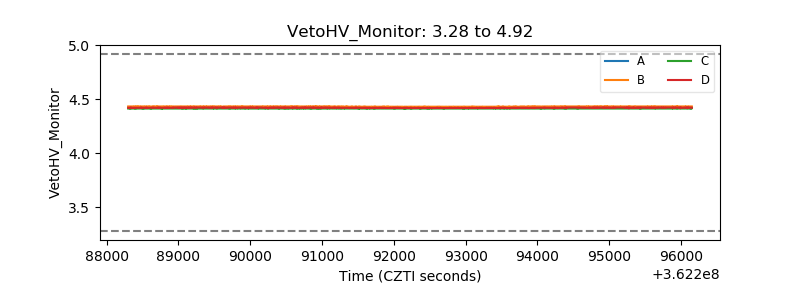 |
| Veto LLD | 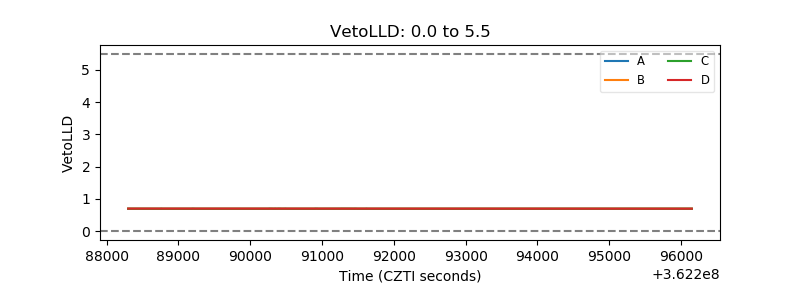 |
| Alpha Counter | 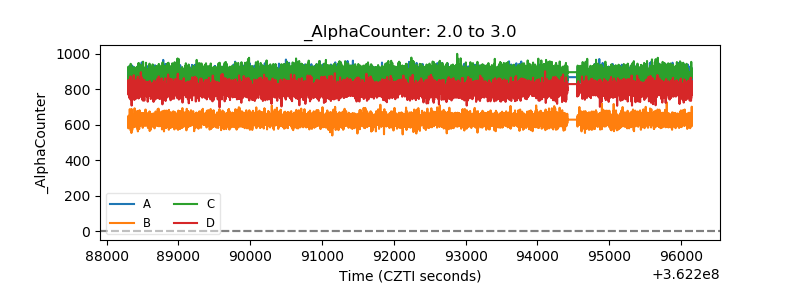 |
| _CPM_Rate | 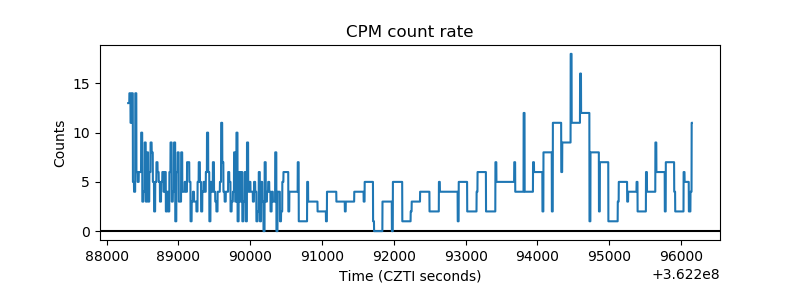 |
| CZT Counter | 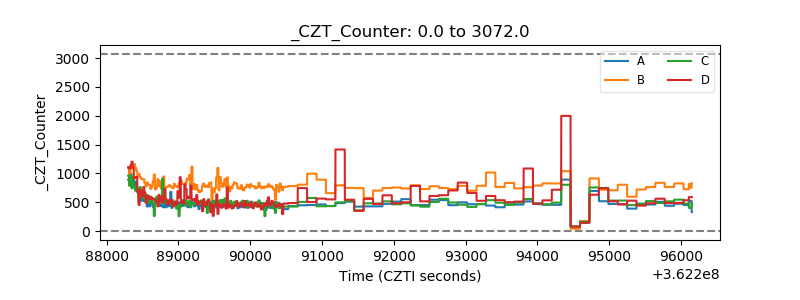 |
| +2.5 Volts monitor | 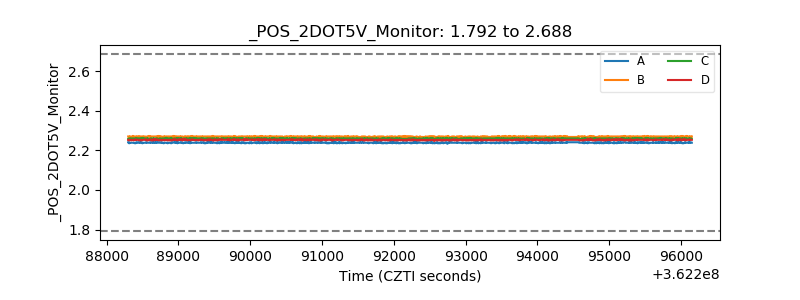 |
| +5 Volts monitor | 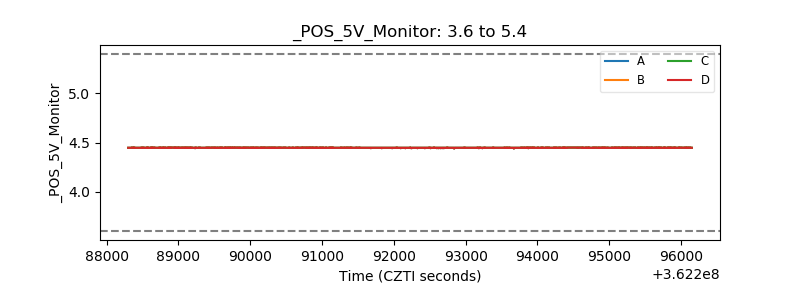 |
| _ROLL_ROT | 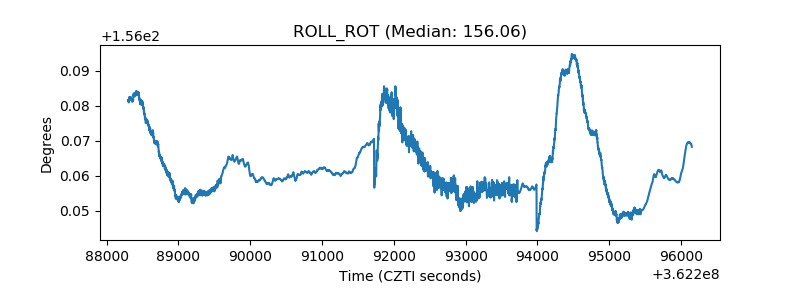 |
| _Roll_DEC | 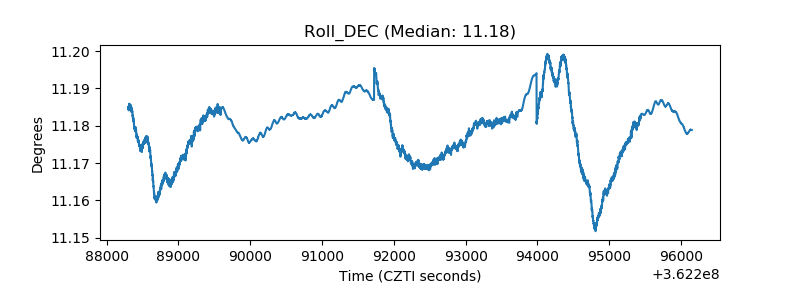 |
| _Roll_RA | 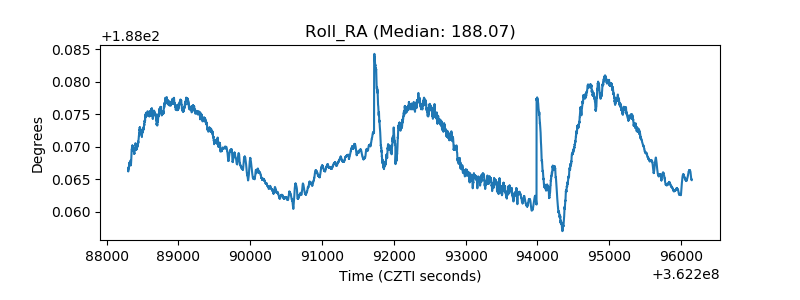 |
| Veto Counter | 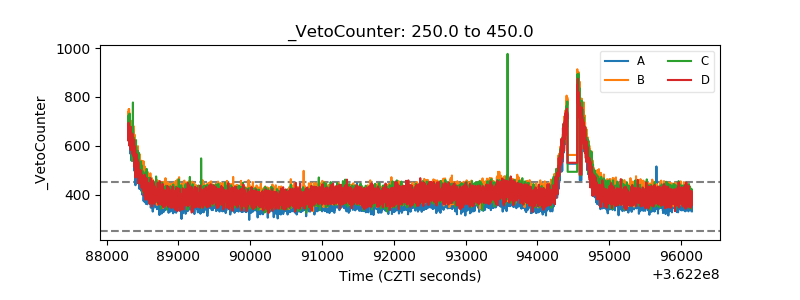 |