| Param | Original file | Final file |
|---|---|---|
| Filename | modeM0/AS1A10_071T63_9000004486_31042cztM0_level2.evt | modeM0/AS1A10_071T63_9000004486_31042cztM0_level2_quad_clean.evt |
| Size (bytes) | 285,477,120 | 38,574,720 |
| Size | 272.3 MB | 36.8 MB |
| Events in quadrant A | 1,754,076 | 233,122 |
| Events in quadrant B | 2,783,865 | 232,467 |
| Events in quadrant C | 1,807,258 | 222,371 |
| Events in quadrant D | 2,048,057 | 218,089 |
| Mode SS | |||
|---|---|---|---|
| Quadrant | BADHDUFLAG | Total packets | Discarded packets |
| A | 0 | 74 | 0 |
| B | 0 | 74 | 0 |
| C | 0 | 74 | 0 |
| D | 0 | 74 | 0 |
| Mode M0 | |||
|---|---|---|---|
| Quadrant | BADHDUFLAG | Total packets | Discarded packets |
| A | 0 | 7567 | 1 |
| B | 0 | 11129 | 1 |
| C | 0 | 7633 | 1 |
| D | 0 | 8200 | 5 |
| Quadrant | Total seconds | Saturated seconds | Saturation percentage |
|---|---|---|---|
| A | 3696 | 69 | 1.866883% |
| B | 3697 | 104 | 2.813092% |
| C | 3697 | 92 | 2.488504% |
| D | 3696 | 51 | 1.379870% |
Noise dominated data is calculated using 1-second bins in cleaned event files. If a bin has >2000 counts, and if more than 50% of those come from <1% of pixels, then it is considered to be noise-dominated and hence unusable.
| Quadrant | # 1 sec bins | Bins with >0 counts | Bins with >2000 counts | High rate bins dominated by noise | Noise dominated (total time) | Noise dominated (detector-on time) | Marked lightcurve |
|---|---|---|---|---|---|---|---|
| A | 3696 | 3696 | 0 | 0 | 0.00% | 0.00% | 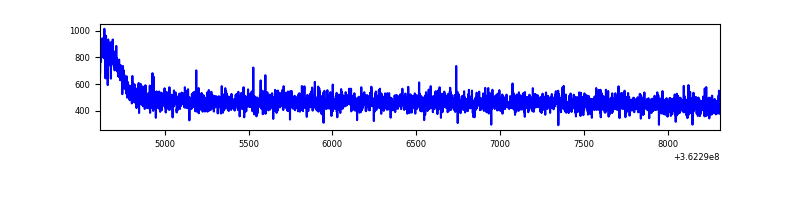 |
| B | 3697 | 3697 | 0 | 0 | 0.00% | 0.00% | 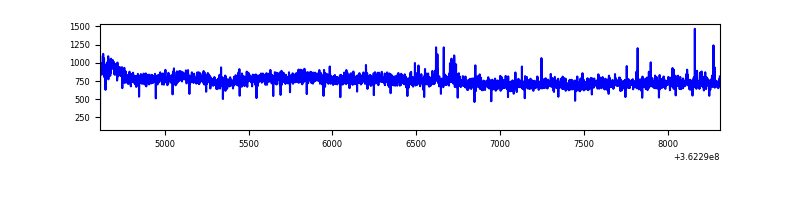 |
| C | 3697 | 3697 | 0 | 0 | 0.00% | 0.00% | 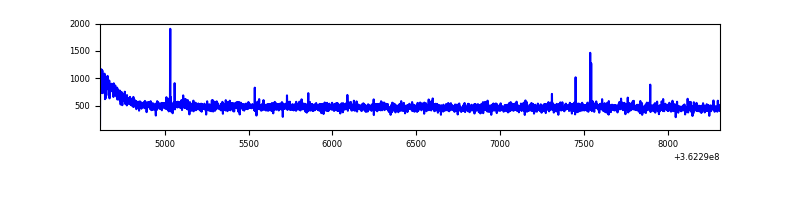 |
| D | 3696 | 3696 | 10 | 10 | 0.27% | 0.27% | 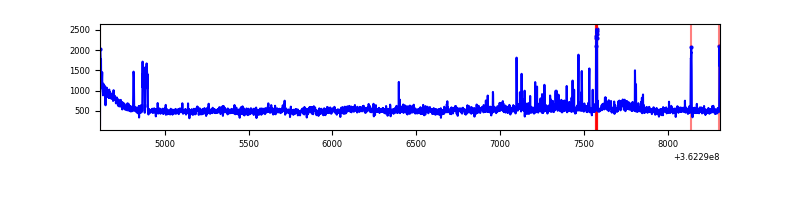 |
Top three noisy pixels from each quadrant. If the there are fewer than three noisy pixels in the level2.evt file, extra rows are filled as -1
| Pixel properties | Quadrant properties | ||||||
|---|---|---|---|---|---|---|---|
| Quadrant | DetID | PixID | Counts | Sigma | Mean | Median | Sigma |
| A | 13 | 254 | 6874 | 68.88 | 454 | 444 | 93.3 |
| A | 3 | 137 | 4842 | 47.11 | 454 | 444 | 93.3 |
| A | 0 | 226 | 3808 | 36.03 | 454 | 444 | 93.3 |
| B | 6 | 159 | 994874 | 11120.23 | 445 | 432 | 89.4 |
| B | 0 | 190 | 11478 | 123.52 | 445 | 432 | 89.4 |
| B | 12 | 111 | 11056 | 118.8 | 445 | 432 | 89.4 |
| C | 14 | 238 | 69312 | 665.89 | 432 | 433 | 103.4 |
| C | 3 | 233 | 19593 | 185.23 | 432 | 433 | 103.4 |
| C | 0 | 10 | 14734 | 138.25 | 432 | 433 | 103.4 |
| D | 8 | 195 | 316273 | 2932.12 | 437 | 425 | 107.7 |
| D | 13 | 174 | 25097 | 229.04 | 437 | 425 | 107.7 |
| D | 2 | 250 | 23658 | 215.68 | 437 | 425 | 107.7 |
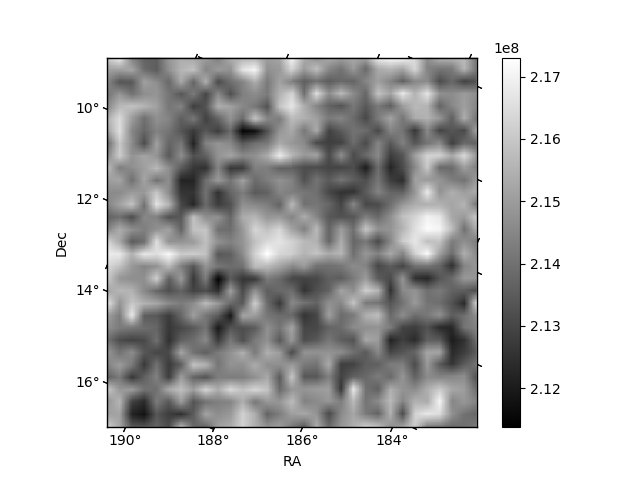
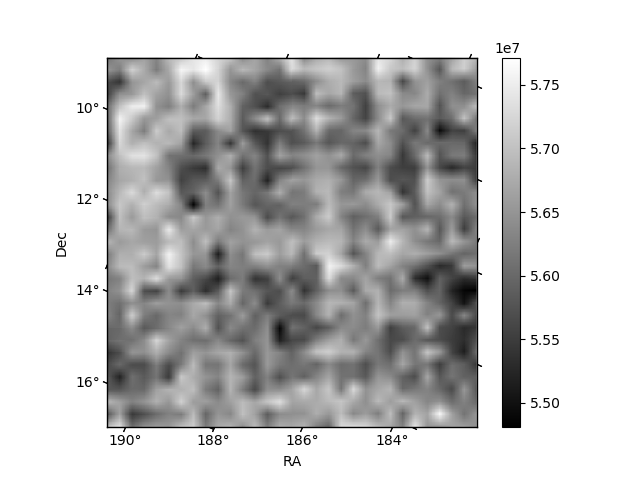
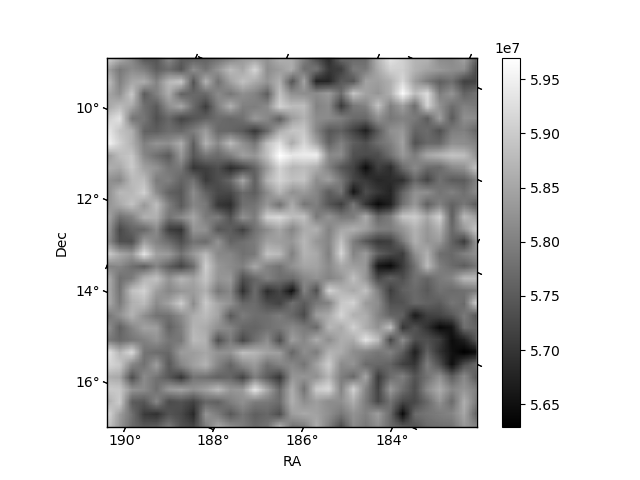
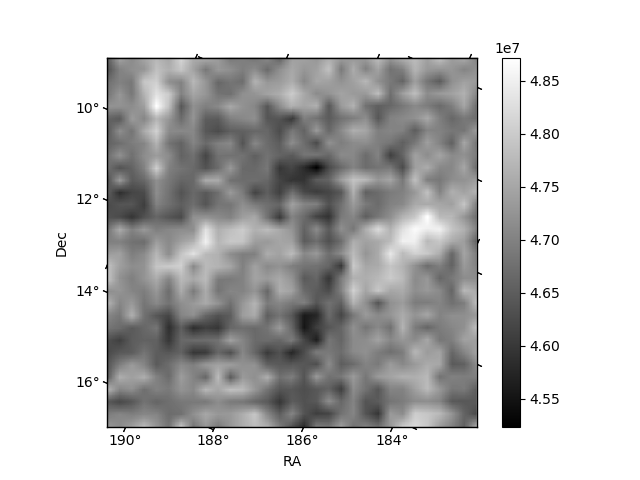
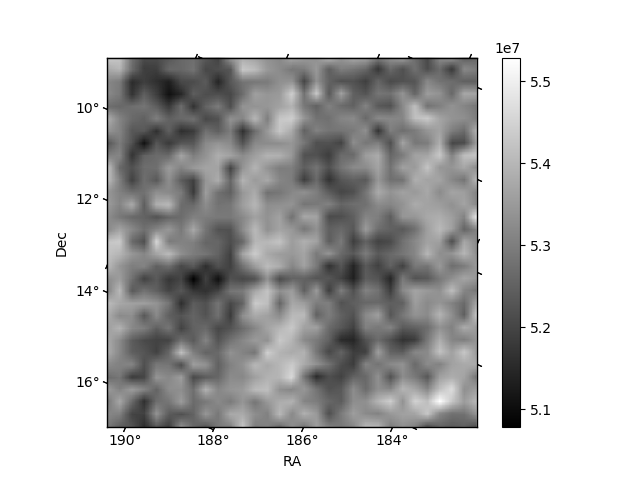
Histogram calculated using DETX and DETY for each event in the final _common_clean file
| Quadrant A | 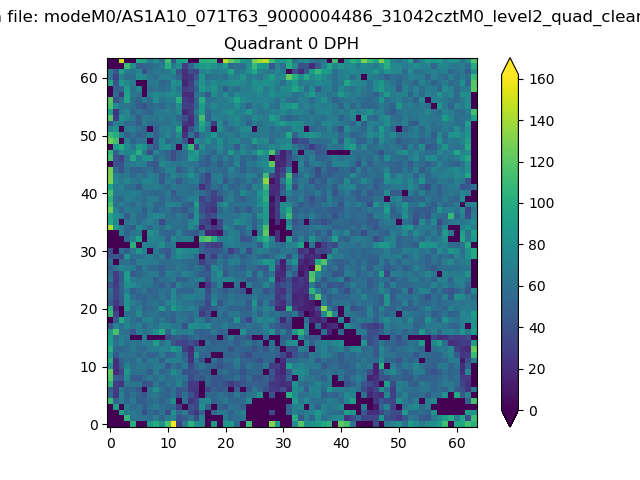 |
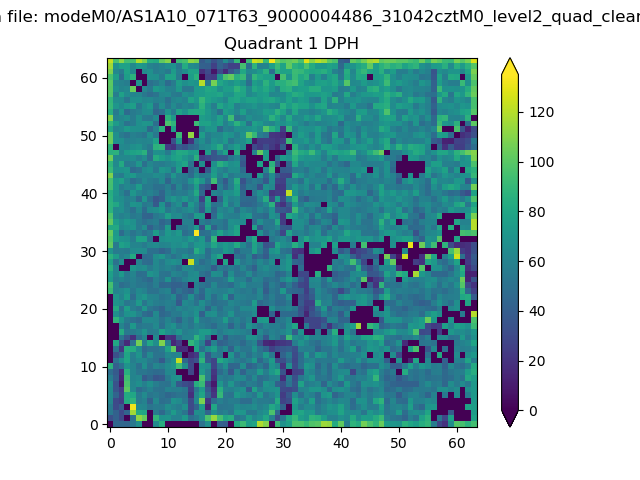 |
Quadrant B |
|---|---|---|---|
| Quadrant D |  |
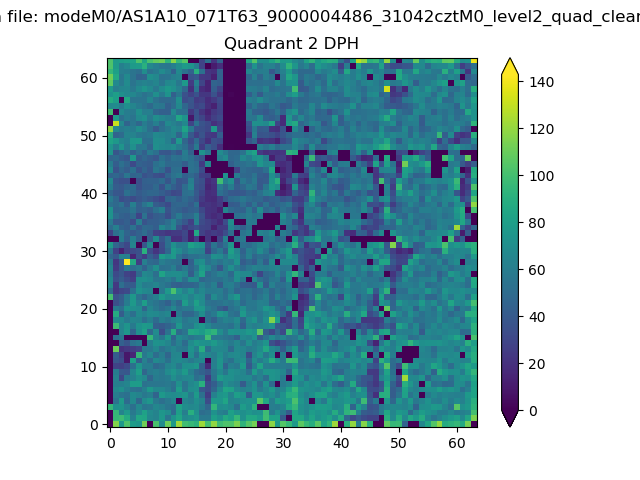 |
Quadrant C |
| Plot type | Count rate plots | Images |
|---|---|---|
| Comparison with Poisson distribution Blue bars denote a histogram of data divided into 1 sec bins. Red curve is a Poisson curve with rate = median count rate of data. |
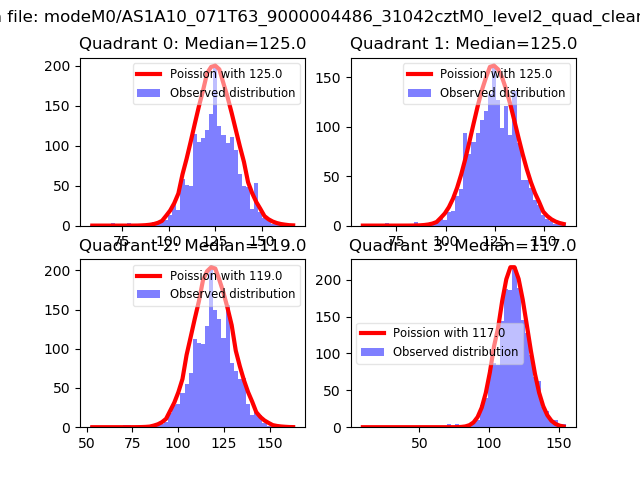 |
 |
| Quadrant-wise count rates Data is divided into 100 sec bins |
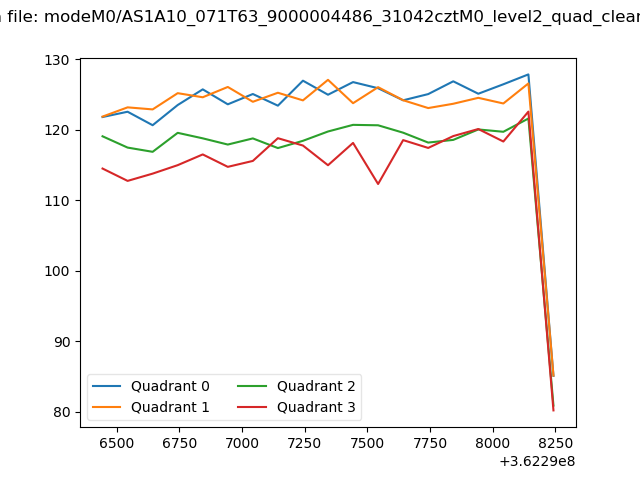 |
|
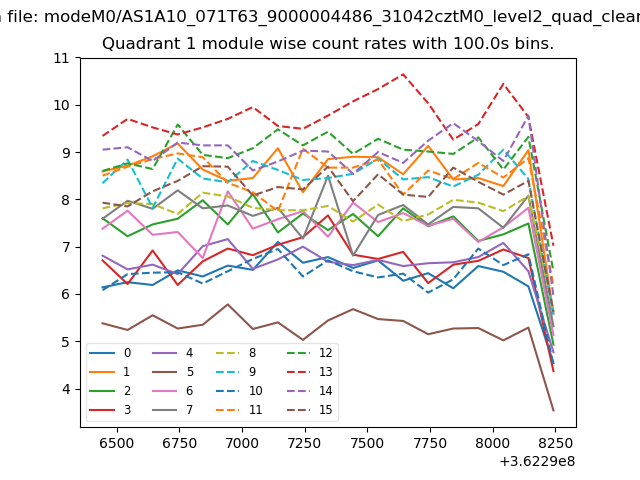
| Module-wise count rates for Quadrant A Data is divided into 100 sec bins |
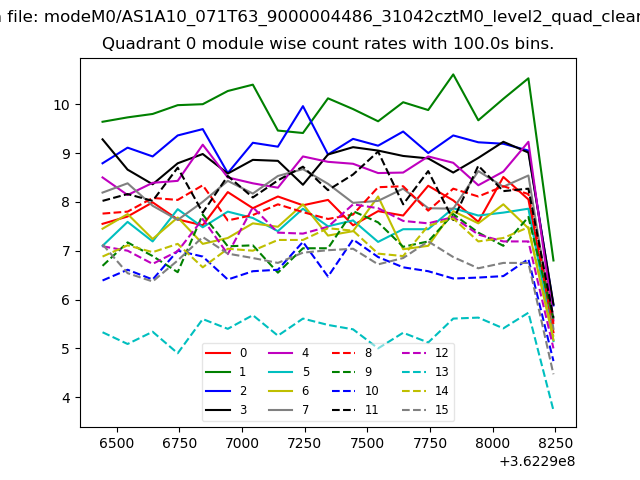 |
 |
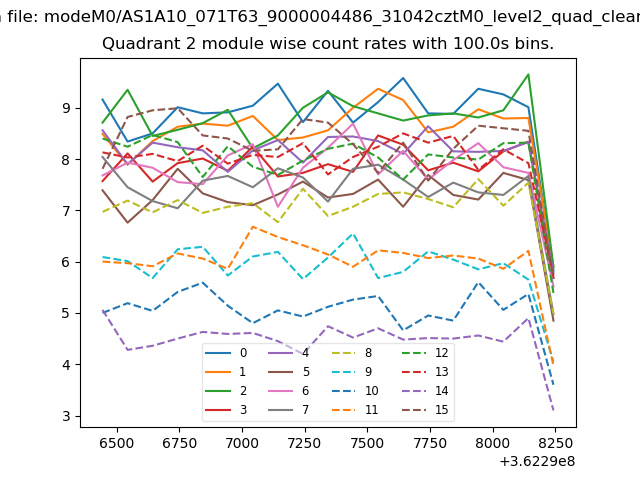
| Module-wise count rates for Quadrant B Data is divided into 100 sec bins |
 |
 |
| Module-wise count rates for Quadrant C Data is divided into 100 sec bins |
 |
 |
| Module-wise count rates for Quadrant D Data is divided into 100 sec bins |
 |
 |
| Parameter | Plot |
|---|---|
| CZT HV Monitor | 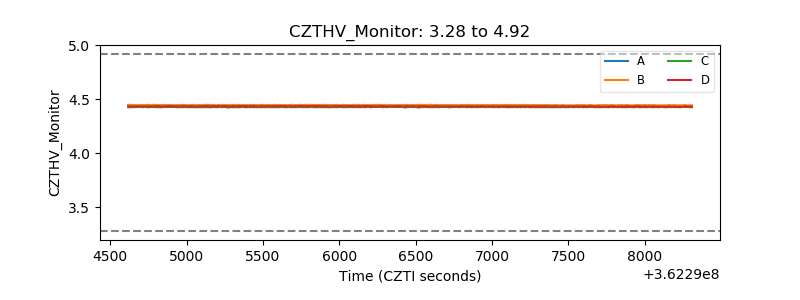 |
| D_VDD | 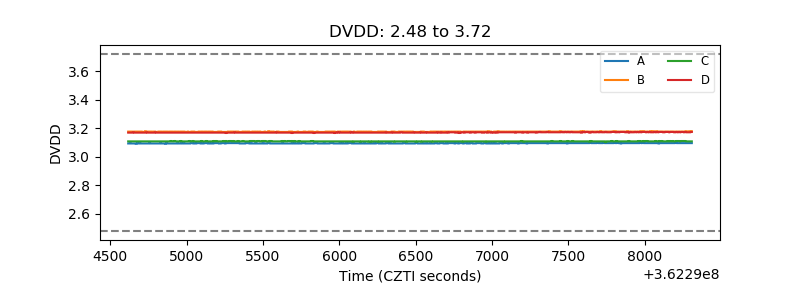 |
| Temperature 1 | 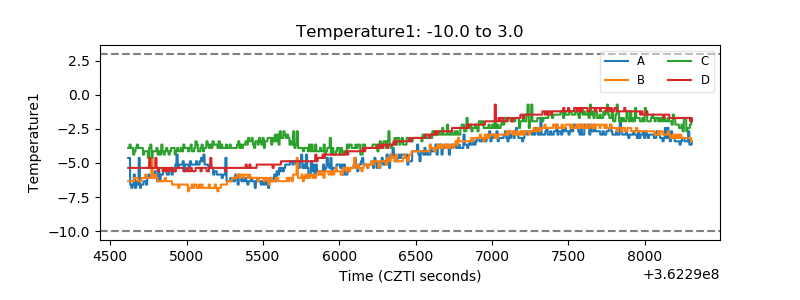 |
| Veto HV Monitor | 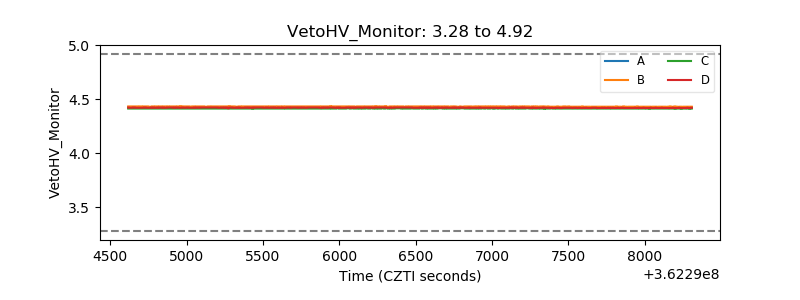 |
| Veto LLD | 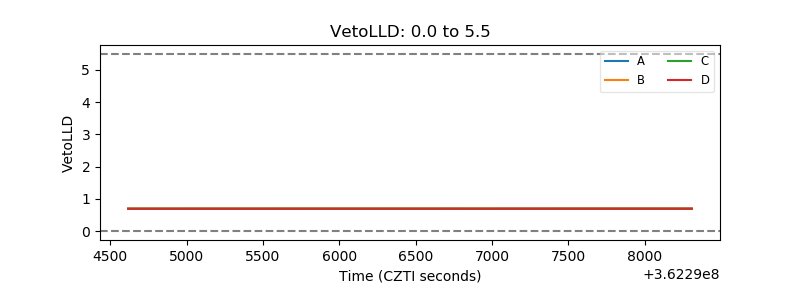 |
| Alpha Counter | 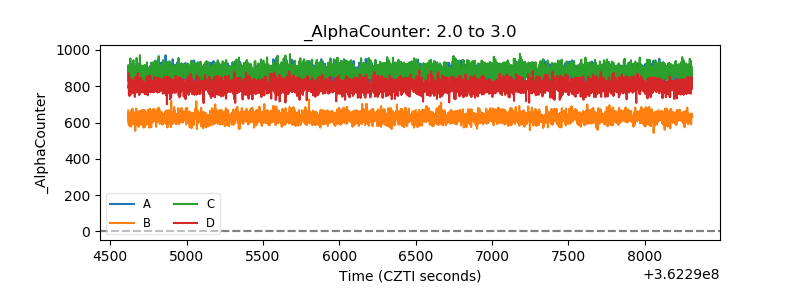 |
| _CPM_Rate | 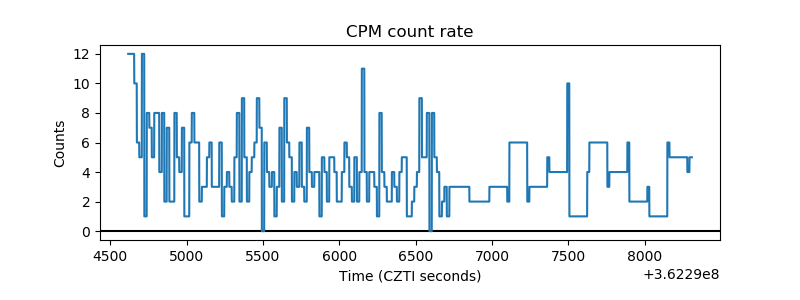 |
| CZT Counter | 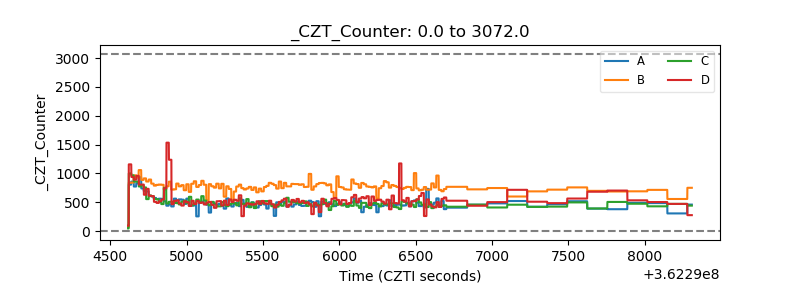 |
| +2.5 Volts monitor | 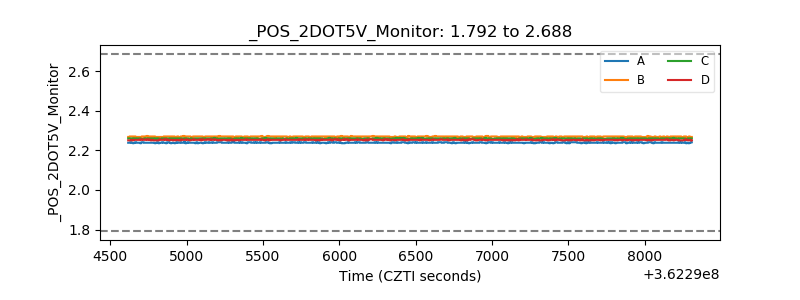 |
| +5 Volts monitor | 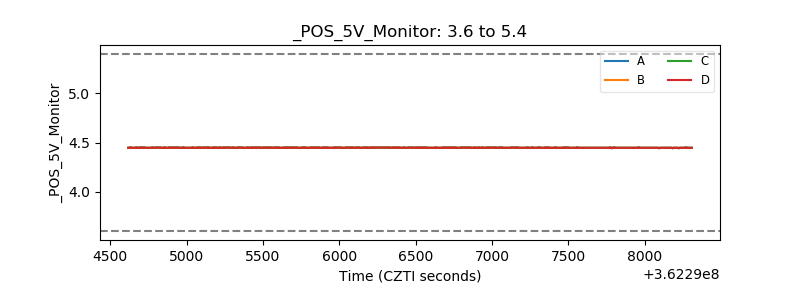 |
| _ROLL_ROT |  |
| _Roll_DEC | 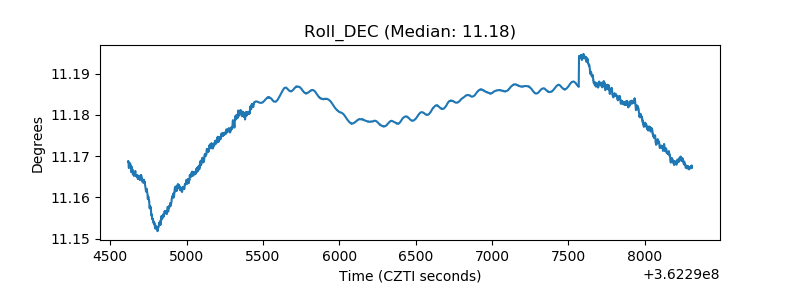 |
| _Roll_RA |  |
| Veto Counter | 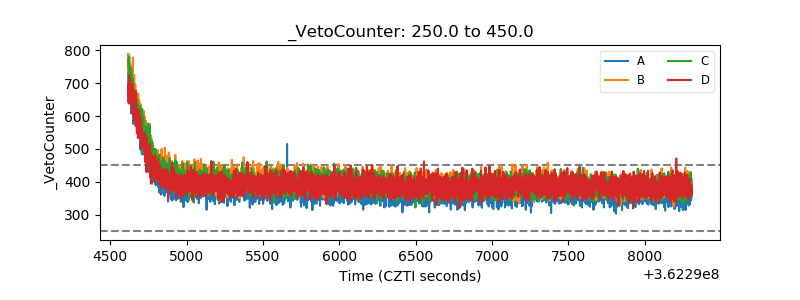 |