| Param | Original file | Final file |
|---|---|---|
| Filename | modeM0/AS1A10_071T63_9000004486_31043cztM0_level2.evt | modeM0/AS1A10_071T63_9000004486_31043cztM0_level2_quad_clean.evt |
| Size (bytes) | 1,255,276,800 | 214,073,280 |
| Size | 1.2 GB | 204.2 MB |
| Events in quadrant A | 7,544,708 | 1,387,882 |
| Events in quadrant B | 12,324,477 | 1,374,562 |
| Events in quadrant C | 7,788,635 | 1,328,157 |
| Events in quadrant D | 9,290,836 | 1,302,174 |
| Mode M9 | |||
|---|---|---|---|
| Quadrant | BADHDUFLAG | Total packets | Discarded packets |
| A | 0 | 18 | 0 |
| B | 0 | 18 | 0 |
| C | 0 | 18 | 0 |
| D | 0 | 18 | 0 |
| Mode SS | |||
|---|---|---|---|
| Quadrant | BADHDUFLAG | Total packets | Discarded packets |
| A | 0 | 322 | 0 |
| B | 0 | 322 | 0 |
| C | 0 | 322 | 0 |
| D | 0 | 322 | 0 |
| Mode M0 | |||
|---|---|---|---|
| Quadrant | BADHDUFLAG | Total packets | Discarded packets |
| A | 0 | 32388 | 3 |
| B | 0 | 48303 | 3 |
| C | 0 | 32668 | 3 |
| D | 0 | 37028 | 3 |
| Quadrant | Total seconds | Saturated seconds | Saturation percentage |
|---|---|---|---|
| A | 15822 | 259 | 1.636961% |
| B | 15822 | 453 | 2.863102% |
| C | 15822 | 367 | 2.319555% |
| D | 15822 | 373 | 2.357477% |
Noise dominated data is calculated using 1-second bins in cleaned event files. If a bin has >2000 counts, and if more than 50% of those come from <1% of pixels, then it is considered to be noise-dominated and hence unusable.
| Quadrant | # 1 sec bins | Bins with >0 counts | Bins with >2000 counts | High rate bins dominated by noise | Noise dominated (total time) | Noise dominated (detector-on time) | Marked lightcurve |
|---|---|---|---|---|---|---|---|
| A | 17597 | 15822 | 0 | 0 | 0.00% | 0.00% | 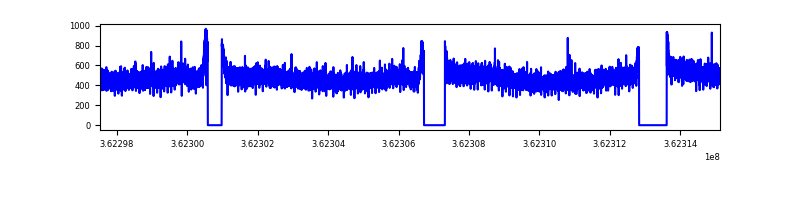 |
| B | 17597 | 15822 | 34 | 34 | 0.19% | 0.21% | 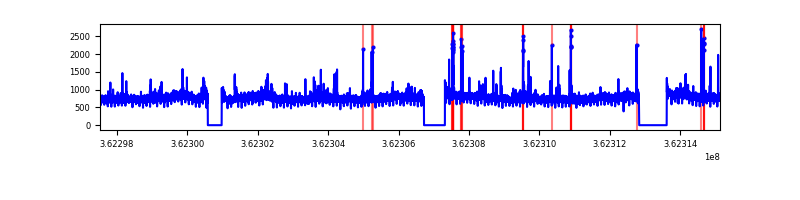 |
| C | 17597 | 15822 | 2 | 2 | 0.01% | 0.01% | 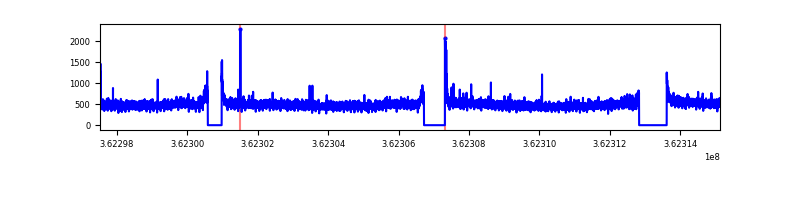 |
| D | 17597 | 15822 | 131 | 131 | 0.74% | 0.83% | 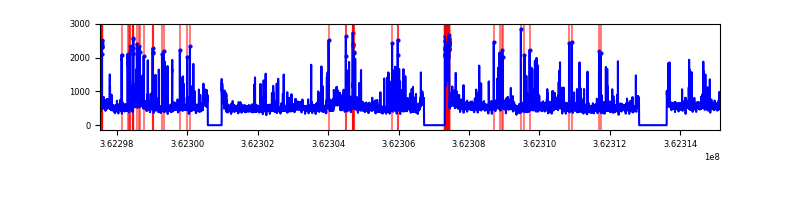 |
Top three noisy pixels from each quadrant. If the there are fewer than three noisy pixels in the level2.evt file, extra rows are filled as -1
| Pixel properties | Quadrant properties | ||||||
|---|---|---|---|---|---|---|---|
| Quadrant | DetID | PixID | Counts | Sigma | Mean | Median | Sigma |
| A | 13 | 254 | 30332 | 72.2 | 1953 | 1910 | 393.7 |
| A | 3 | 137 | 20634 | 47.56 | 1953 | 1910 | 393.7 |
| A | 0 | 226 | 16992 | 38.31 | 1953 | 1910 | 393.7 |
| B | 6 | 159 | 4302622 | 11572.94 | 1920 | 1867 | 371.6 |
| B | 0 | 190 | 142624 | 378.76 | 1920 | 1867 | 371.6 |
| B | 4 | 80 | 77328 | 203.06 | 1920 | 1867 | 371.6 |
| C | 14 | 238 | 296812 | 673.63 | 1866 | 1879 | 437.8 |
| C | 3 | 233 | 89594 | 200.34 | 1866 | 1879 | 437.8 |
| C | 0 | 10 | 62688 | 138.89 | 1866 | 1879 | 437.8 |
| D | 8 | 195 | 1315267 | 2943.22 | 1880 | 1831 | 446.3 |
| D | 1 | 52 | 261043 | 580.86 | 1880 | 1831 | 446.3 |
| D | 2 | 250 | 135280 | 299.04 | 1880 | 1831 | 446.3 |
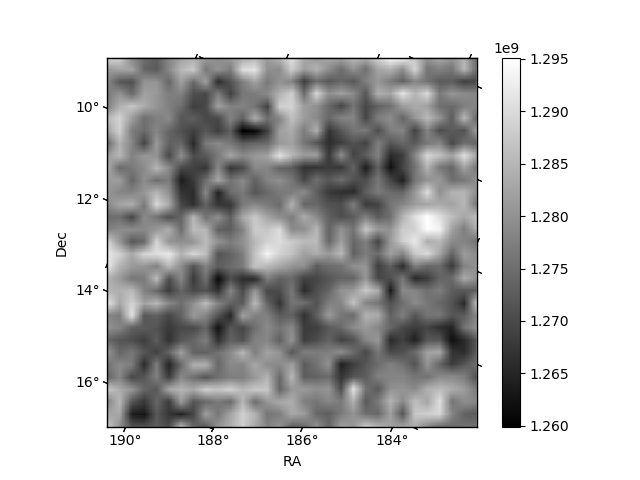
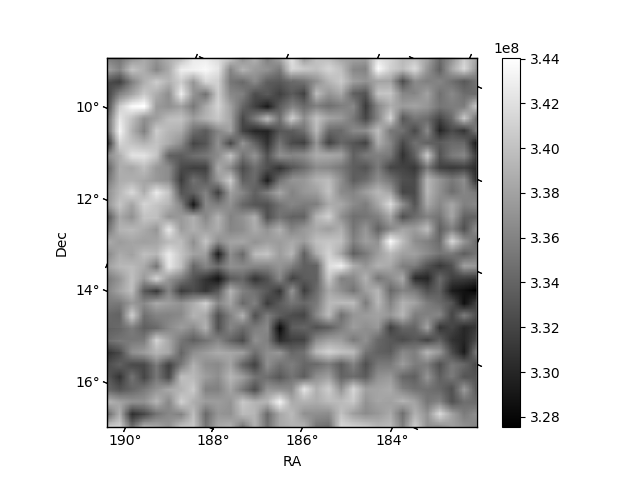
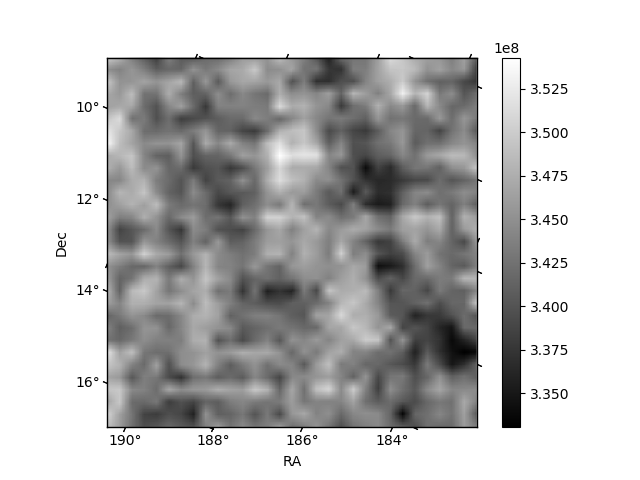
Histogram calculated using DETX and DETY for each event in the final _common_clean file
| Quadrant A | 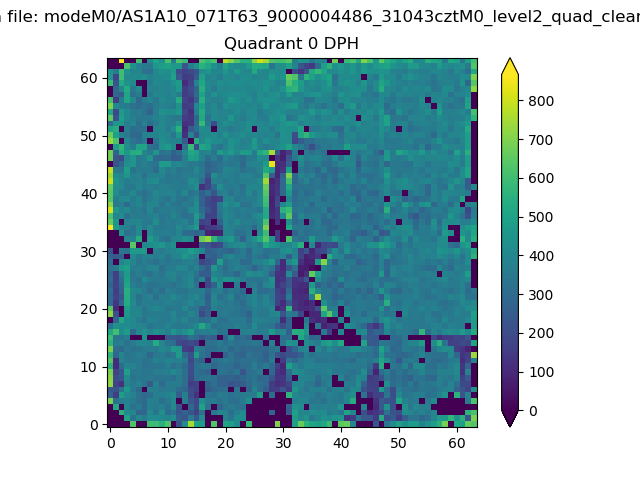 |
 |
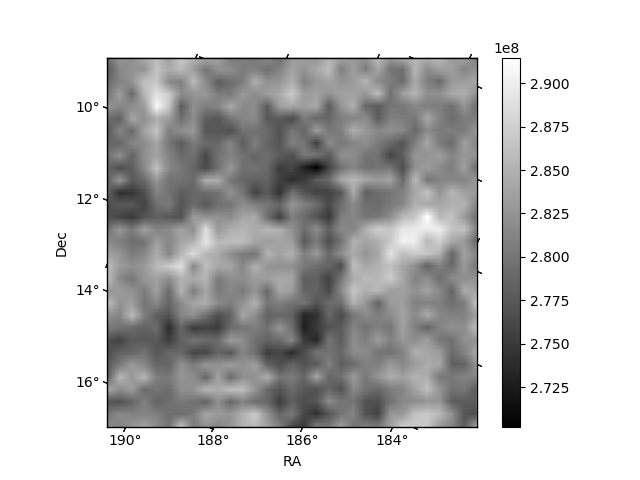
Quadrant B |
|---|---|---|---|
| Quadrant D | 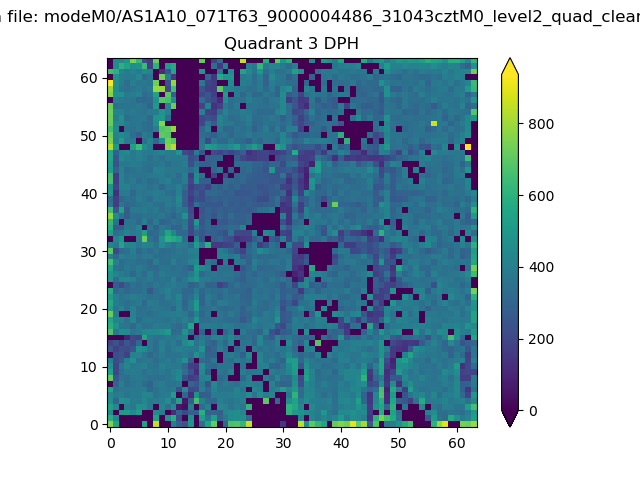 |
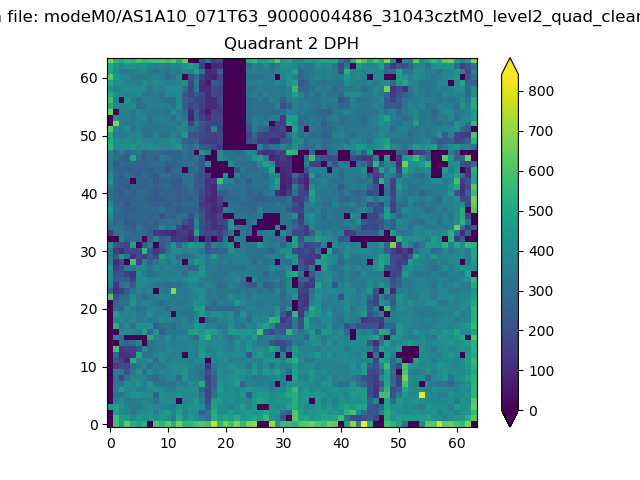 |
Quadrant C |
| Plot type | Count rate plots | Images |
|---|---|---|
| Comparison with Poisson distribution Blue bars denote a histogram of data divided into 1 sec bins. Red curve is a Poisson curve with rate = median count rate of data. |
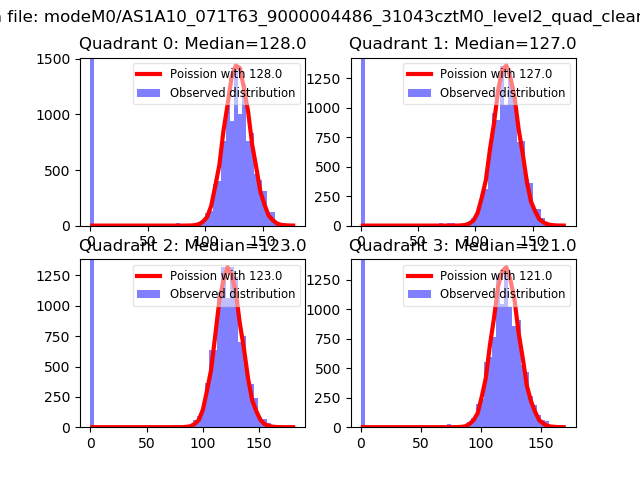 |
 |
| Quadrant-wise count rates Data is divided into 100 sec bins |
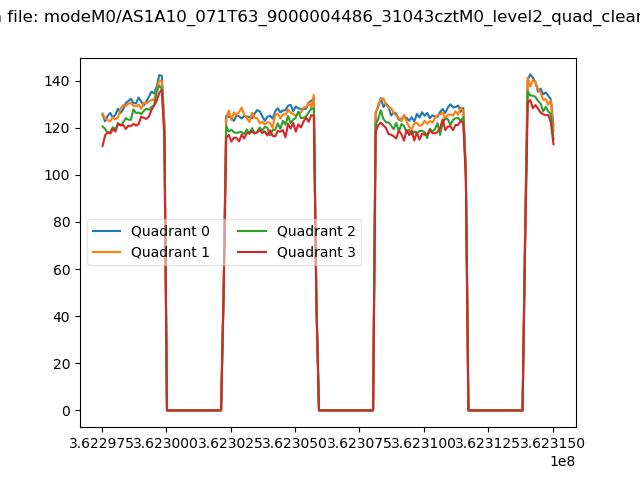 |
|
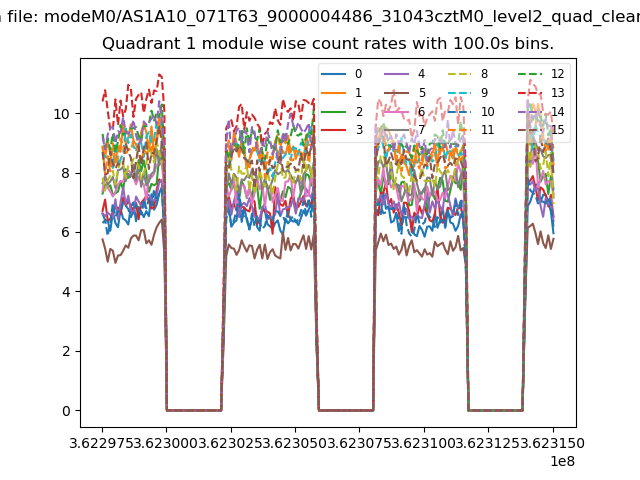
| Module-wise count rates for Quadrant A Data is divided into 100 sec bins |
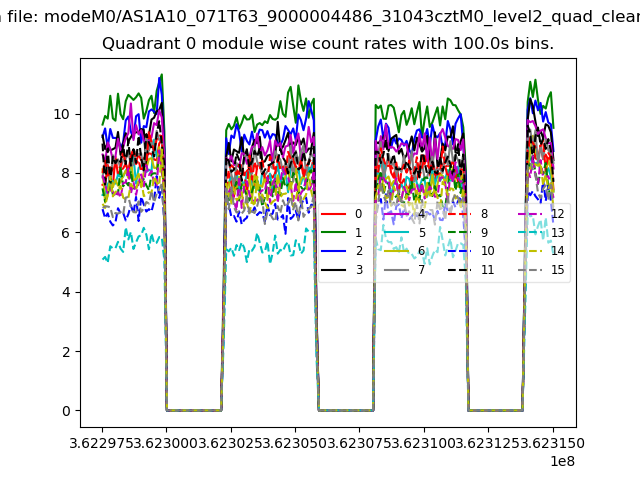 |
 |
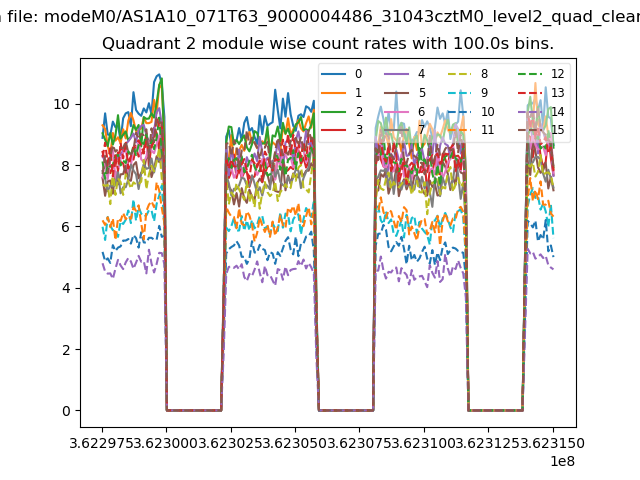
| Module-wise count rates for Quadrant B Data is divided into 100 sec bins |
 |
 |
| Module-wise count rates for Quadrant C Data is divided into 100 sec bins |
 |
 |
| Module-wise count rates for Quadrant D Data is divided into 100 sec bins |
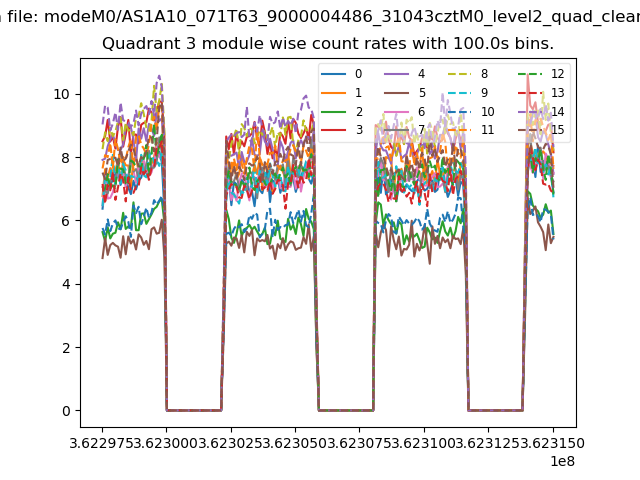 |
 |
| Parameter | Plot |
|---|---|
| CZT HV Monitor | 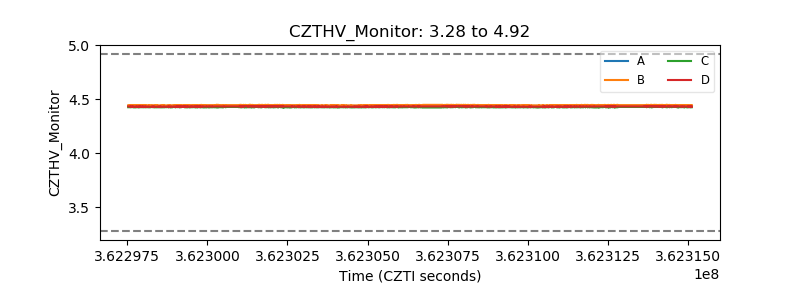 |
| D_VDD | 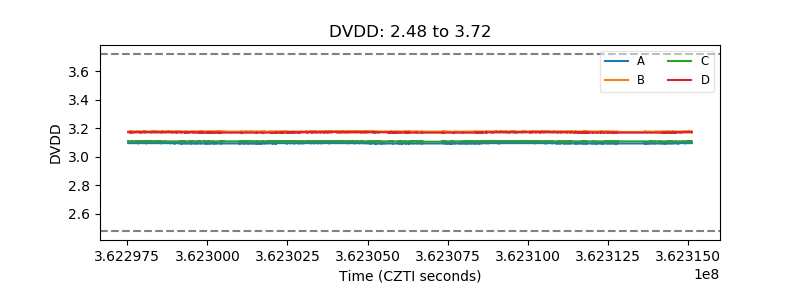 |
| Temperature 1 | 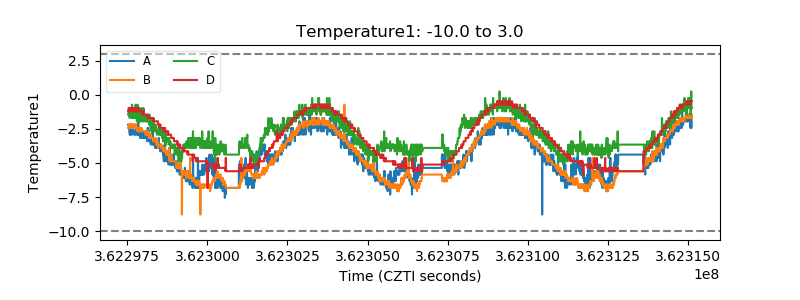 |
| Veto HV Monitor | 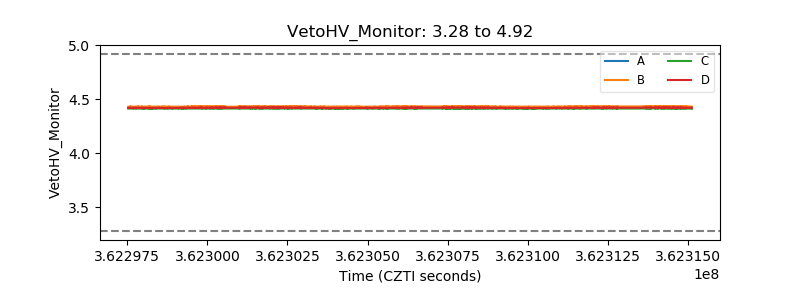 |
| Veto LLD |  |
| Alpha Counter | 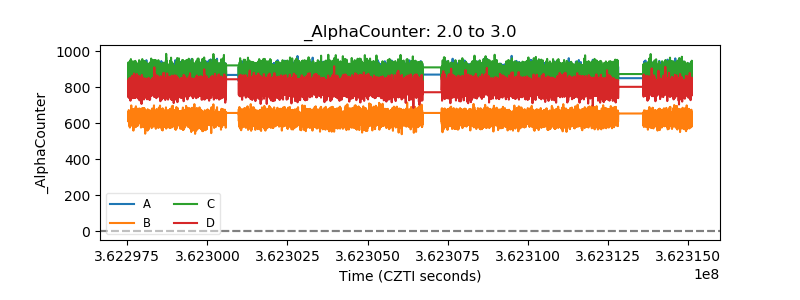 |
| _CPM_Rate | 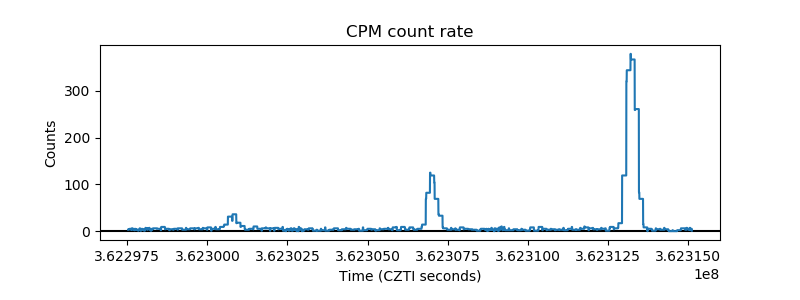 |
| CZT Counter | 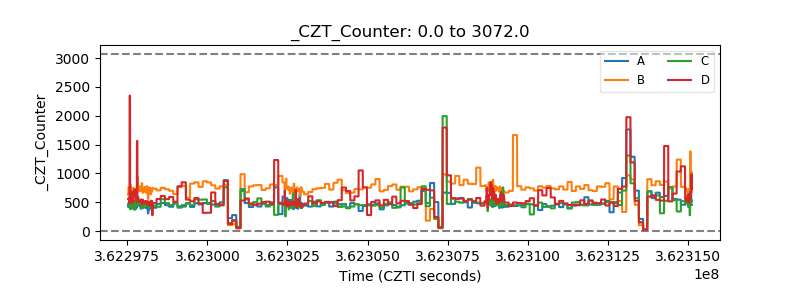 |
| +2.5 Volts monitor |  |
| +5 Volts monitor |  |
| _ROLL_ROT | 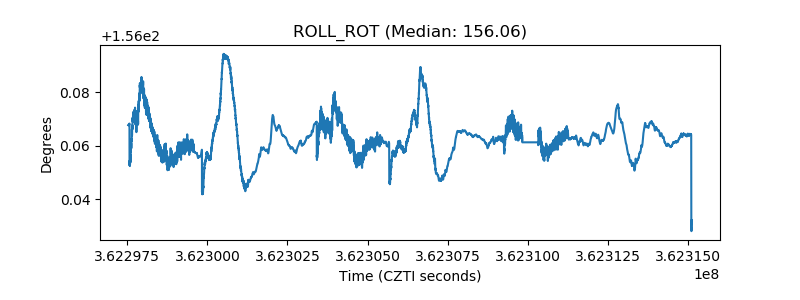 |
| _Roll_DEC | 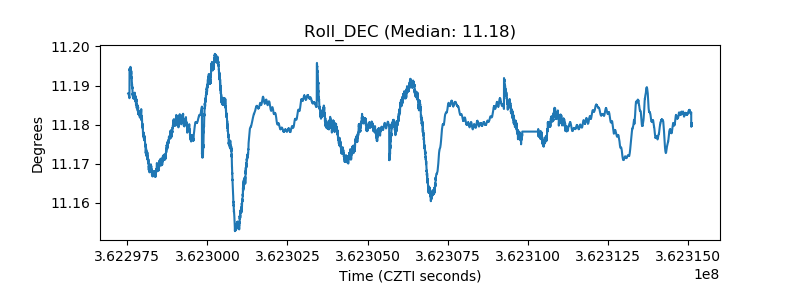 |
| _Roll_RA | 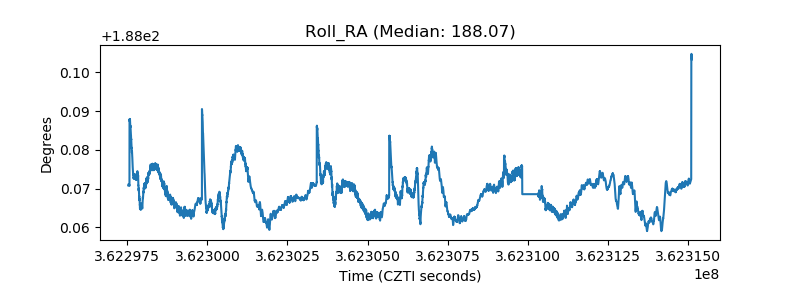 |
| Veto Counter | 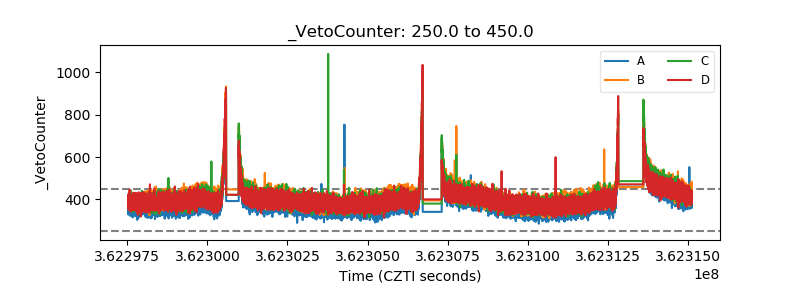 |