| Param | Original file | Final file |
|---|---|---|
| Filename | modeM0/AS1A10_071T63_9000004486_31044cztM0_level2.evt | modeM0/AS1A10_071T63_9000004486_31044cztM0_level2_quad_clean.evt |
| Size (bytes) | 550,111,680 | 101,776,320 |
| Size | 524.6 MB | 97.1 MB |
| Events in quadrant A | 3,326,922 | 676,926 |
| Events in quadrant B | 5,437,504 | 665,022 |
| Events in quadrant C | 3,516,007 | 641,808 |
| Events in quadrant D | 3,922,929 | 628,429 |
| Mode M9 | |||
|---|---|---|---|
| Quadrant | BADHDUFLAG | Total packets | Discarded packets |
| A | 0 | 12 | 0 |
| B | 0 | 13 | 0 |
| C | 0 | 13 | 0 |
| D | 0 | 13 | 0 |
| Mode SS | |||
|---|---|---|---|
| Quadrant | BADHDUFLAG | Total packets | Discarded packets |
| A | 0 | 138 | 0 |
| B | 0 | 138 | 0 |
| C | 0 | 138 | 0 |
| D | 0 | 138 | 0 |
| Mode M0 | |||
|---|---|---|---|
| Quadrant | BADHDUFLAG | Total packets | Discarded packets |
| A | 0 | 14201 | 2 |
| B | 0 | 20917 | 2 |
| C | 0 | 14656 | 2 |
| D | 0 | 15813 | 6 |
| Quadrant | Total seconds | Saturated seconds | Saturation percentage |
|---|---|---|---|
| A | 6741 | 68 | 1.008752% |
| B | 6741 | 167 | 2.477377% |
| C | 6741 | 108 | 1.602136% |
| D | 6740 | 103 | 1.528190% |
Noise dominated data is calculated using 1-second bins in cleaned event files. If a bin has >2000 counts, and if more than 50% of those come from <1% of pixels, then it is considered to be noise-dominated and hence unusable.
| Quadrant | # 1 sec bins | Bins with >0 counts | Bins with >2000 counts | High rate bins dominated by noise | Noise dominated (total time) | Noise dominated (detector-on time) | Marked lightcurve |
|---|---|---|---|---|---|---|---|
| A | 7706 | 6741 | 0 | 0 | 0.00% | 0.00% | 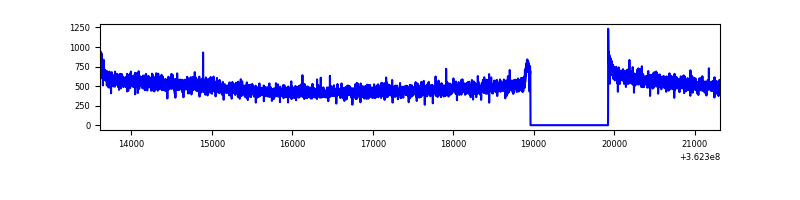 |
| B | 7706 | 6741 | 24 | 24 | 0.31% | 0.36% | 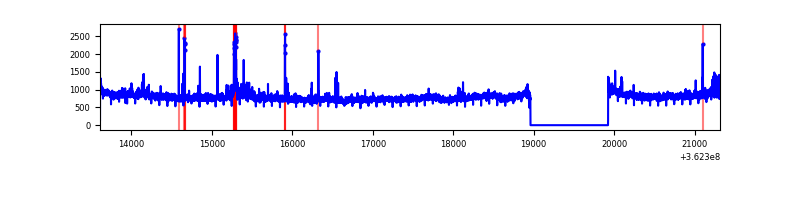 |
| C | 7706 | 6741 | 0 | 0 | 0.00% | 0.00% | 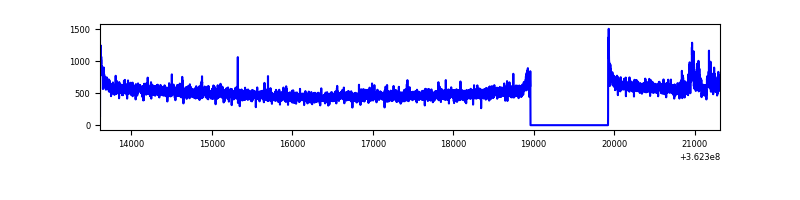 |
| D | 7705 | 6740 | 43 | 43 | 0.56% | 0.64% | 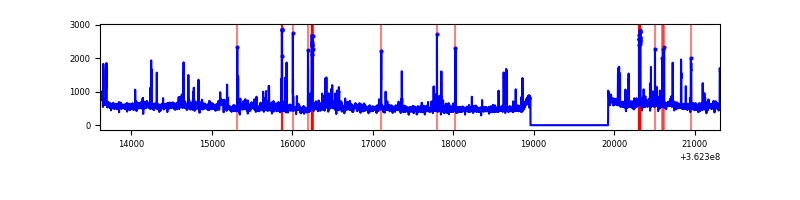 |
Top three noisy pixels from each quadrant. If the there are fewer than three noisy pixels in the level2.evt file, extra rows are filled as -1
| Pixel properties | Quadrant properties | ||||||
|---|---|---|---|---|---|---|---|
| Quadrant | DetID | PixID | Counts | Sigma | Mean | Median | Sigma |
| A | 13 | 254 | 12716 | 68.86 | 861 | 842 | 172.4 |
| A | 3 | 137 | 8759 | 45.91 | 861 | 842 | 172.4 |
| A | 0 | 226 | 7337 | 37.67 | 861 | 842 | 172.4 |
| B | 6 | 159 | 1844038 | 11200.36 | 842 | 818 | 164.6 |
| B | 4 | 171 | 70082 | 420.88 | 842 | 818 | 164.6 |
| B | 0 | 190 | 69270 | 415.95 | 842 | 818 | 164.6 |
| C | 3 | 233 | 149117 | 777.08 | 818 | 824 | 190.8 |
| C | 14 | 238 | 131101 | 682.68 | 818 | 824 | 190.8 |
| C | 1 | 16 | 23103 | 116.75 | 818 | 824 | 190.8 |
| D | 8 | 195 | 562261 | 2812.69 | 829 | 806 | 199.6 |
| D | 7 | 69 | 84997 | 421.77 | 829 | 806 | 199.6 |
| D | 2 | 250 | 60491 | 299.0 | 829 | 806 | 199.6 |
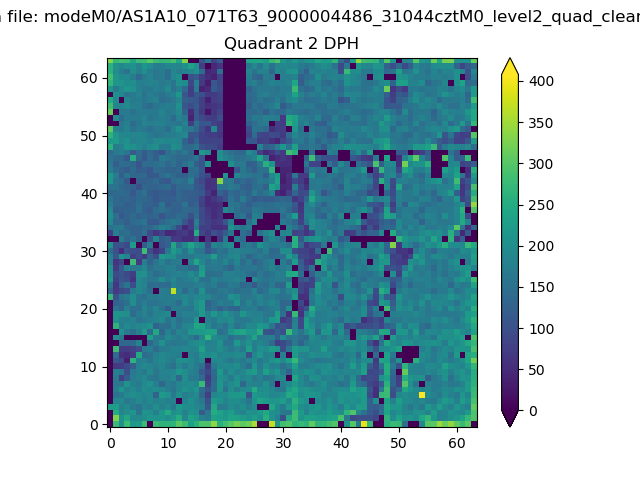
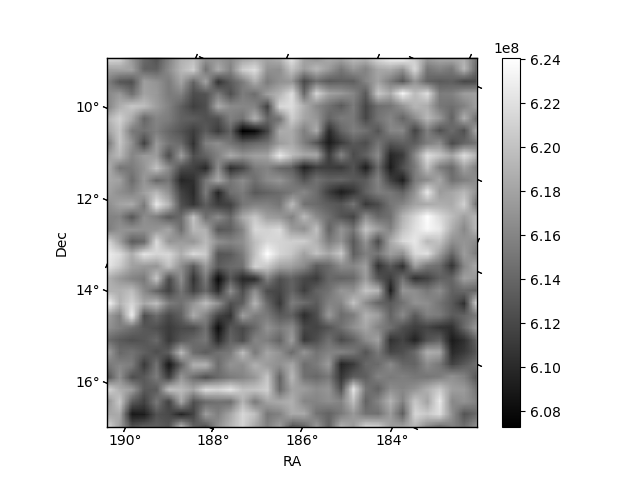
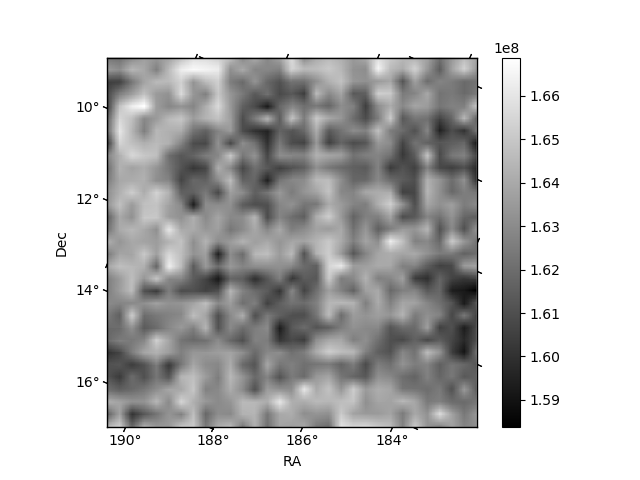
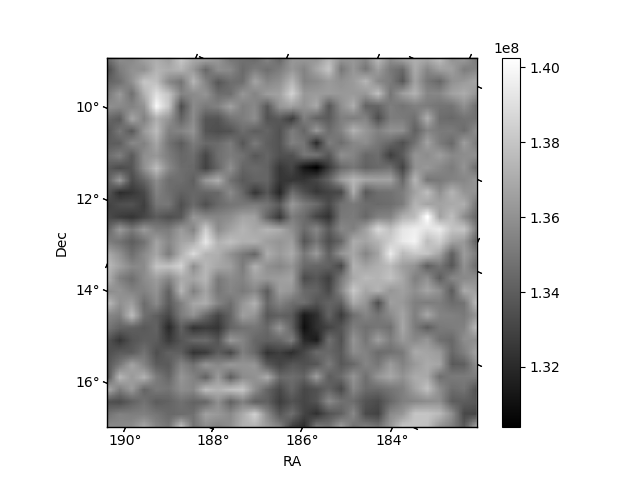
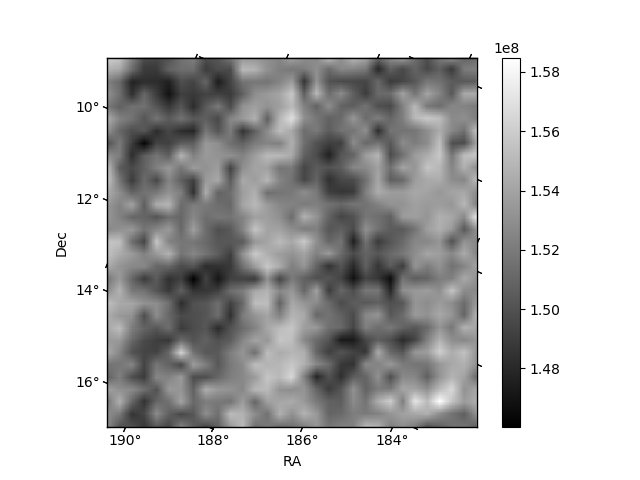
Histogram calculated using DETX and DETY for each event in the final _common_clean file
| Quadrant A | 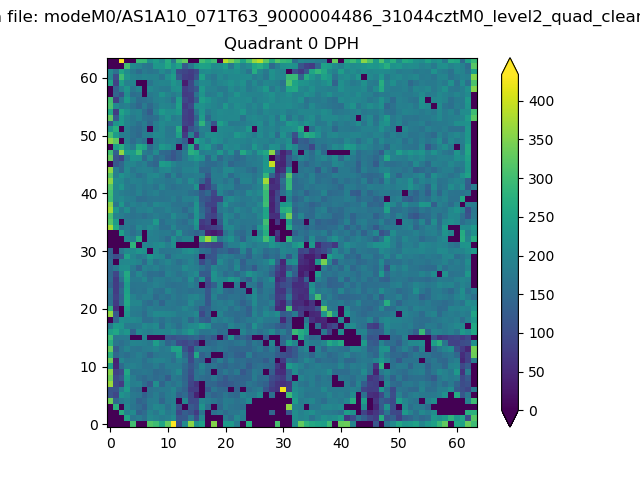 |
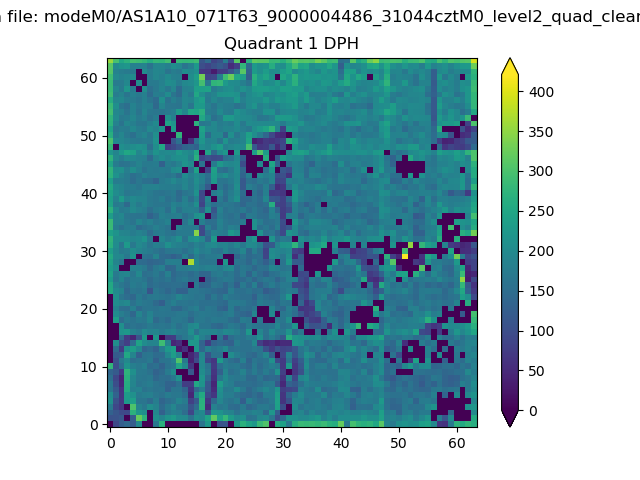 |
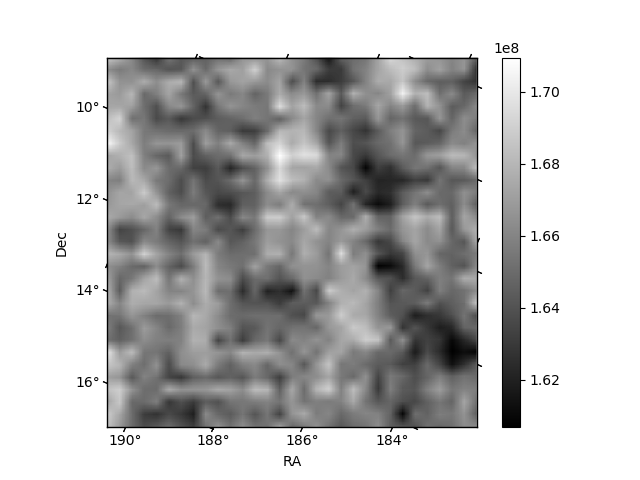
Quadrant B |
|---|---|---|---|
| Quadrant D | 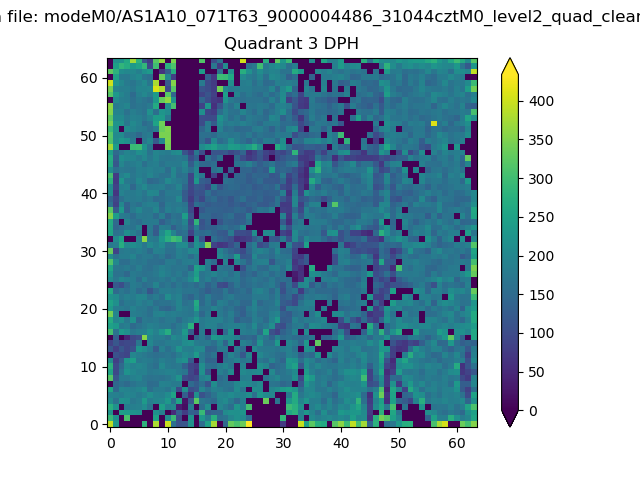 |
 |
Quadrant C |
| Plot type | Count rate plots | Images |
|---|---|---|
| Comparison with Poisson distribution Blue bars denote a histogram of data divided into 1 sec bins. Red curve is a Poisson curve with rate = median count rate of data. |
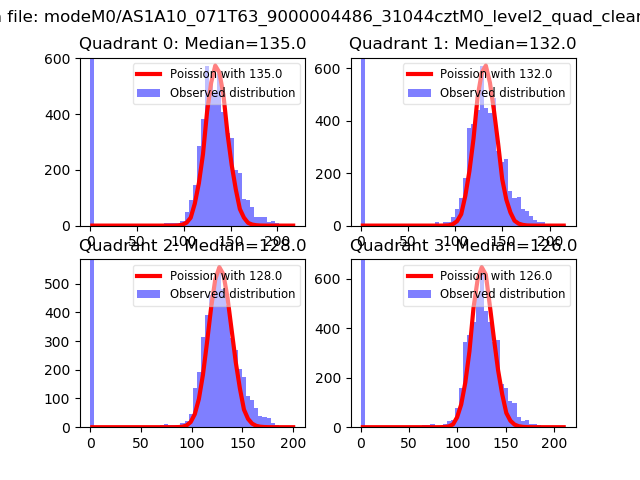 |
 |
| Quadrant-wise count rates Data is divided into 100 sec bins |
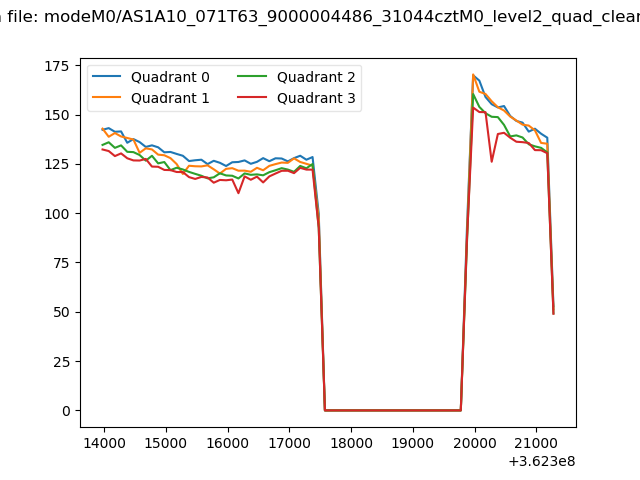 |
|
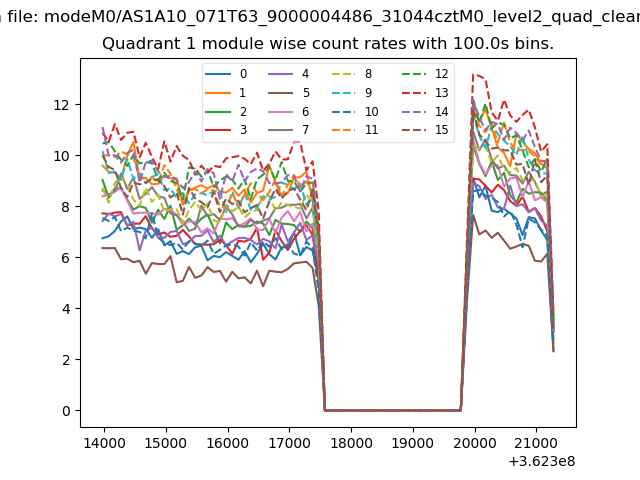
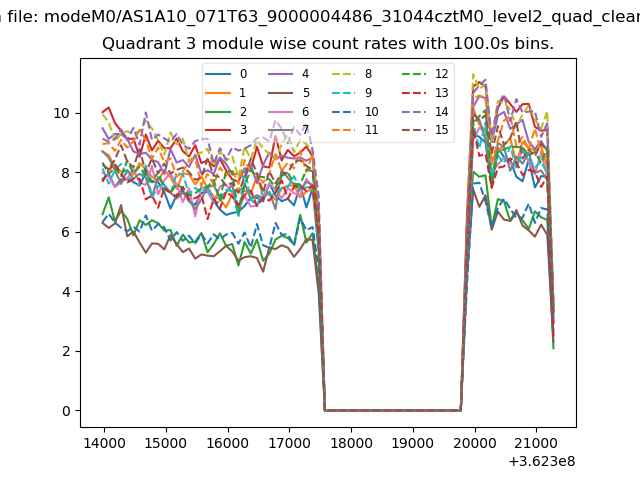
| Module-wise count rates for Quadrant A Data is divided into 100 sec bins |
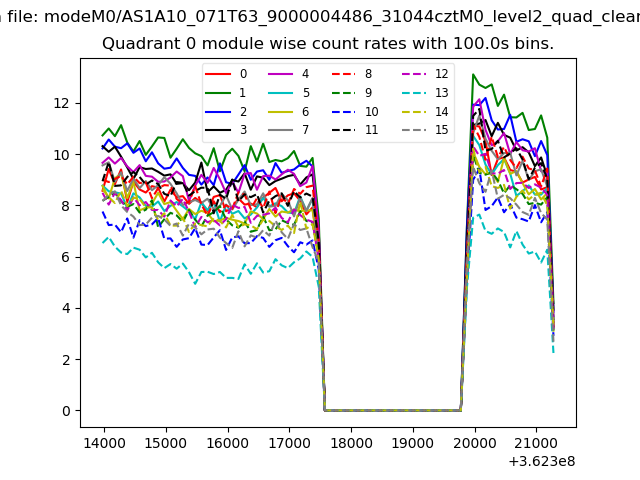 |
 |
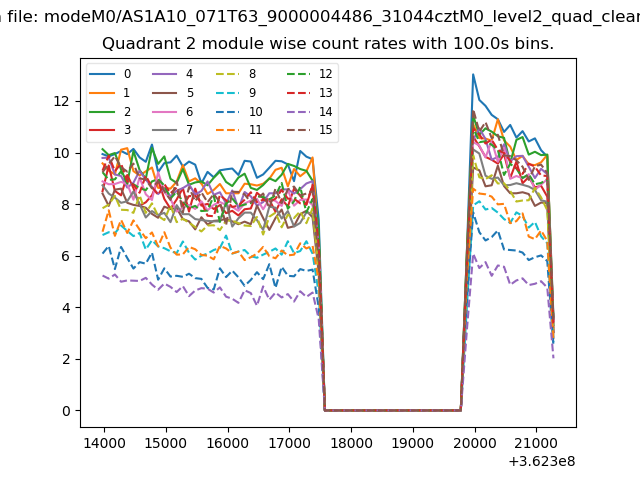
| Module-wise count rates for Quadrant B Data is divided into 100 sec bins |
 |
 |
| Module-wise count rates for Quadrant C Data is divided into 100 sec bins |
 |
 |
| Module-wise count rates for Quadrant D Data is divided into 100 sec bins |
 |
 |
| Parameter | Plot |
|---|---|
| CZT HV Monitor | 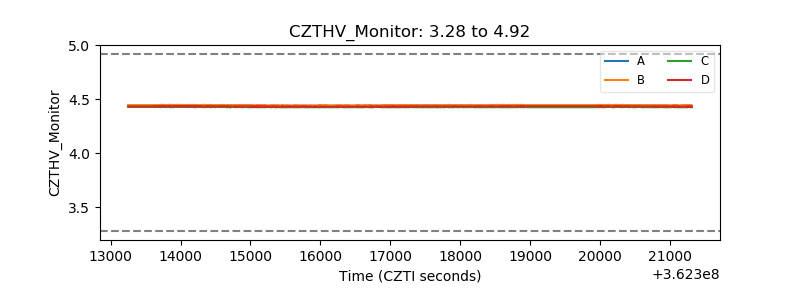 |
| D_VDD | 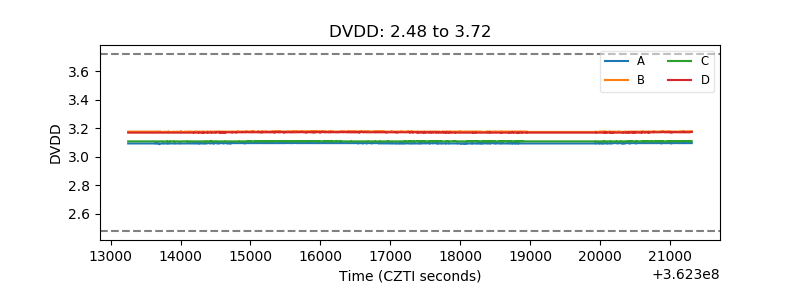 |
| Temperature 1 | 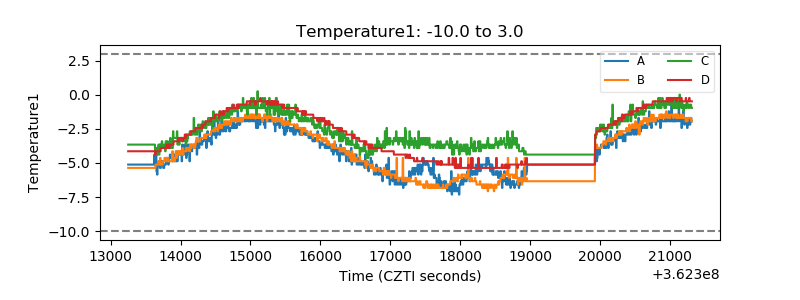 |
| Veto HV Monitor | 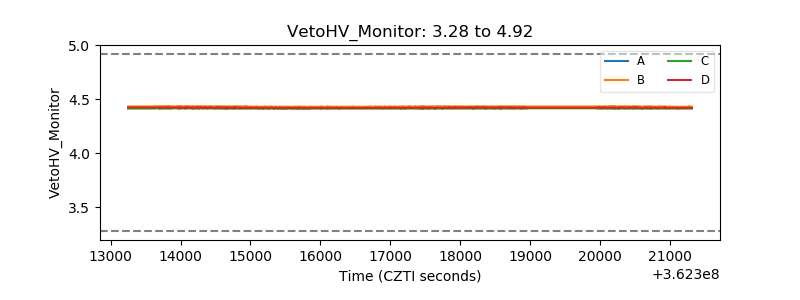 |
| Veto LLD | 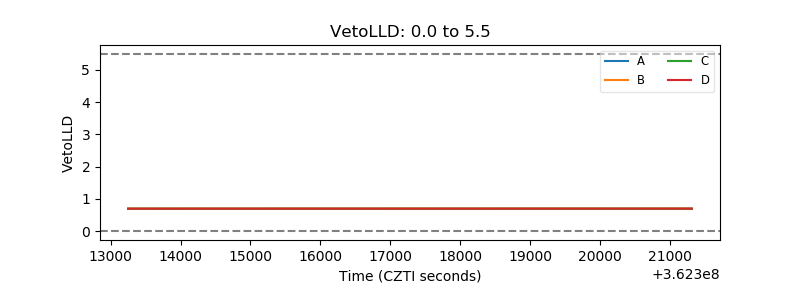 |
| Alpha Counter | 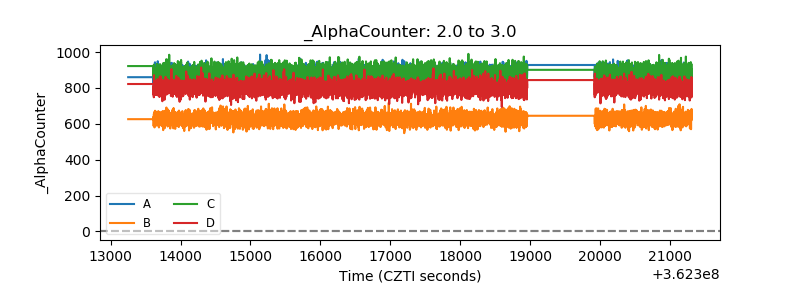 |
| _CPM_Rate | 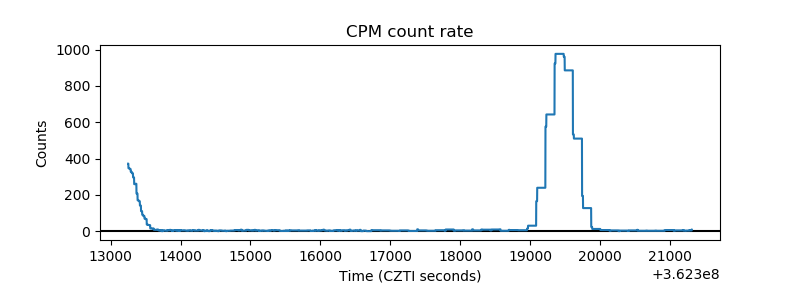 |
| CZT Counter | 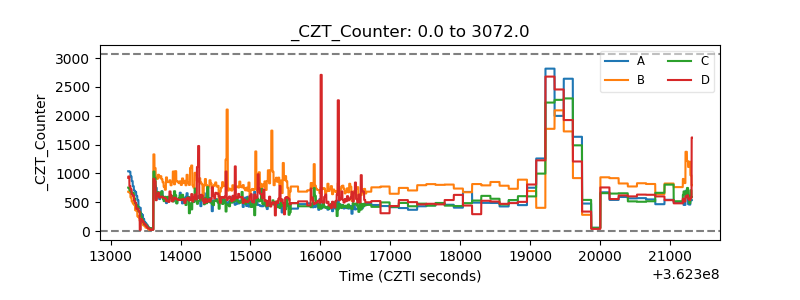 |
| +2.5 Volts monitor |  |
| +5 Volts monitor |  |
| _ROLL_ROT | 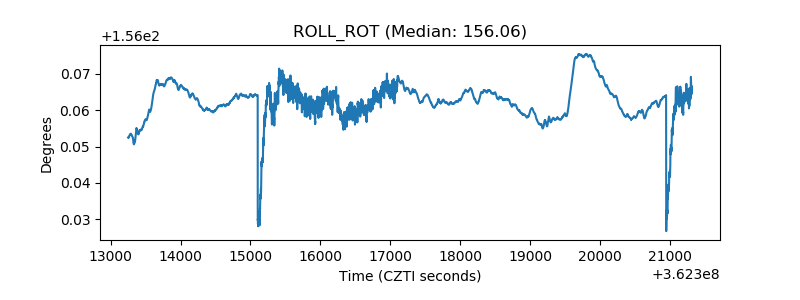 |
| _Roll_DEC | 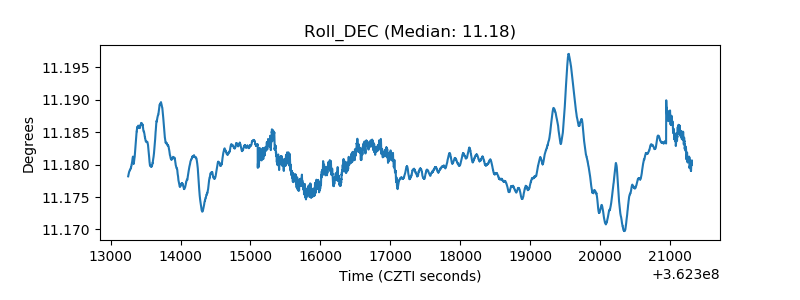 |
| _Roll_RA | 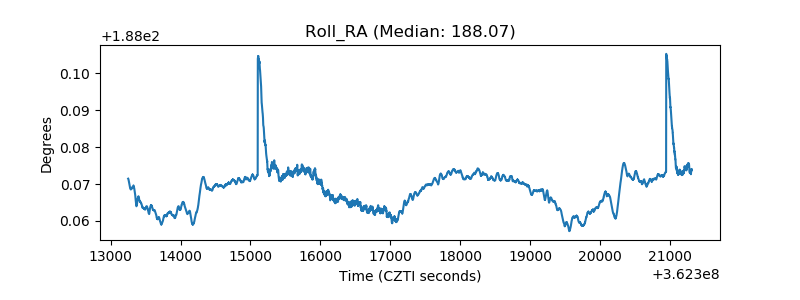 |
| Veto Counter | 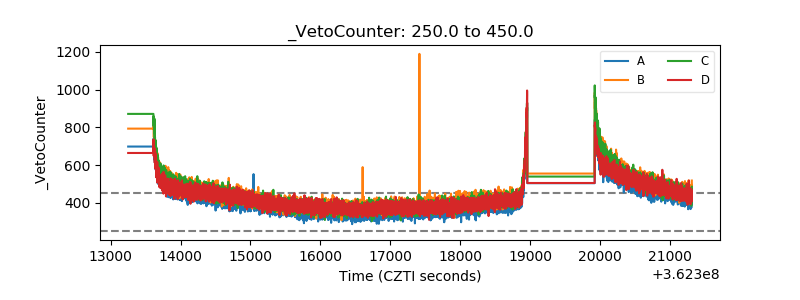 |