| Param | Original file | Final file |
|---|---|---|
| Filename | modeM0/AS1A10_071T63_9000004486_31046cztM0_level2.evt | modeM0/AS1A10_071T63_9000004486_31046cztM0_level2_quad_clean.evt |
| Size (bytes) | 535,075,200 | 97,318,080 |
| Size | 510.3 MB | 92.8 MB |
| Events in quadrant A | 3,094,490 | 651,135 |
| Events in quadrant B | 5,148,008 | 645,415 |
| Events in quadrant C | 3,397,975 | 617,612 |
| Events in quadrant D | 4,143,577 | 599,631 |
| Mode M9 | |||
|---|---|---|---|
| Quadrant | BADHDUFLAG | Total packets | Discarded packets |
| A | 0 | 11 | 0 |
| B | 0 | 11 | 0 |
| C | 0 | 11 | 0 |
| D | 0 | 11 | 0 |
| Mode SS | |||
|---|---|---|---|
| Quadrant | BADHDUFLAG | Total packets | Discarded packets |
| A | 0 | 128 | 0 |
| B | 0 | 128 | 0 |
| C | 0 | 128 | 0 |
| D | 0 | 128 | 0 |
| Mode M0 | |||
|---|---|---|---|
| Quadrant | BADHDUFLAG | Total packets | Discarded packets |
| A | 0 | 13201 | 1 |
| B | 0 | 19609 | 1 |
| C | 0 | 14131 | 1 |
| D | 0 | 16458 | 1 |
| Quadrant | Total seconds | Saturated seconds | Saturation percentage |
|---|---|---|---|
| A | 6204 | 54 | 0.870406% |
| B | 6205 | 144 | 2.320709% |
| C | 6205 | 124 | 1.998388% |
| D | 6205 | 164 | 2.643030% |
Noise dominated data is calculated using 1-second bins in cleaned event files. If a bin has >2000 counts, and if more than 50% of those come from <1% of pixels, then it is considered to be noise-dominated and hence unusable.
| Quadrant | # 1 sec bins | Bins with >0 counts | Bins with >2000 counts | High rate bins dominated by noise | Noise dominated (total time) | Noise dominated (detector-on time) | Marked lightcurve |
|---|---|---|---|---|---|---|---|
| A | 7319 | 6204 | 0 | 0 | 0.00% | 0.00% | 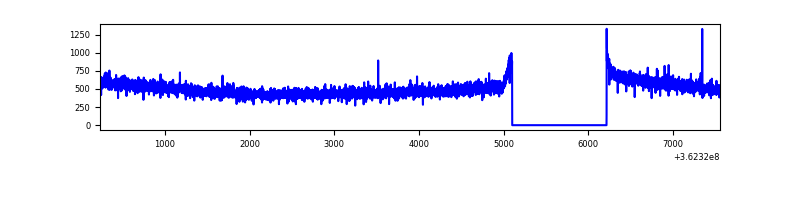 |
| B | 7320 | 6205 | 30 | 30 | 0.41% | 0.48% | 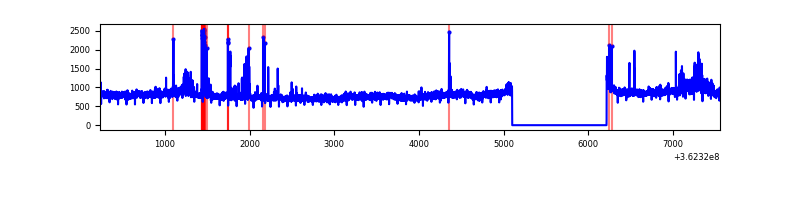 |
| C | 7319 | 6204 | 8 | 8 | 0.11% | 0.13% | 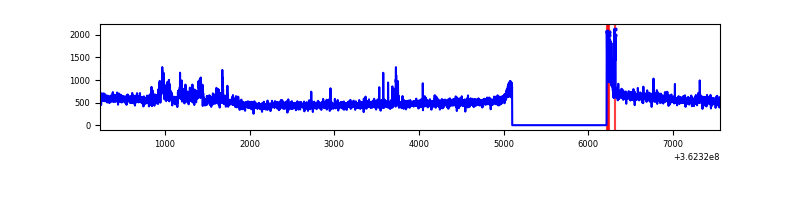 |
| D | 7320 | 6205 | 103 | 103 | 1.41% | 1.66% | 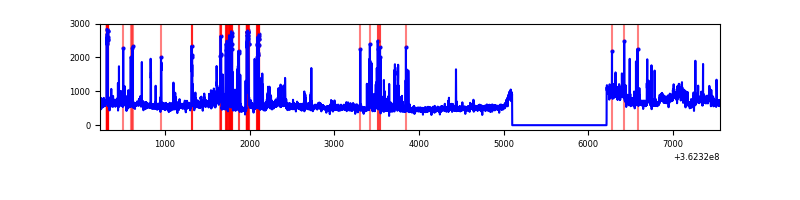 |
Top three noisy pixels from each quadrant. If the there are fewer than three noisy pixels in the level2.evt file, extra rows are filled as -1
| Pixel properties | Quadrant properties | ||||||
|---|---|---|---|---|---|---|---|
| Quadrant | DetID | PixID | Counts | Sigma | Mean | Median | Sigma |
| A | 13 | 254 | 12220 | 71.58 | 800 | 784 | 159.8 |
| A | 3 | 137 | 7891 | 44.48 | 800 | 784 | 159.8 |
| A | 0 | 226 | 6811 | 37.72 | 800 | 784 | 159.8 |
| B | 6 | 159 | 1727219 | 11461.75 | 783 | 763 | 150.6 |
| B | 0 | 155 | 121097 | 798.88 | 783 | 763 | 150.6 |
| B | 5 | 172 | 98585 | 649.43 | 783 | 763 | 150.6 |
| C | 3 | 233 | 189902 | 1063.11 | 760 | 766 | 177.9 |
| C | 14 | 238 | 123390 | 689.25 | 760 | 766 | 177.9 |
| C | 0 | 10 | 73772 | 410.36 | 760 | 766 | 177.9 |
| D | 8 | 195 | 763049 | 4157.6 | 768 | 748 | 183.4 |
| D | 13 | 249 | 236899 | 1287.97 | 768 | 748 | 183.4 |
| D | 2 | 250 | 118627 | 642.91 | 768 | 748 | 183.4 |
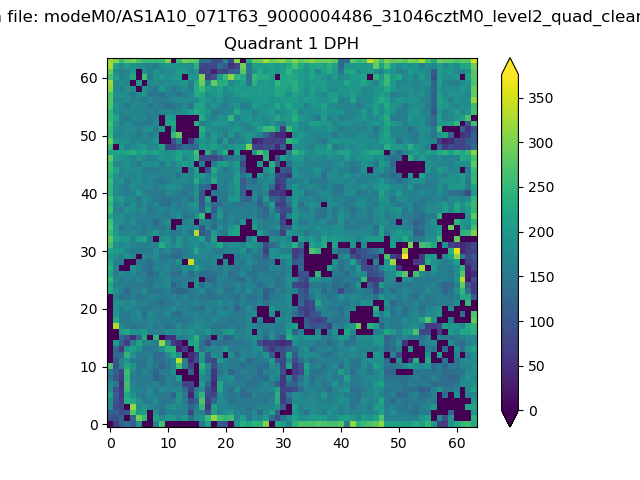
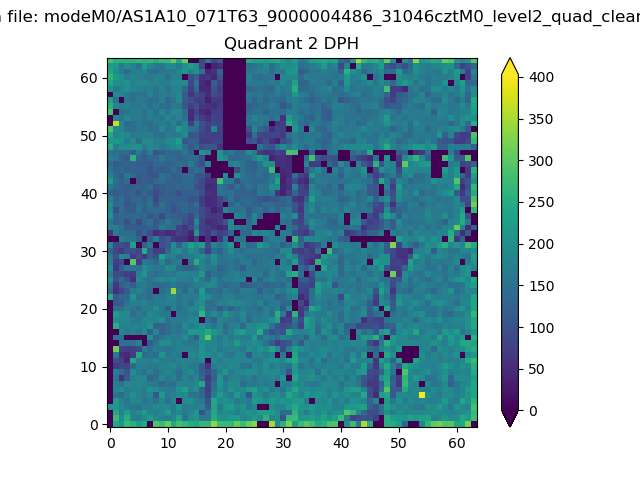
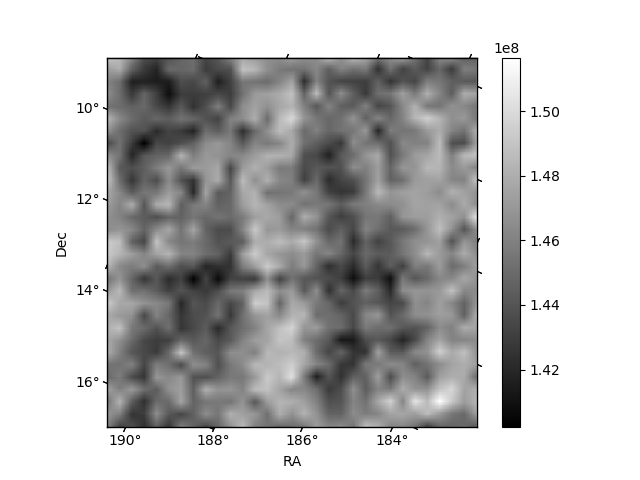
Histogram calculated using DETX and DETY for each event in the final _common_clean file
| Quadrant A |  |
 |
Quadrant B |
|---|---|---|---|
| Quadrant D | 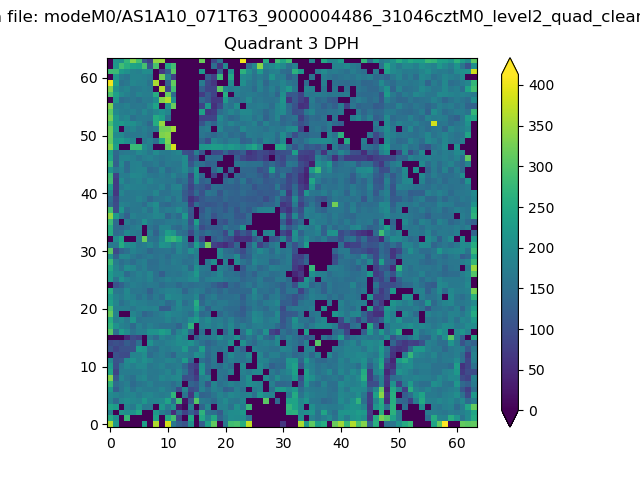 |
 |
Quadrant C |
| Plot type | Count rate plots | Images |
|---|---|---|
| Comparison with Poisson distribution Blue bars denote a histogram of data divided into 1 sec bins. Red curve is a Poisson curve with rate = median count rate of data. |
 |
 |
| Quadrant-wise count rates Data is divided into 100 sec bins |
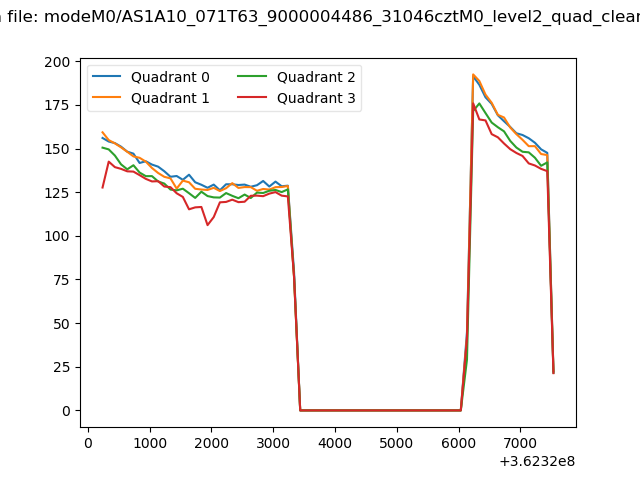 |
|
| Module-wise count rates for Quadrant A Data is divided into 100 sec bins |
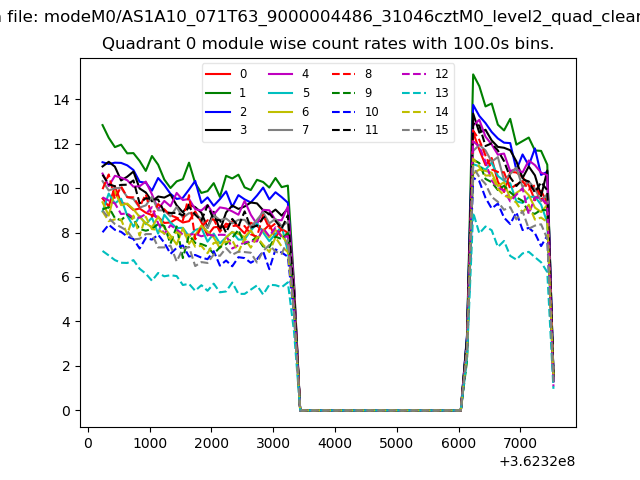 |
 |
| Module-wise count rates for Quadrant B Data is divided into 100 sec bins |
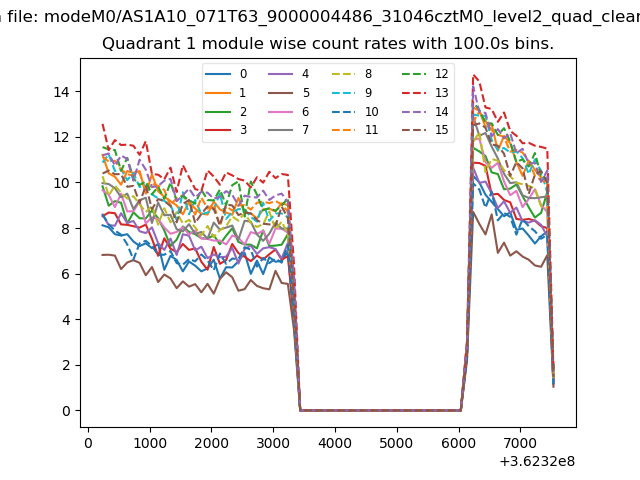 |
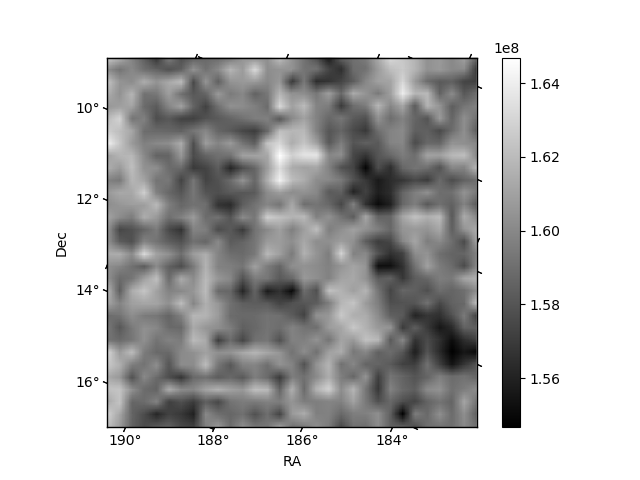 |
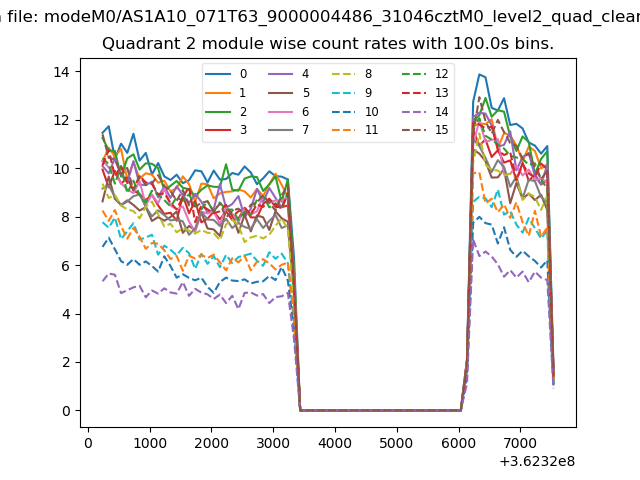
| Module-wise count rates for Quadrant C Data is divided into 100 sec bins |
 |
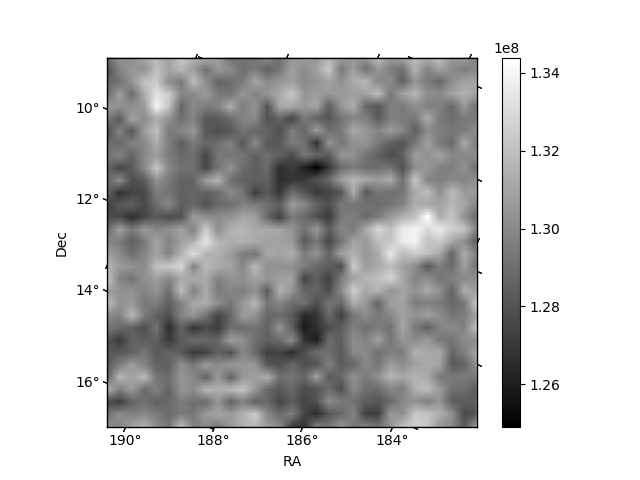 |
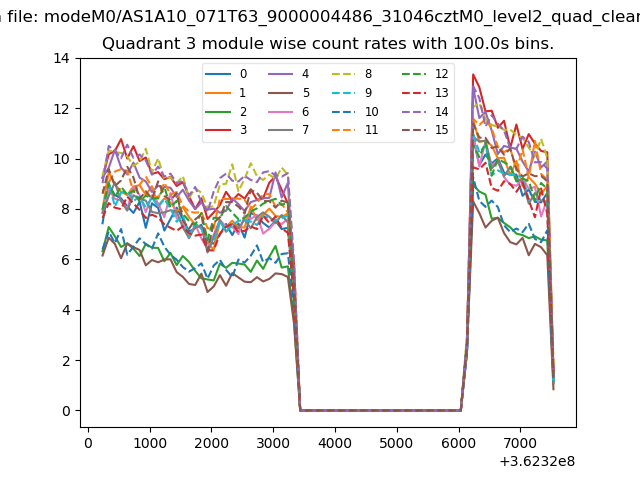
| Module-wise count rates for Quadrant D Data is divided into 100 sec bins |
 |
 |
| Parameter | Plot |
|---|---|
| CZT HV Monitor | 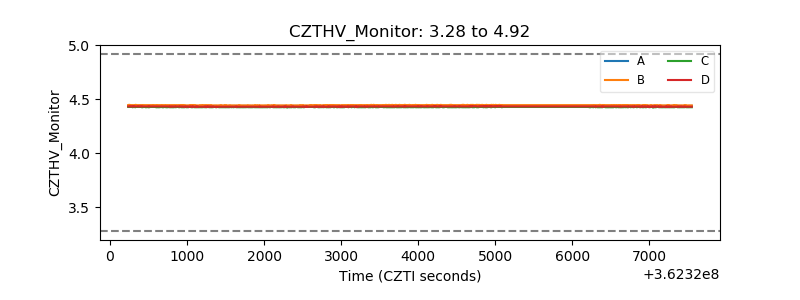 |
| D_VDD | 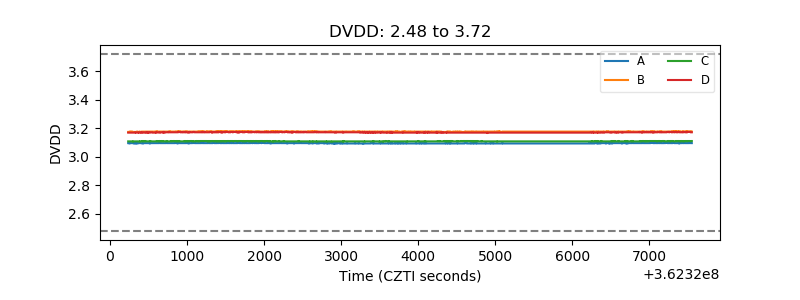 |
| Temperature 1 | 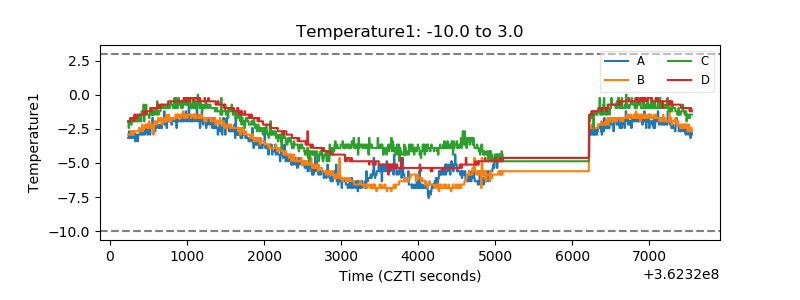 |
| Veto HV Monitor | 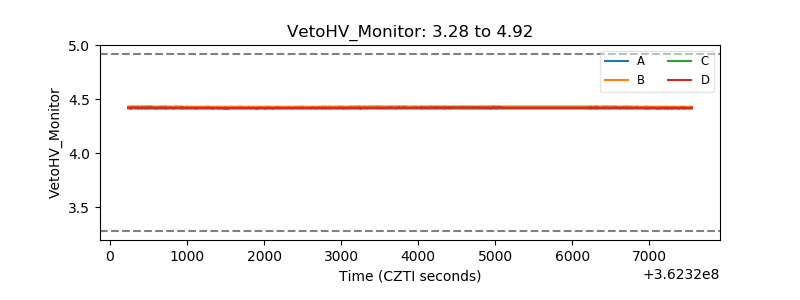 |
| Veto LLD |  |
| Alpha Counter | 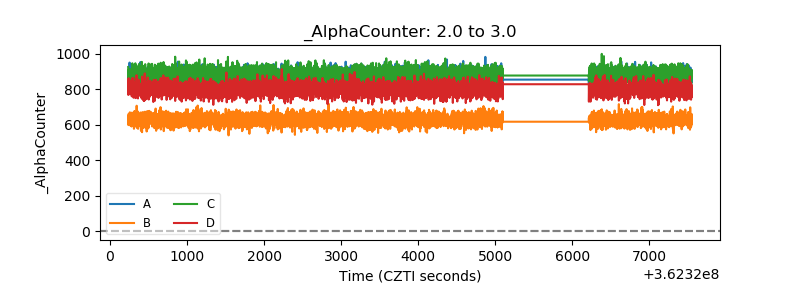 |
| _CPM_Rate | 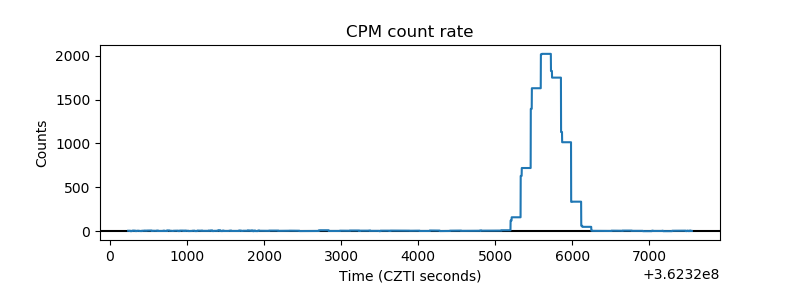 |
| CZT Counter | 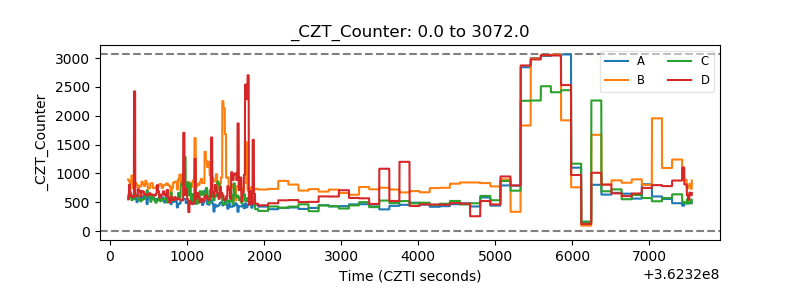 |
| +2.5 Volts monitor |  |
| +5 Volts monitor |  |
| _ROLL_ROT | 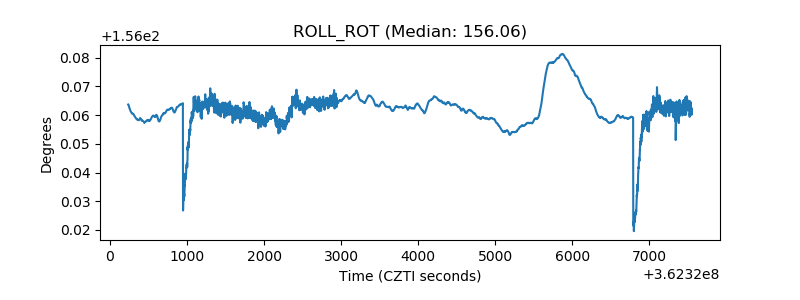 |
| _Roll_DEC | 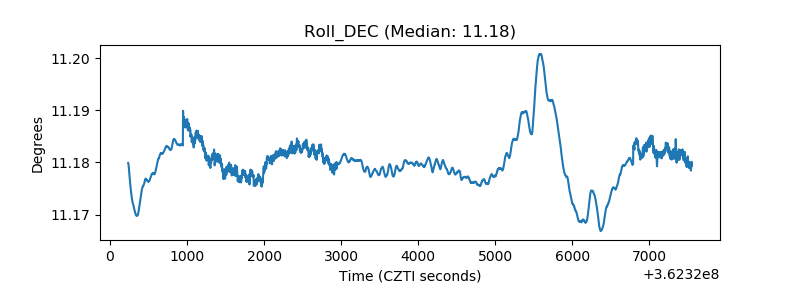 |
| _Roll_RA | 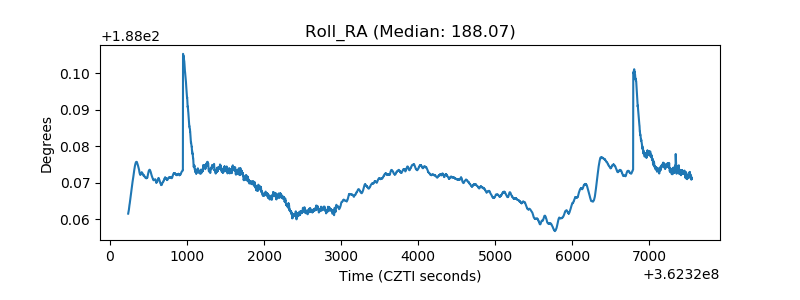 |
| Veto Counter | 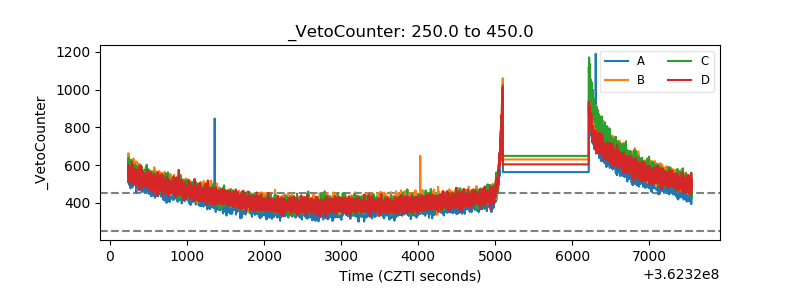 |