| Param | Original file | Final file |
|---|---|---|
| Filename | modeM0/AS1A10_071T63_9000004486_31047cztM0_level2.evt | modeM0/AS1A10_071T63_9000004486_31047cztM0_level2_quad_clean.evt |
| Size (bytes) | 579,916,800 | 101,278,080 |
| Size | 553.1 MB | 96.6 MB |
| Events in quadrant A | 3,285,365 | 681,404 |
| Events in quadrant B | 5,573,295 | 677,901 |
| Events in quadrant C | 3,520,532 | 643,720 |
| Events in quadrant D | 4,757,915 | 624,866 |
| Mode M9 | |||
|---|---|---|---|
| Quadrant | BADHDUFLAG | Total packets | Discarded packets |
| A | 0 | 14 | 0 |
| B | 0 | 15 | 0 |
| C | 0 | 15 | 0 |
| D | 0 | 15 | 0 |
| Mode SS | |||
|---|---|---|---|
| Quadrant | BADHDUFLAG | Total packets | Discarded packets |
| A | 0 | 126 | 0 |
| B | 0 | 126 | 0 |
| C | 0 | 126 | 0 |
| D | 0 | 126 | 0 |
| Mode M0 | |||
|---|---|---|---|
| Quadrant | BADHDUFLAG | Total packets | Discarded packets |
| A | 0 | 13856 | 2 |
| B | 0 | 20888 | 2 |
| C | 0 | 14560 | 2 |
| D | 0 | 18623 | 4 |
| Quadrant | Total seconds | Saturated seconds | Saturation percentage |
|---|---|---|---|
| A | 6306 | 53 | 0.840469% |
| B | 6306 | 175 | 2.775135% |
| C | 6306 | 187 | 2.965430% |
| D | 6305 | 84 | 1.332276% |
Noise dominated data is calculated using 1-second bins in cleaned event files. If a bin has >2000 counts, and if more than 50% of those come from <1% of pixels, then it is considered to be noise-dominated and hence unusable.
| Quadrant | # 1 sec bins | Bins with >0 counts | Bins with >2000 counts | High rate bins dominated by noise | Noise dominated (total time) | Noise dominated (detector-on time) | Marked lightcurve |
|---|---|---|---|---|---|---|---|
| A | 7525 | 6305 | 0 | 0 | 0.00% | 0.00% | 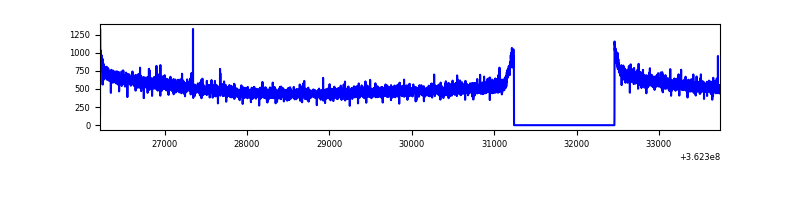 |
| B | 7525 | 6305 | 14 | 14 | 0.19% | 0.22% | 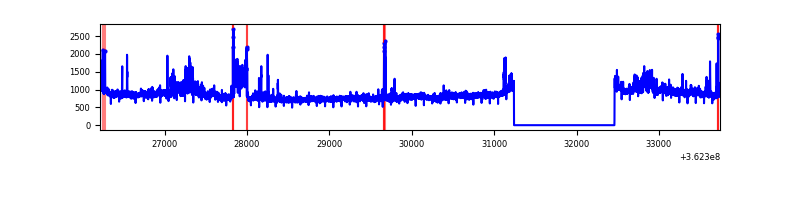 |
| C | 7526 | 6306 | 19 | 19 | 0.25% | 0.30% | 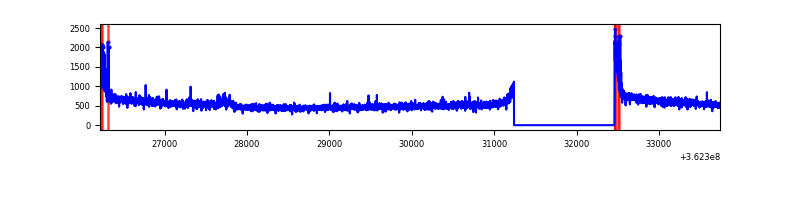 |
| D | 7524 | 6304 | 25 | 25 | 0.33% | 0.40% | 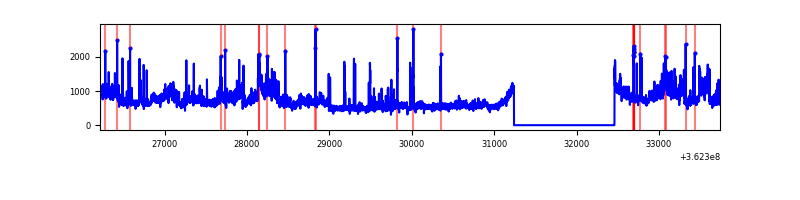 |
Top three noisy pixels from each quadrant. If the there are fewer than three noisy pixels in the level2.evt file, extra rows are filled as -1
| Pixel properties | Quadrant properties | ||||||
|---|---|---|---|---|---|---|---|
| Quadrant | DetID | PixID | Counts | Sigma | Mean | Median | Sigma |
| A | 13 | 254 | 12343 | 68.28 | 850 | 834 | 168.6 |
| A | 3 | 137 | 7990 | 42.45 | 850 | 834 | 168.6 |
| A | 0 | 226 | 7443 | 39.21 | 850 | 834 | 168.6 |
| B | 6 | 159 | 1799477 | 11395.78 | 837 | 817 | 157.8 |
| B | 0 | 155 | 139955 | 881.53 | 837 | 817 | 157.8 |
| B | 4 | 80 | 120291 | 756.95 | 837 | 817 | 157.8 |
| C | 0 | 10 | 153109 | 808.26 | 806 | 813 | 188.4 |
| C | 14 | 238 | 129765 | 684.37 | 806 | 813 | 188.4 |
| C | 3 | 233 | 42107 | 219.15 | 806 | 813 | 188.4 |
| D | 8 | 195 | 1417990 | 7367.21 | 818 | 798 | 192.4 |
| D | 1 | 52 | 75416 | 387.9 | 818 | 798 | 192.4 |
| D | 2 | 250 | 54665 | 280.03 | 818 | 798 | 192.4 |
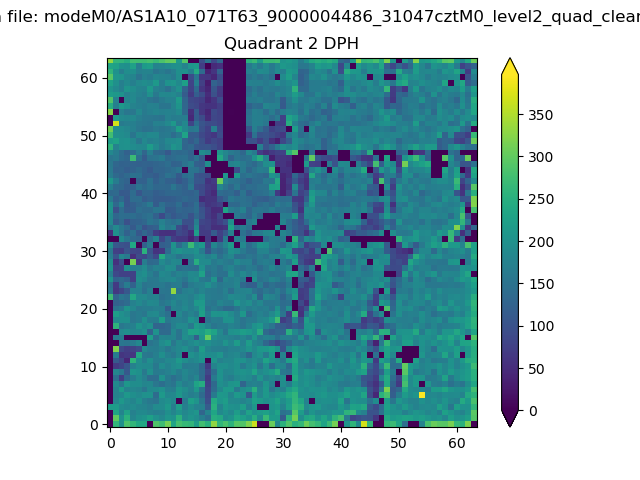
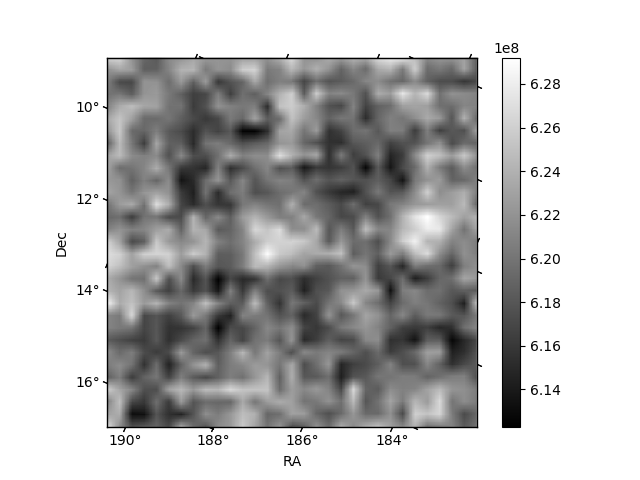
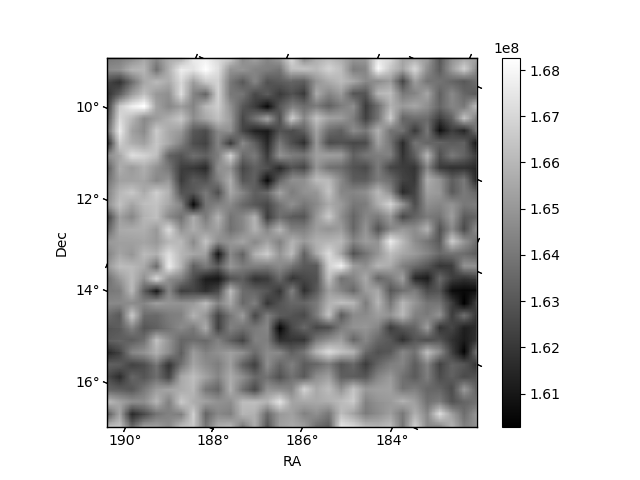
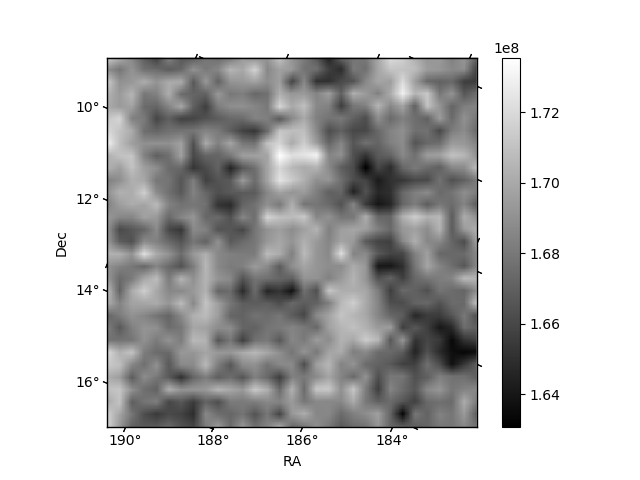
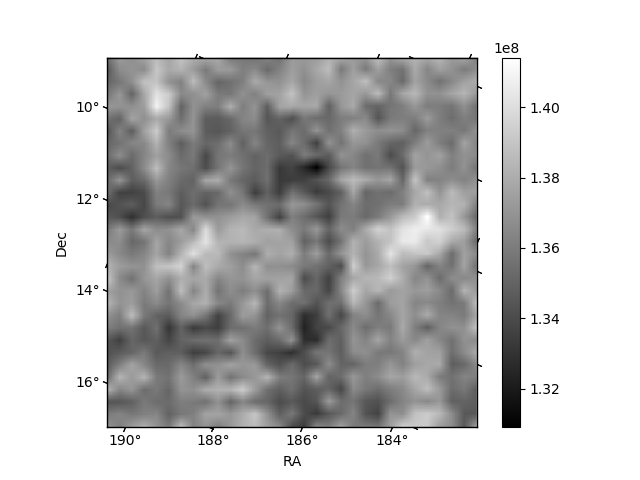
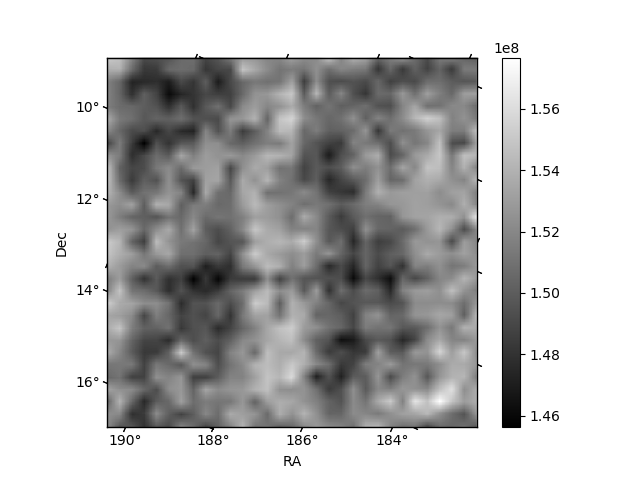
Histogram calculated using DETX and DETY for each event in the final _common_clean file
| Quadrant A | 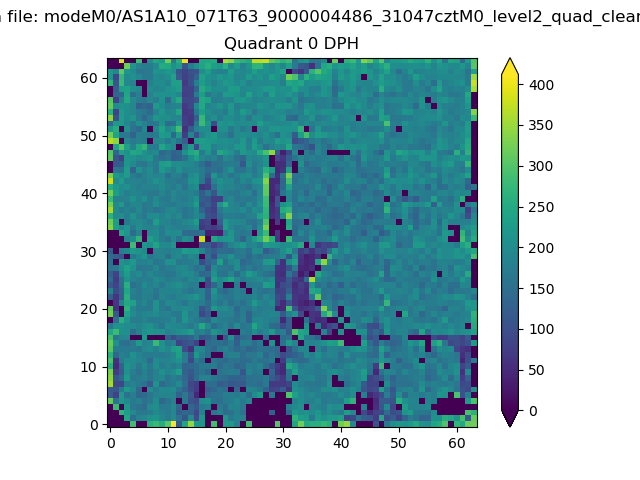 |
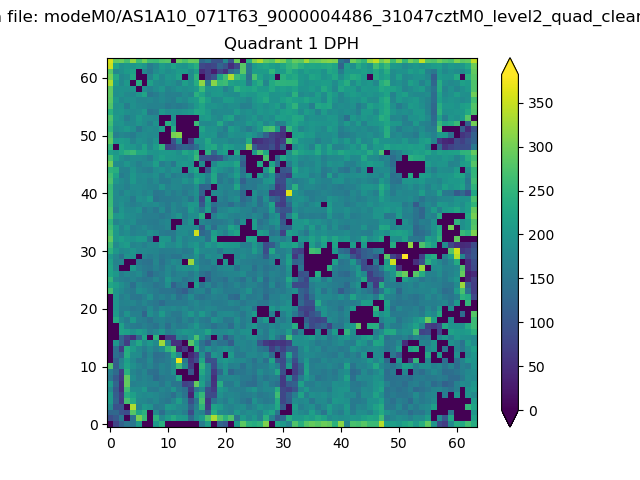 |
Quadrant B |
|---|---|---|---|
| Quadrant D | 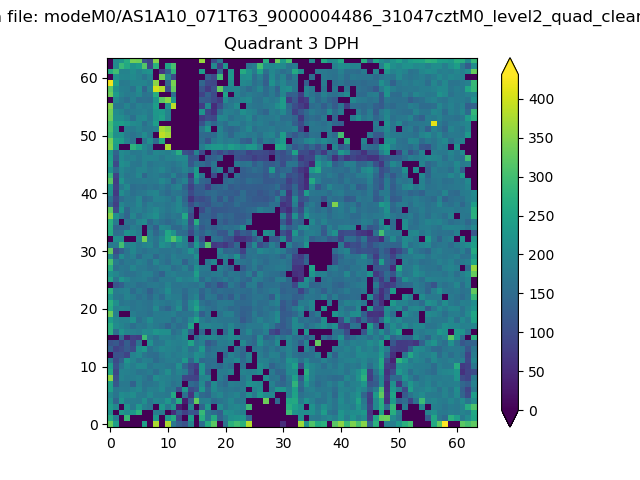 |
 |
Quadrant C |
| Plot type | Count rate plots | Images |
|---|---|---|
| Comparison with Poisson distribution Blue bars denote a histogram of data divided into 1 sec bins. Red curve is a Poisson curve with rate = median count rate of data. |
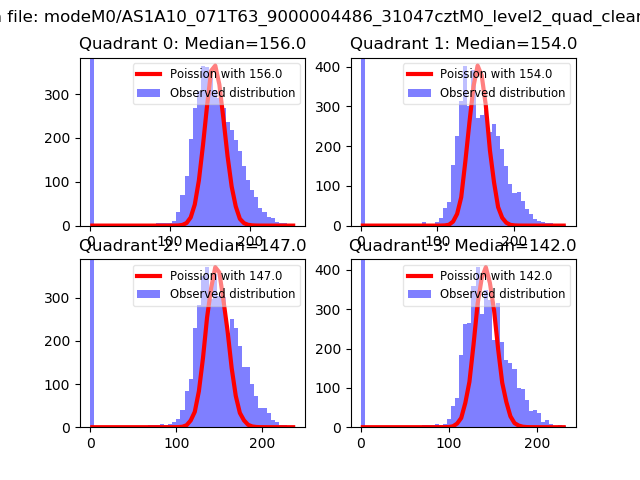 |
 |
| Quadrant-wise count rates Data is divided into 100 sec bins |
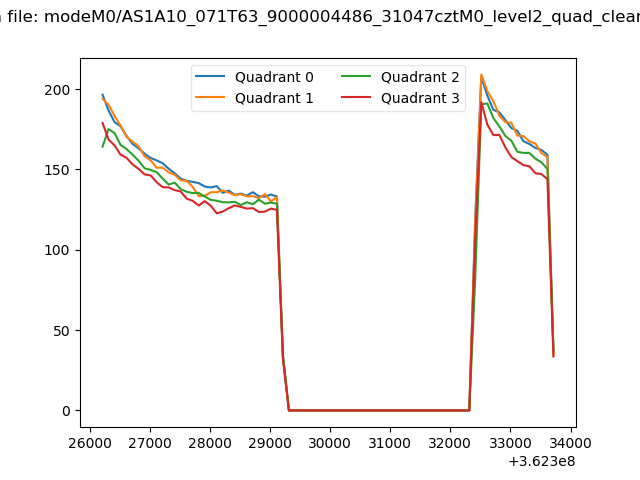 |
|
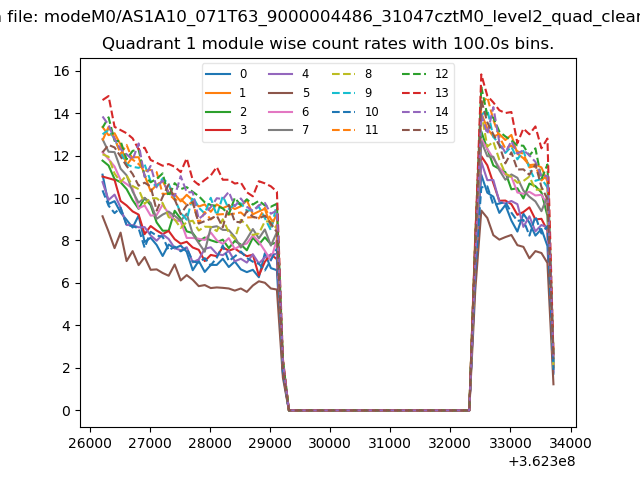
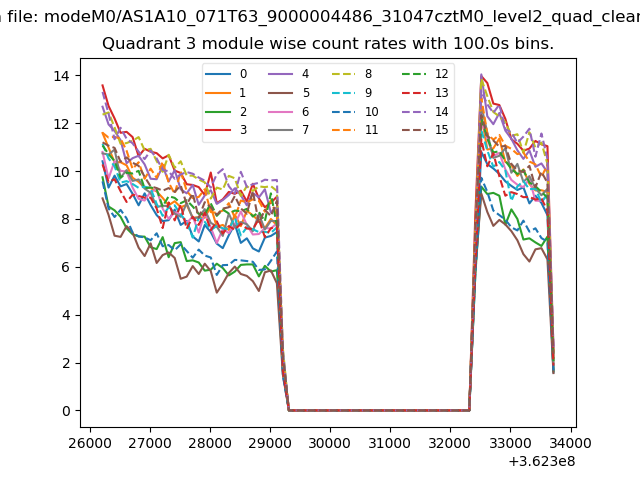
| Module-wise count rates for Quadrant A Data is divided into 100 sec bins |
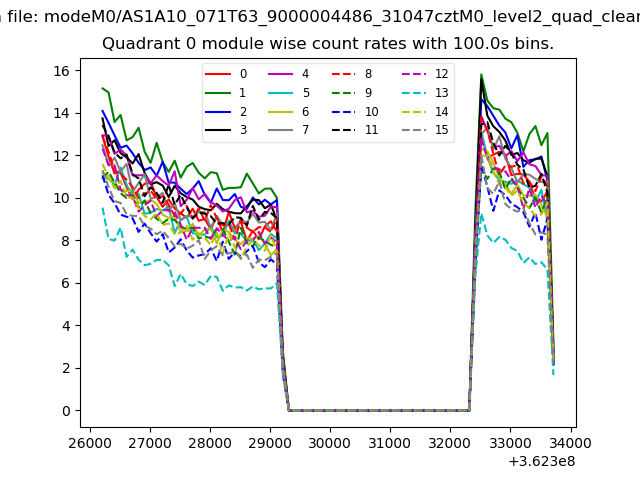 |
 |
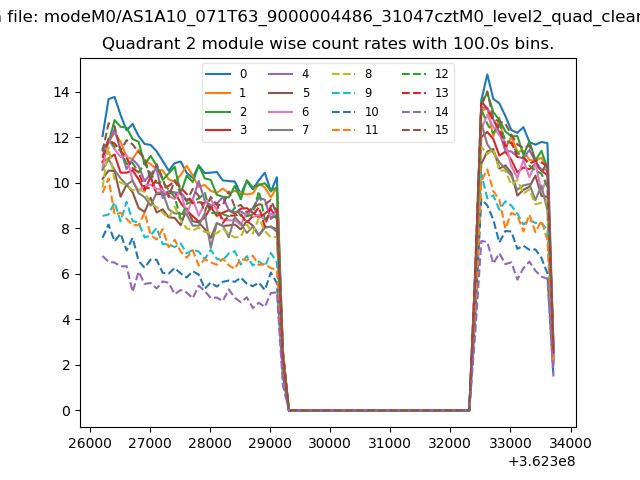
| Module-wise count rates for Quadrant B Data is divided into 100 sec bins |
 |
 |
| Module-wise count rates for Quadrant C Data is divided into 100 sec bins |
 |
 |
| Module-wise count rates for Quadrant D Data is divided into 100 sec bins |
 |
 |
| Parameter | Plot |
|---|---|
| CZT HV Monitor | 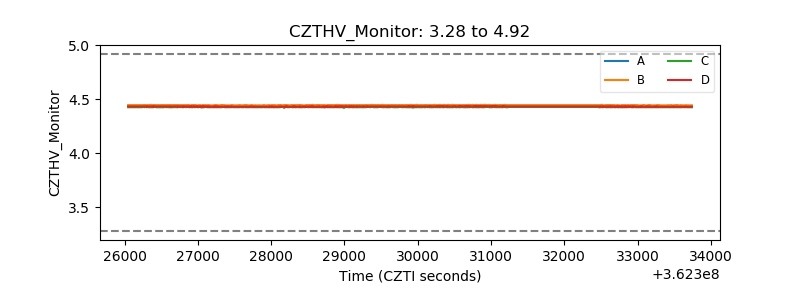 |
| D_VDD | 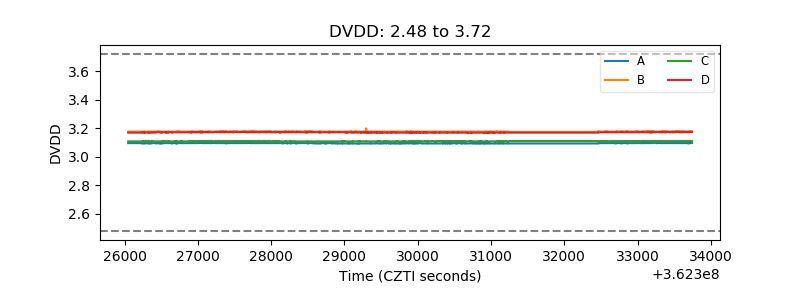 |
| Temperature 1 | 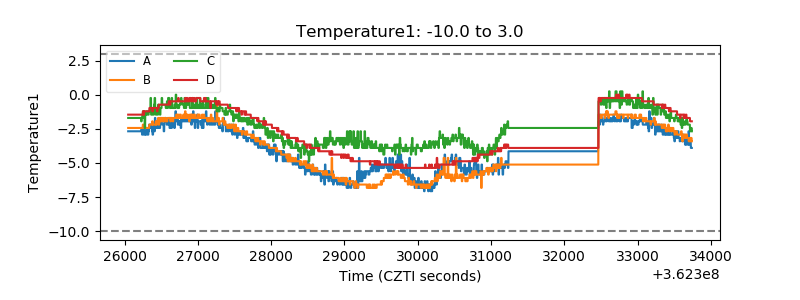 |
| Veto HV Monitor | 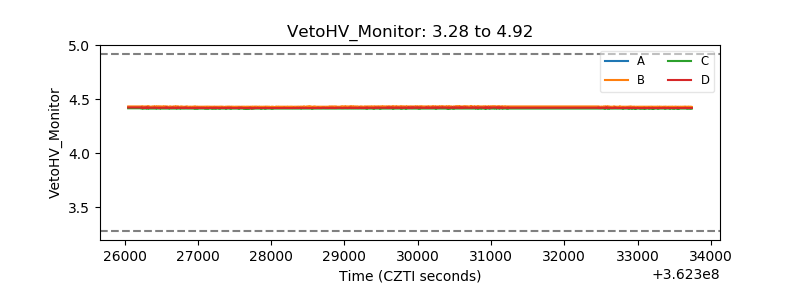 |
| Veto LLD | 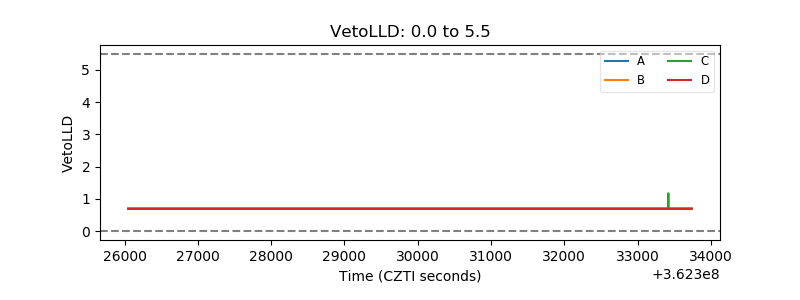 |
| Alpha Counter | 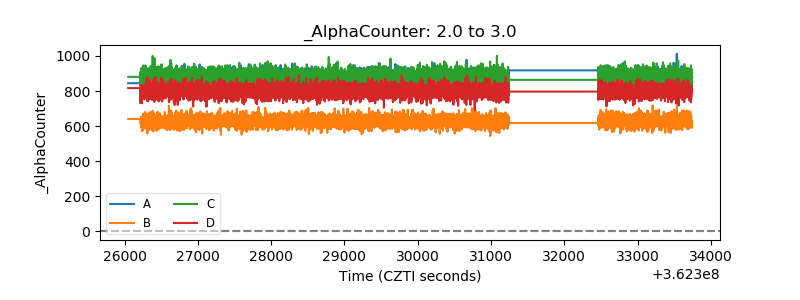 |
| _CPM_Rate | 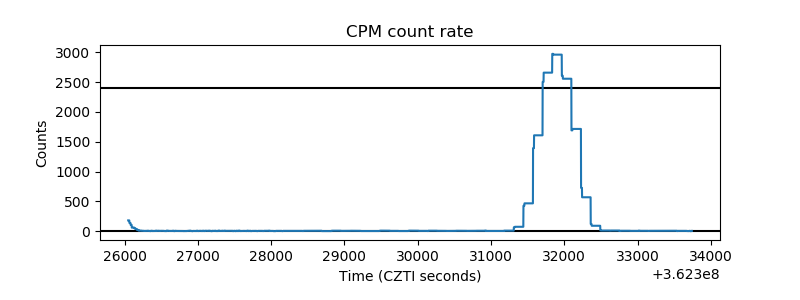 |
| CZT Counter | 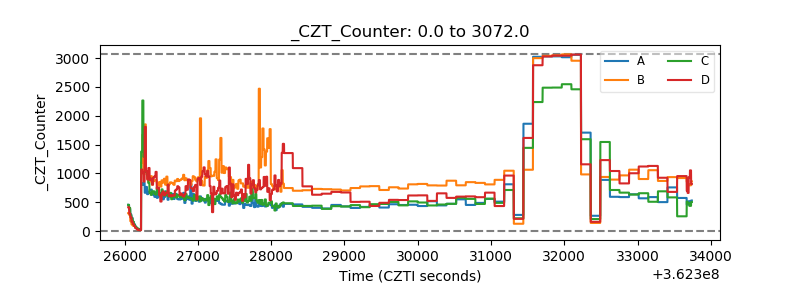 |
| +2.5 Volts monitor |  |
| +5 Volts monitor |  |
| _ROLL_ROT | 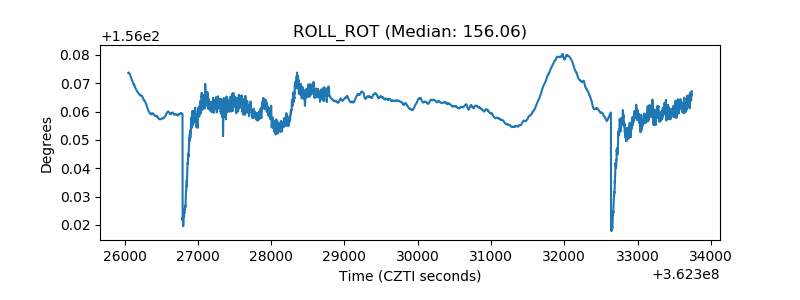 |
| _Roll_DEC | 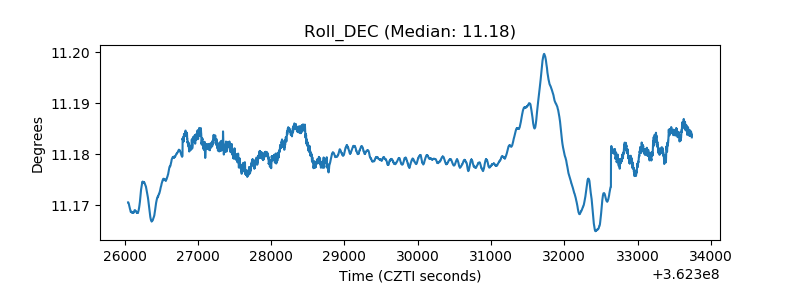 |
| _Roll_RA | 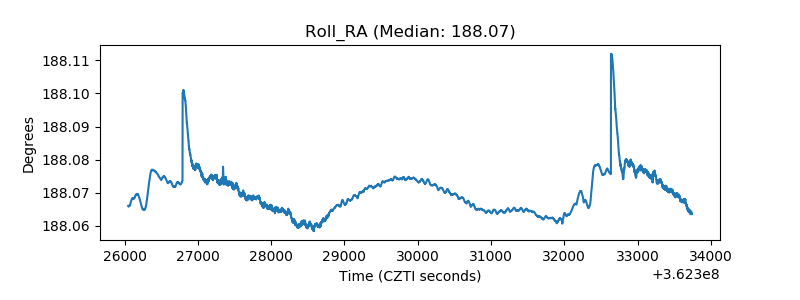 |
| Veto Counter | 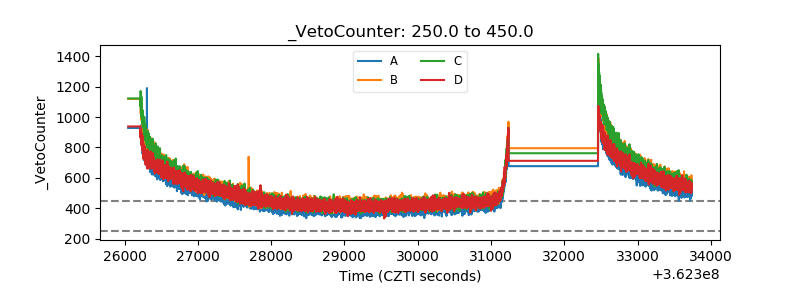 |