| Param | Original file | Final file |
|---|---|---|
| Filename | modeM0/AS1A10_071T63_9000004486_31048cztM0_level2.evt | modeM0/AS1A10_071T63_9000004486_31048cztM0_level2_quad_clean.evt |
| Size (bytes) | 570,703,680 | 93,971,520 |
| Size | 544.3 MB | 89.6 MB |
| Events in quadrant A | 3,188,864 | 629,913 |
| Events in quadrant B | 5,375,713 | 628,455 |
| Events in quadrant C | 3,363,251 | 597,530 |
| Events in quadrant D | 4,946,727 | 567,355 |
| Mode M9 | |||
|---|---|---|---|
| Quadrant | BADHDUFLAG | Total packets | Discarded packets |
| A | 0 | 13 | 0 |
| B | 0 | 13 | 0 |
| C | 0 | 13 | 0 |
| D | 0 | 13 | 0 |
| Mode SS | |||
|---|---|---|---|
| Quadrant | BADHDUFLAG | Total packets | Discarded packets |
| A | 0 | 122 | 0 |
| B | 0 | 122 | 0 |
| C | 0 | 122 | 0 |
| D | 0 | 122 | 0 |
| Mode M0 | |||
|---|---|---|---|
| Quadrant | BADHDUFLAG | Total packets | Discarded packets |
| A | 0 | 13259 | 1 |
| B | 0 | 20070 | 1 |
| C | 0 | 13742 | 1 |
| D | 0 | 18707 | 1 |
| Quadrant | Total seconds | Saturated seconds | Saturation percentage |
|---|---|---|---|
| A | 6055 | 39 | 0.644096% |
| B | 6056 | 138 | 2.278732% |
| C | 6056 | 144 | 2.377807% |
| D | 6055 | 131 | 2.163501% |
Noise dominated data is calculated using 1-second bins in cleaned event files. If a bin has >2000 counts, and if more than 50% of those come from <1% of pixels, then it is considered to be noise-dominated and hence unusable.
| Quadrant | # 1 sec bins | Bins with >0 counts | Bins with >2000 counts | High rate bins dominated by noise | Noise dominated (total time) | Noise dominated (detector-on time) | Marked lightcurve |
|---|---|---|---|---|---|---|---|
| A | 7394 | 6054 | 0 | 0 | 0.00% | 0.00% | 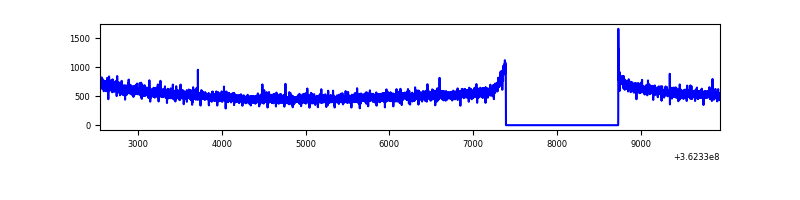 |
| B | 7395 | 6055 | 33 | 33 | 0.45% | 0.55% | 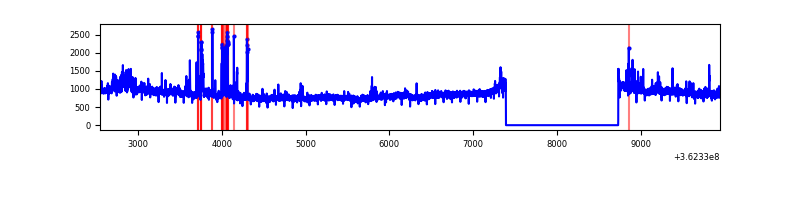 |
| C | 7395 | 6055 | 19 | 19 | 0.26% | 0.31% | 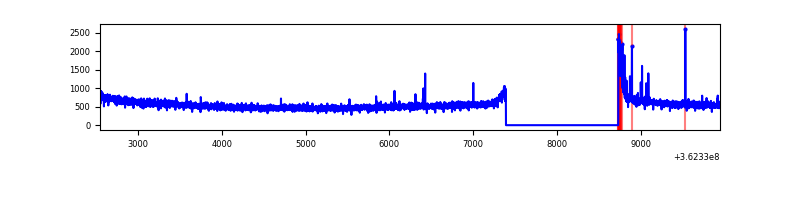 |
| D | 7394 | 6054 | 113 | 113 | 1.53% | 1.87% | 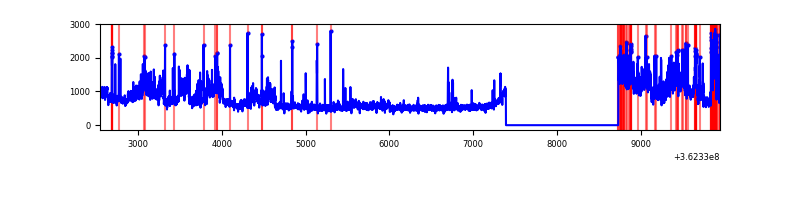 |
Top three noisy pixels from each quadrant. If the there are fewer than three noisy pixels in the level2.evt file, extra rows are filled as -1
| Pixel properties | Quadrant properties | ||||||
|---|---|---|---|---|---|---|---|
| Quadrant | DetID | PixID | Counts | Sigma | Mean | Median | Sigma |
| A | 13 | 254 | 10907 | 61.86 | 826 | 813 | 163.2 |
| A | 3 | 137 | 7591 | 41.54 | 826 | 813 | 163.2 |
| A | 0 | 226 | 7054 | 38.25 | 826 | 813 | 163.2 |
| B | 6 | 159 | 1786116 | 11677.9 | 817 | 798 | 152.9 |
| B | 4 | 52 | 91988 | 596.48 | 817 | 798 | 152.9 |
| B | 5 | 172 | 72990 | 472.21 | 817 | 798 | 152.9 |
| C | 14 | 238 | 128191 | 696.22 | 788 | 796 | 183.0 |
| C | 0 | 10 | 111535 | 605.19 | 788 | 796 | 183.0 |
| C | 1 | 16 | 23513 | 124.15 | 788 | 796 | 183.0 |
| D | 8 | 195 | 1340076 | 7198.72 | 791 | 772 | 186.0 |
| D | 1 | 52 | 311198 | 1668.53 | 791 | 772 | 186.0 |
| D | 13 | 249 | 159852 | 855.05 | 791 | 772 | 186.0 |
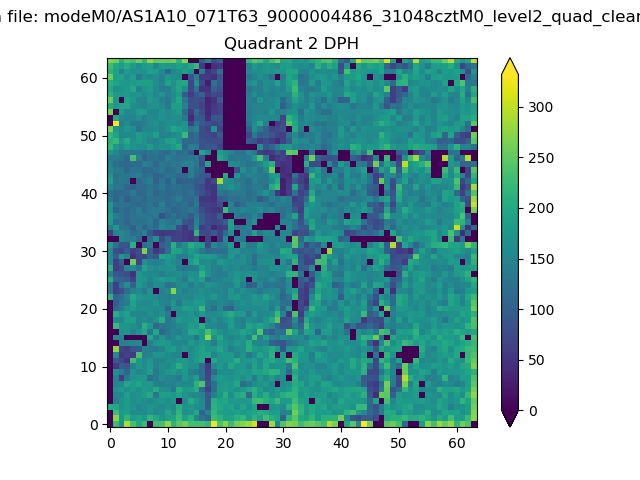
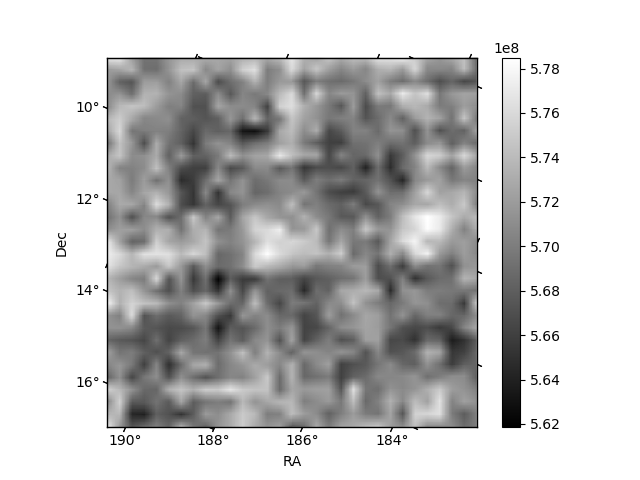
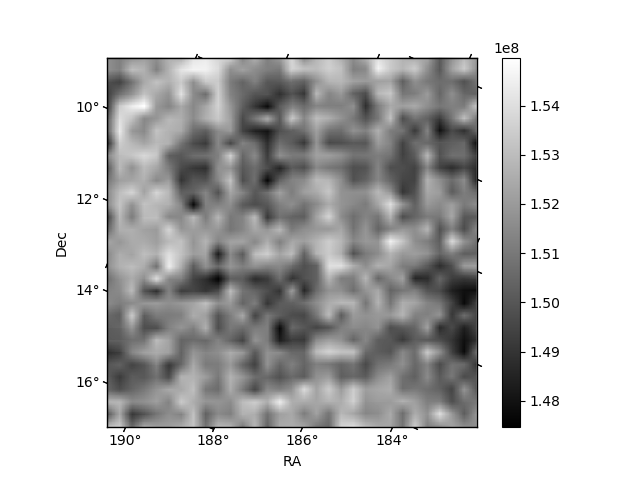
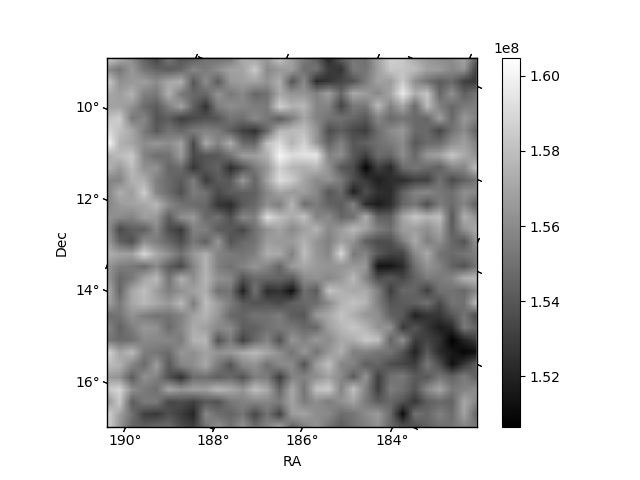
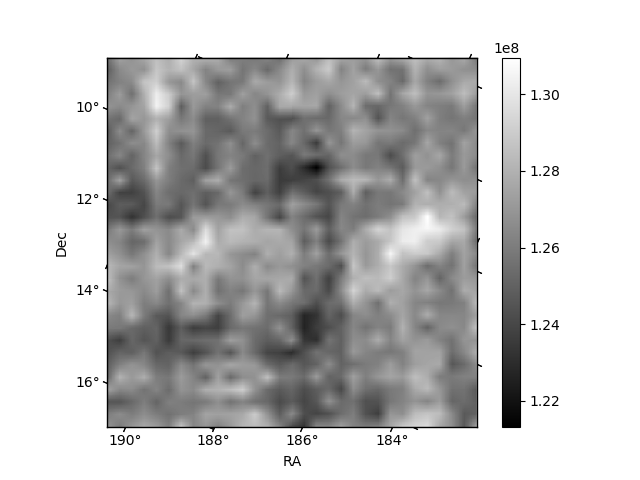
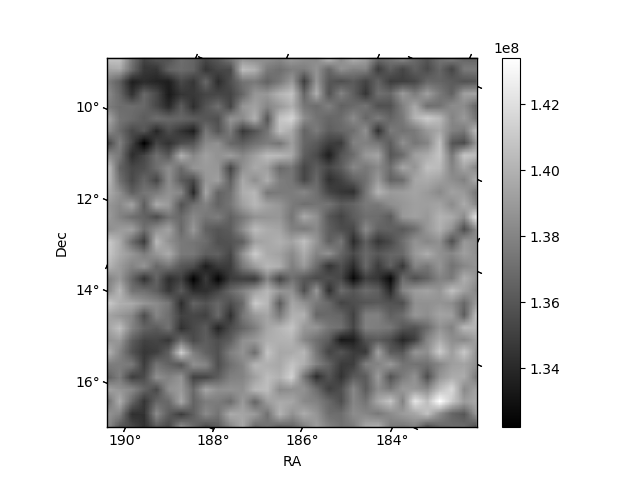
Histogram calculated using DETX and DETY for each event in the final _common_clean file
| Quadrant A | 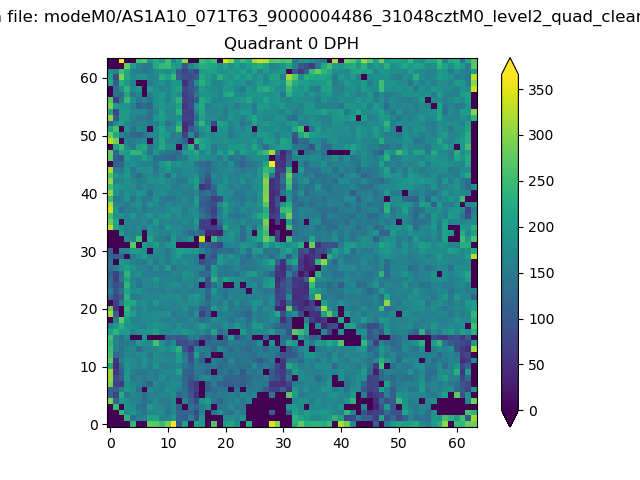 |
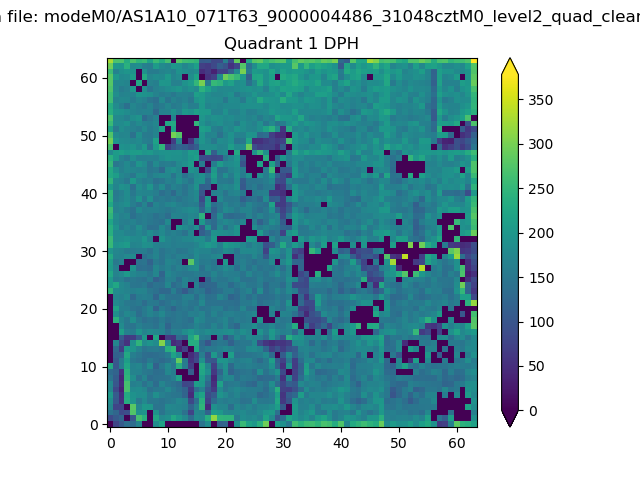 |
Quadrant B |
|---|---|---|---|
| Quadrant D | 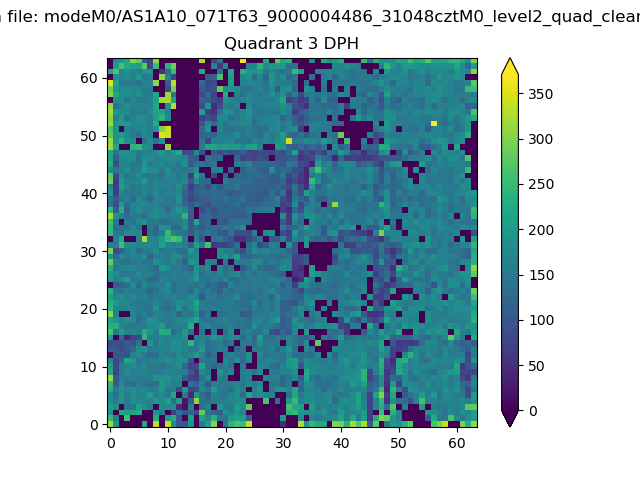 |
 |
Quadrant C |
| Plot type | Count rate plots | Images |
|---|---|---|
| Comparison with Poisson distribution Blue bars denote a histogram of data divided into 1 sec bins. Red curve is a Poisson curve with rate = median count rate of data. |
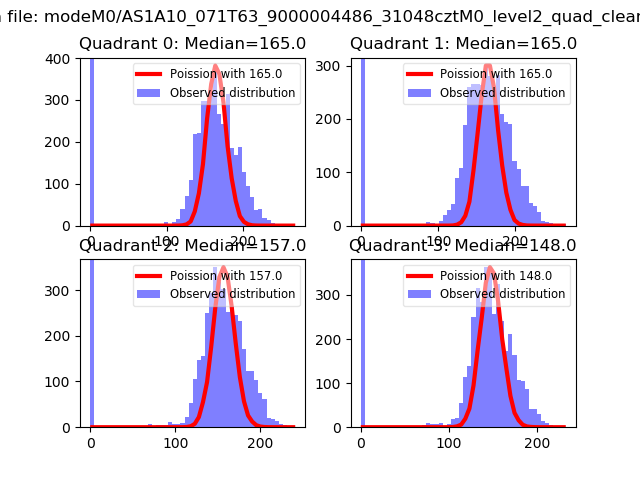 |
 |
| Quadrant-wise count rates Data is divided into 100 sec bins |
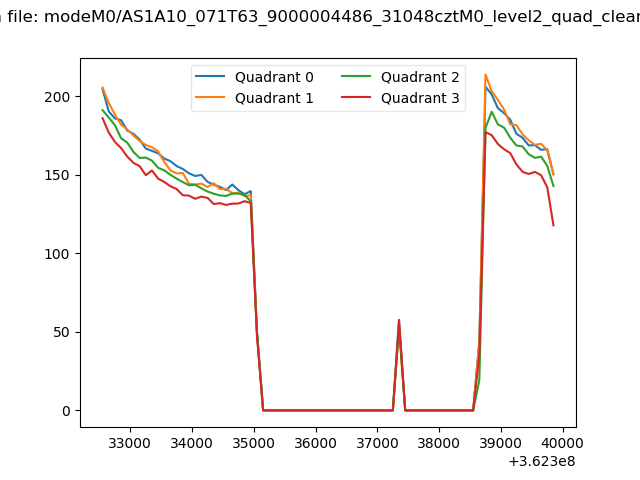 |
|
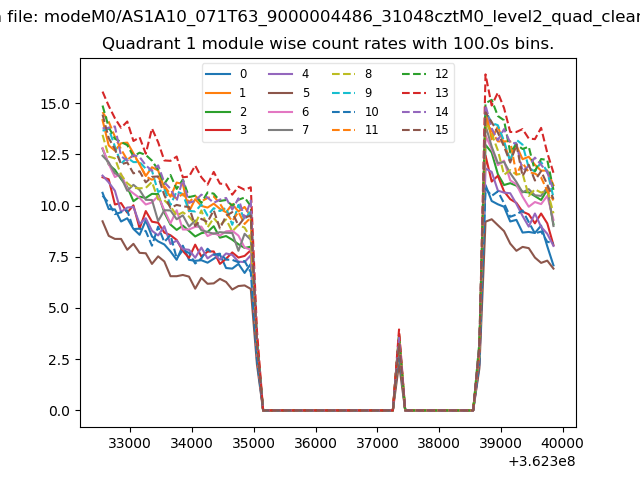
| Module-wise count rates for Quadrant A Data is divided into 100 sec bins |
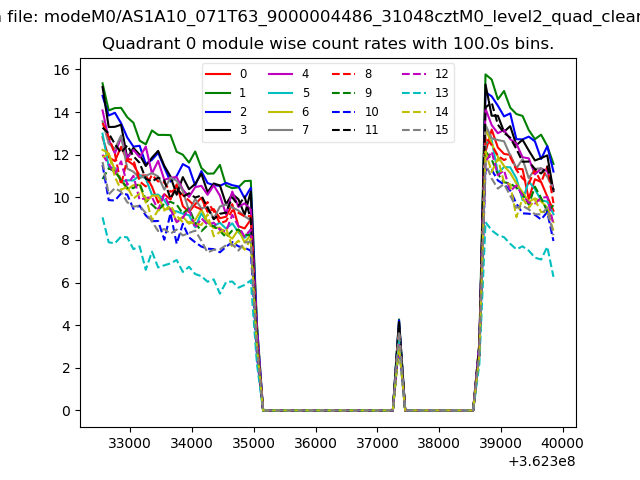 |
 |
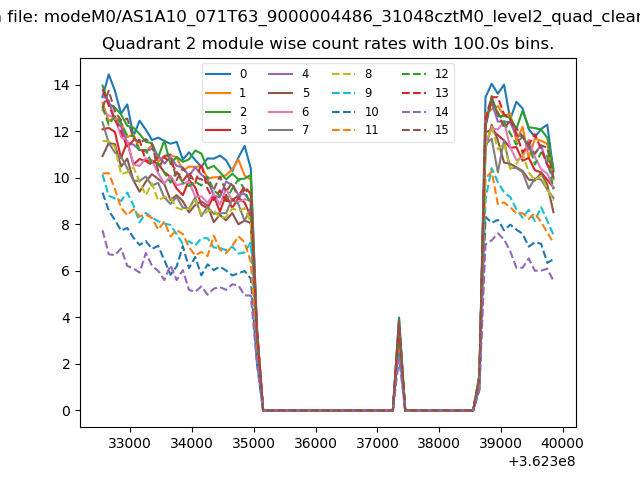
| Module-wise count rates for Quadrant B Data is divided into 100 sec bins |
 |
 |
| Module-wise count rates for Quadrant C Data is divided into 100 sec bins |
 |
 |
| Module-wise count rates for Quadrant D Data is divided into 100 sec bins |
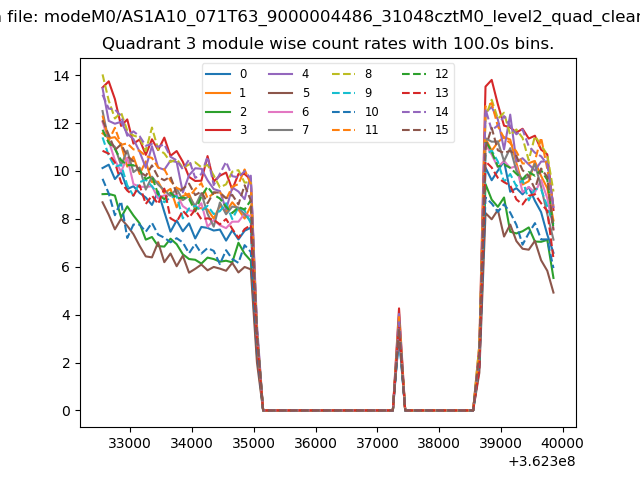 |
 |
| Parameter | Plot |
|---|---|
| CZT HV Monitor | 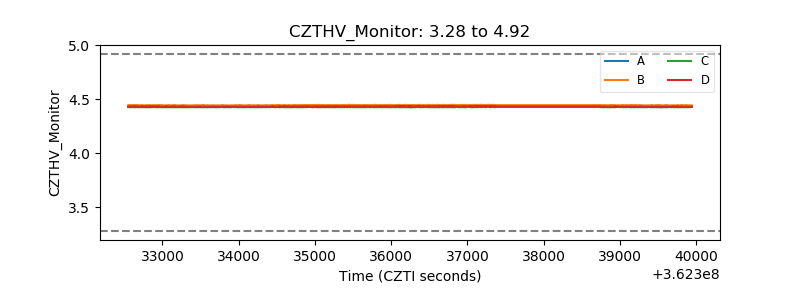 |
| D_VDD | 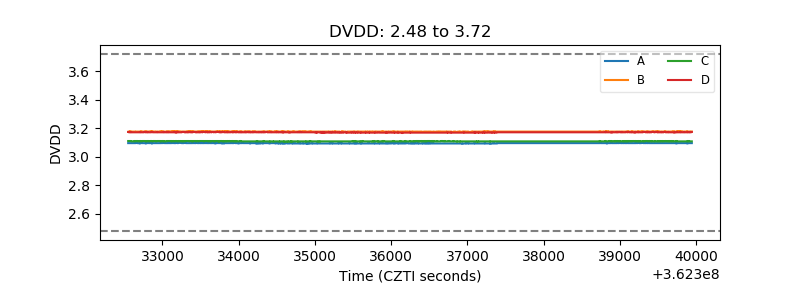 |
| Temperature 1 |  |
| Veto HV Monitor | 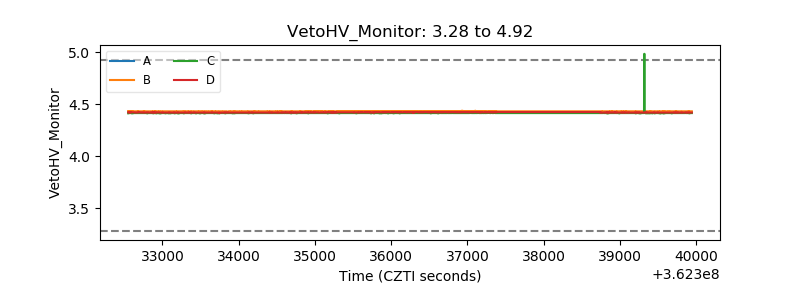 |
| Veto LLD | 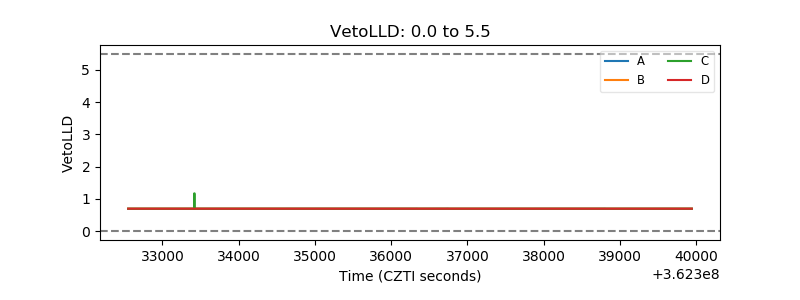 |
| Alpha Counter | 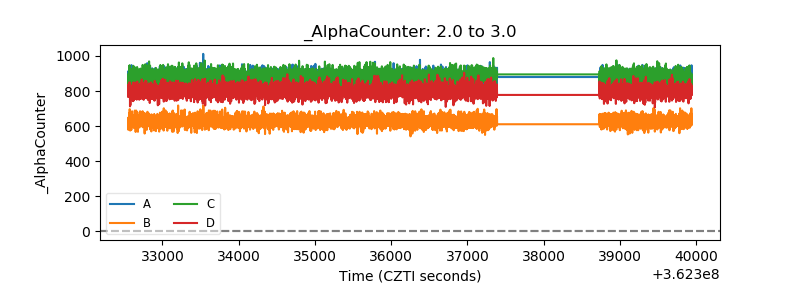 |
| _CPM_Rate | 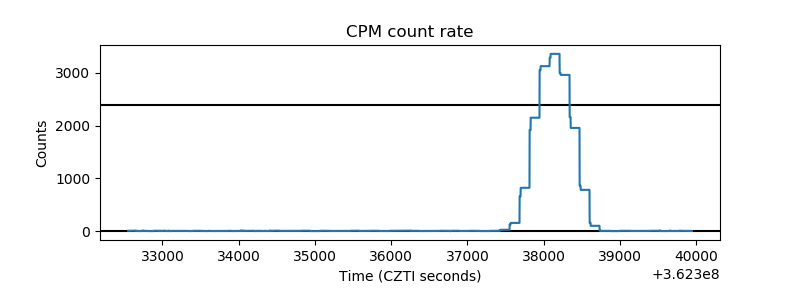 |
| CZT Counter | 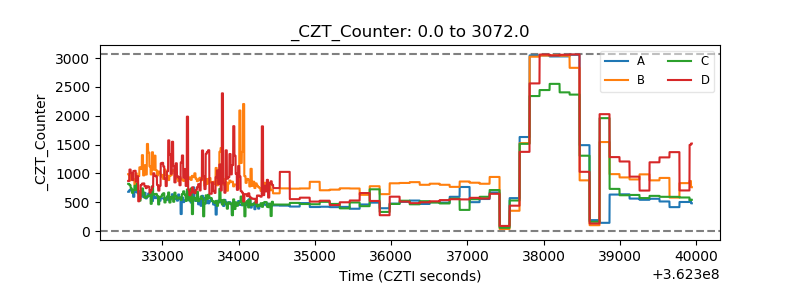 |
| +2.5 Volts monitor |  |
| +5 Volts monitor |  |
| _ROLL_ROT | 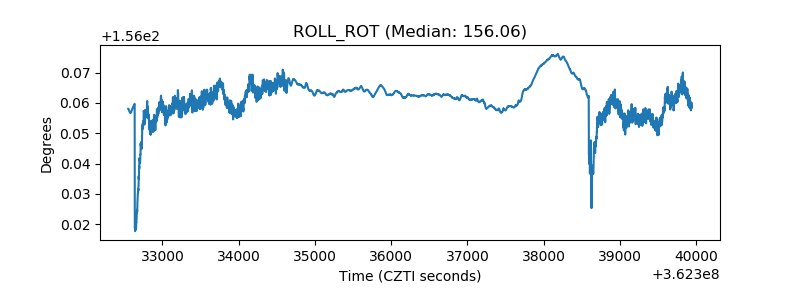 |
| _Roll_DEC | 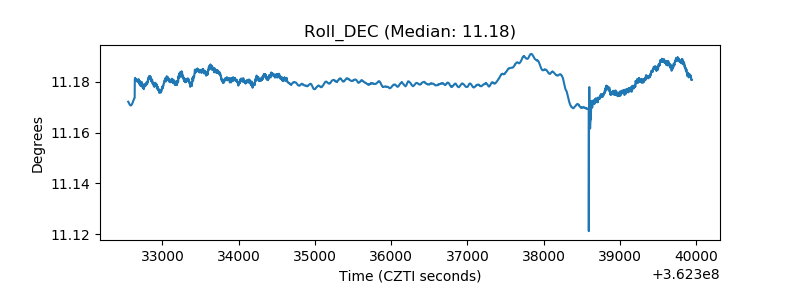 |
| _Roll_RA | 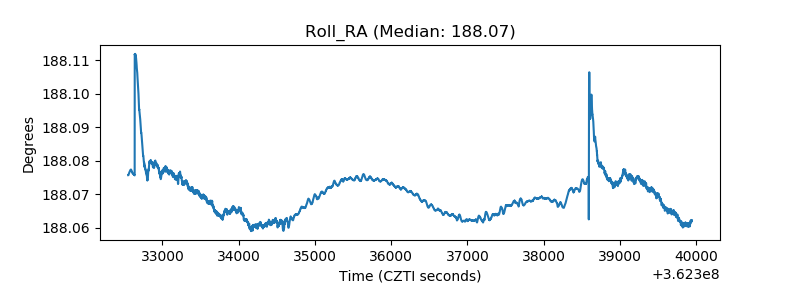 |
| Veto Counter | 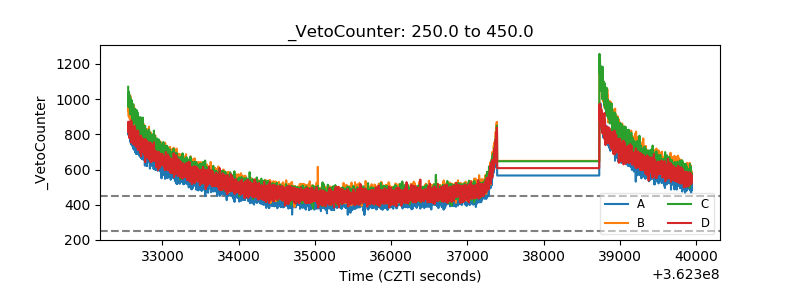 |