| Param | Original file | Final file |
|---|---|---|
| Filename | modeM0/AS1A10_071T63_9000004486_31049cztM0_level2.evt | modeM0/AS1A10_071T63_9000004486_31049cztM0_level2_quad_clean.evt |
| Size (bytes) | 629,599,680 | 97,585,920 |
| Size | 600.4 MB | 93.1 MB |
| Events in quadrant A | 3,315,783 | 660,057 |
| Events in quadrant B | 5,537,755 | 659,755 |
| Events in quadrant C | 3,634,603 | 620,304 |
| Events in quadrant D | 6,159,118 | 580,489 |
| Mode M9 | |||
|---|---|---|---|
| Quadrant | BADHDUFLAG | Total packets | Discarded packets |
| A | 0 | 20 | 0 |
| B | 0 | 21 | 0 |
| C | 0 | 21 | 0 |
| D | 0 | 21 | 0 |
| Mode SS | |||
|---|---|---|---|
| Quadrant | BADHDUFLAG | Total packets | Discarded packets |
| A | 0 | 126 | 0 |
| B | 0 | 126 | 0 |
| C | 0 | 126 | 0 |
| D | 0 | 126 | 0 |
| Mode M0 | |||
|---|---|---|---|
| Quadrant | BADHDUFLAG | Total packets | Discarded packets |
| A | 0 | 13648 | 2 |
| B | 0 | 20561 | 2 |
| C | 0 | 14614 | 2 |
| D | 0 | 22576 | 3 |
| Quadrant | Total seconds | Saturated seconds | Saturation percentage |
|---|---|---|---|
| A | 6226 | 64 | 1.027947% |
| B | 6226 | 263 | 4.224221% |
| C | 6226 | 253 | 4.063604% |
| D | 6225 | 455 | 7.309237% |
Noise dominated data is calculated using 1-second bins in cleaned event files. If a bin has >2000 counts, and if more than 50% of those come from <1% of pixels, then it is considered to be noise-dominated and hence unusable.
| Quadrant | # 1 sec bins | Bins with >0 counts | Bins with >2000 counts | High rate bins dominated by noise | Noise dominated (total time) | Noise dominated (detector-on time) | Marked lightcurve |
|---|---|---|---|---|---|---|---|
| A | 7575 | 6226 | 0 | 0 | 0.00% | 0.00% | 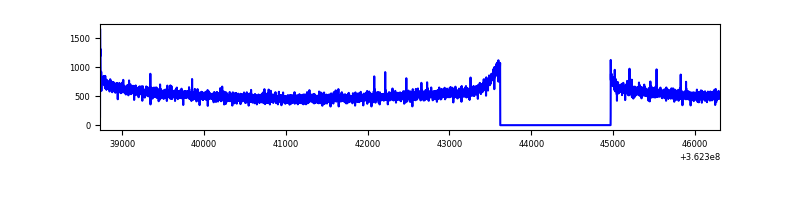 |
| B | 7575 | 6225 | 95 | 95 | 1.25% | 1.53% | 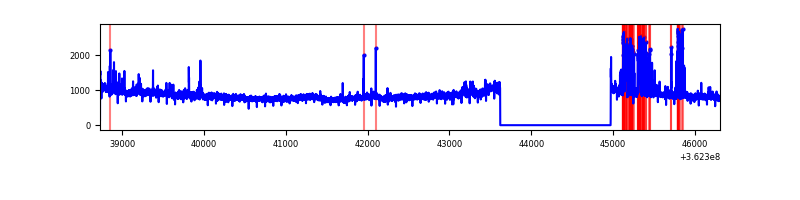 |
| C | 7575 | 6225 | 73 | 73 | 0.96% | 1.17% | 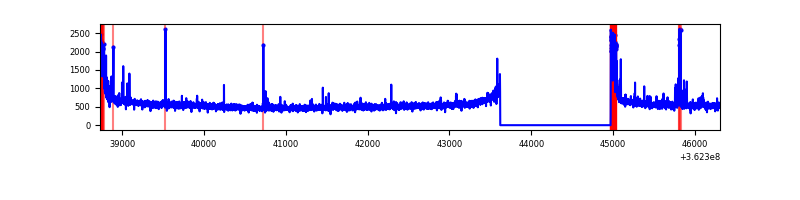 |
| D | 7574 | 6224 | 438 | 438 | 5.78% | 7.04% | 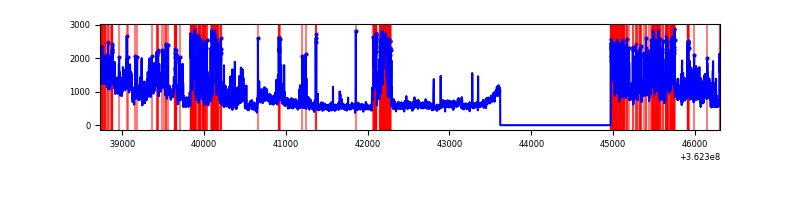 |
Top three noisy pixels from each quadrant. If the there are fewer than three noisy pixels in the level2.evt file, extra rows are filled as -1
| Pixel properties | Quadrant properties | ||||||
|---|---|---|---|---|---|---|---|
| Quadrant | DetID | PixID | Counts | Sigma | Mean | Median | Sigma |
| A | 13 | 254 | 12140 | 66.54 | 855 | 841 | 169.8 |
| A | 3 | 137 | 8025 | 42.31 | 855 | 841 | 169.8 |
| A | 0 | 226 | 7259 | 37.79 | 855 | 841 | 169.8 |
| B | 6 | 159 | 1792841 | 11253.75 | 846 | 827 | 159.2 |
| B | 5 | 172 | 278775 | 1745.5 | 846 | 827 | 159.2 |
| B | 4 | 171 | 49043 | 302.79 | 846 | 827 | 159.2 |
| C | 0 | 10 | 247072 | 1313.47 | 808 | 815 | 187.5 |
| C | 14 | 238 | 132462 | 702.17 | 808 | 815 | 187.5 |
| C | 15 | 208 | 42948 | 224.72 | 808 | 815 | 187.5 |
| D | 8 | 195 | 1167545 | 6195.48 | 800 | 783 | 188.3 |
| D | 1 | 52 | 1011390 | 5366.3 | 800 | 783 | 188.3 |
| D | 13 | 249 | 387427 | 2053.07 | 800 | 783 | 188.3 |
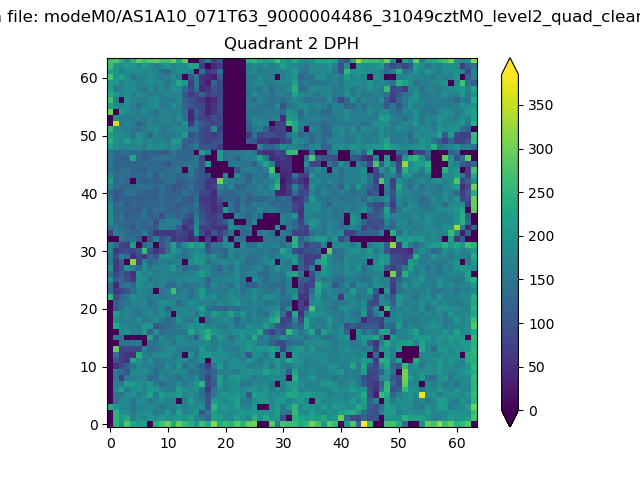
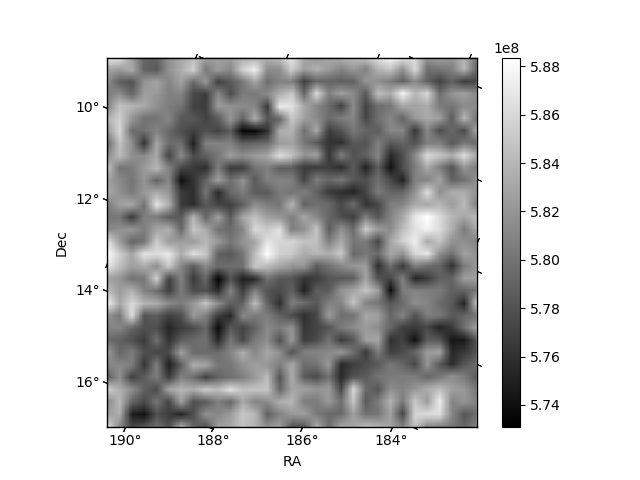
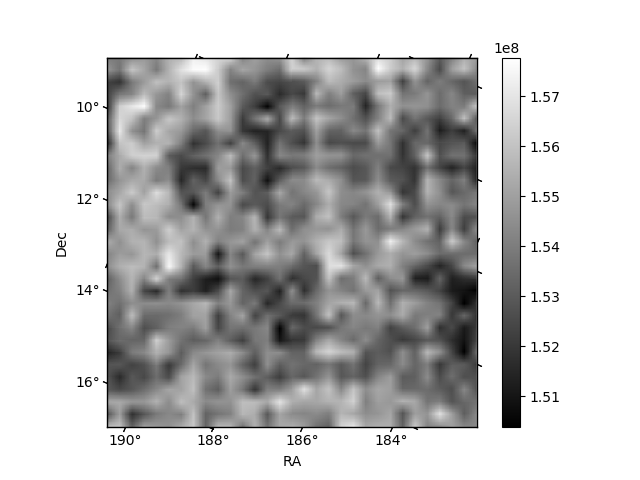
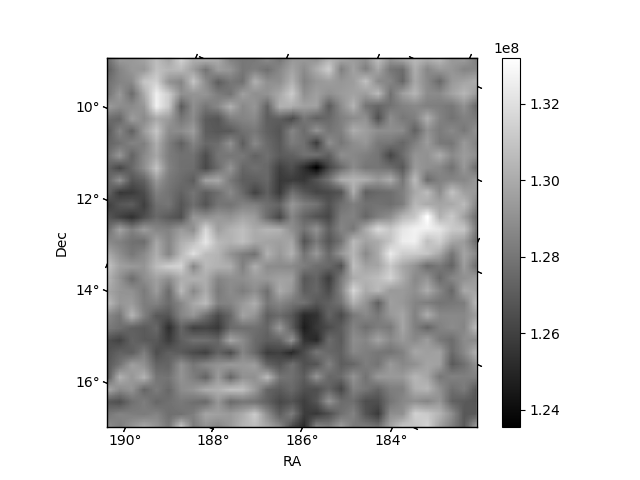
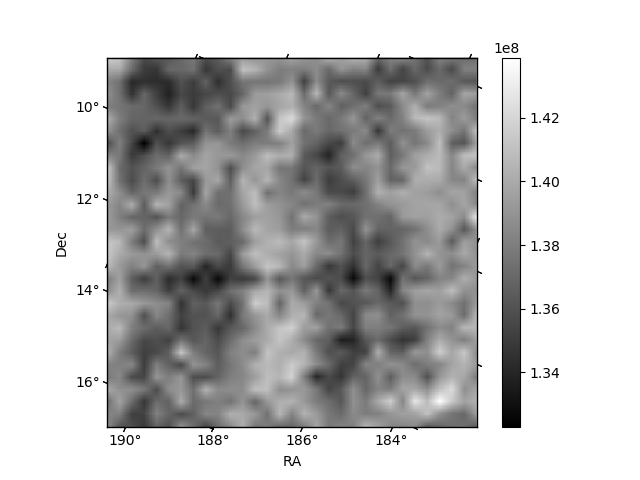
Histogram calculated using DETX and DETY for each event in the final _common_clean file
| Quadrant A | 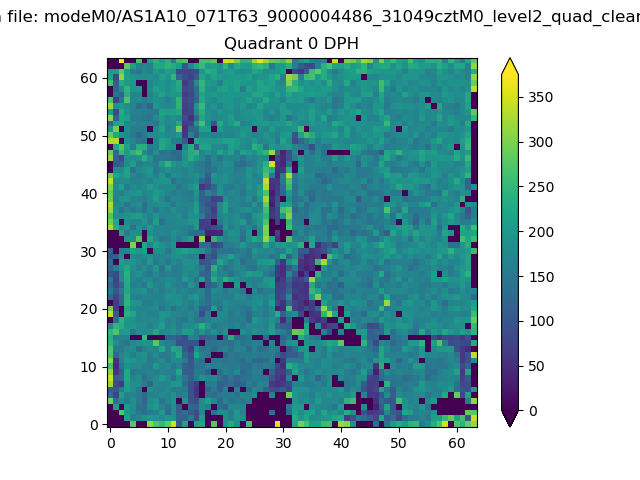 |
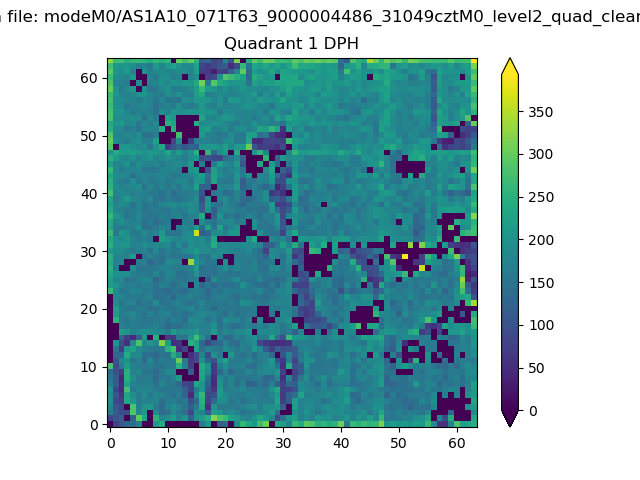 |
Quadrant B |
|---|---|---|---|
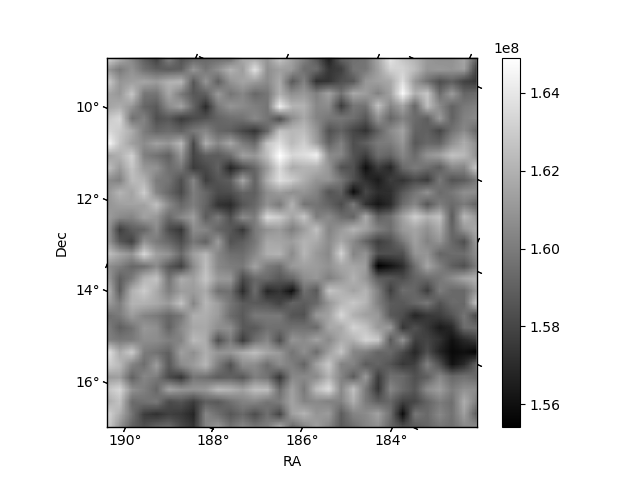
| Quadrant D | 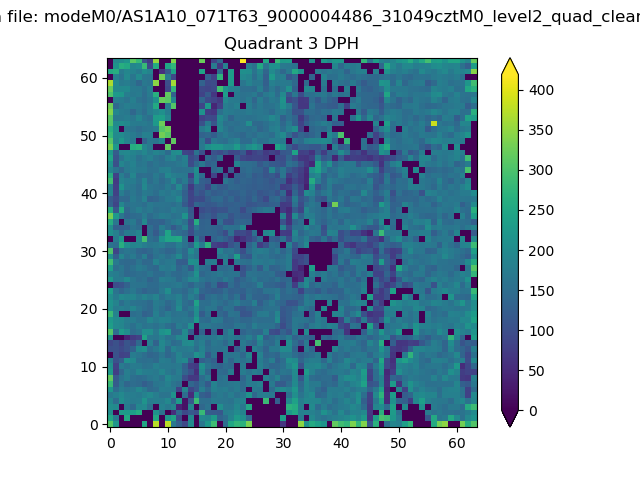 |
 |
Quadrant C |
| Plot type | Count rate plots | Images |
|---|---|---|
| Comparison with Poisson distribution Blue bars denote a histogram of data divided into 1 sec bins. Red curve is a Poisson curve with rate = median count rate of data. |
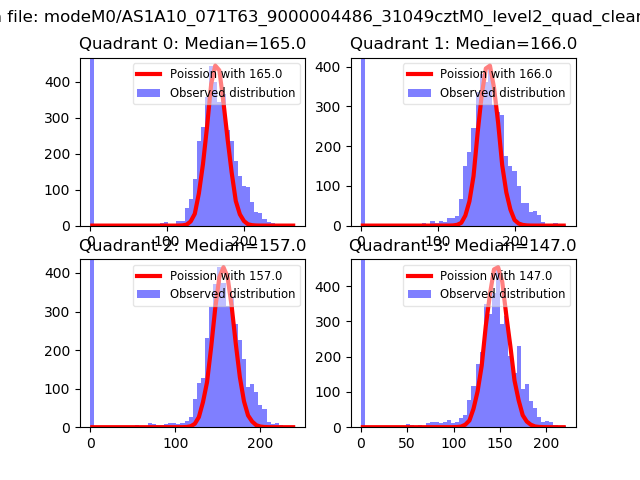 |
 |
| Quadrant-wise count rates Data is divided into 100 sec bins |
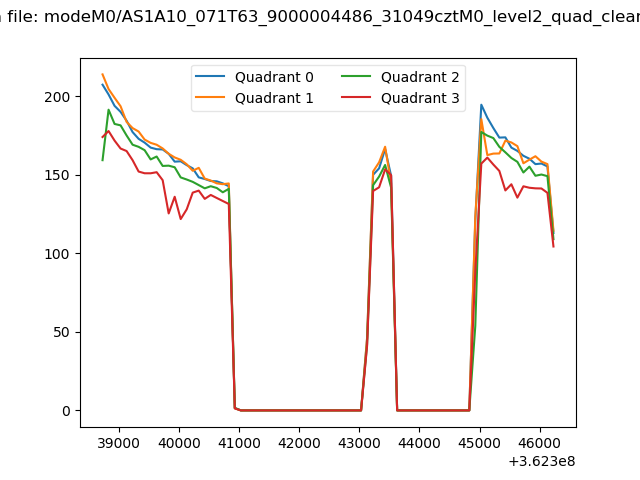 |
|
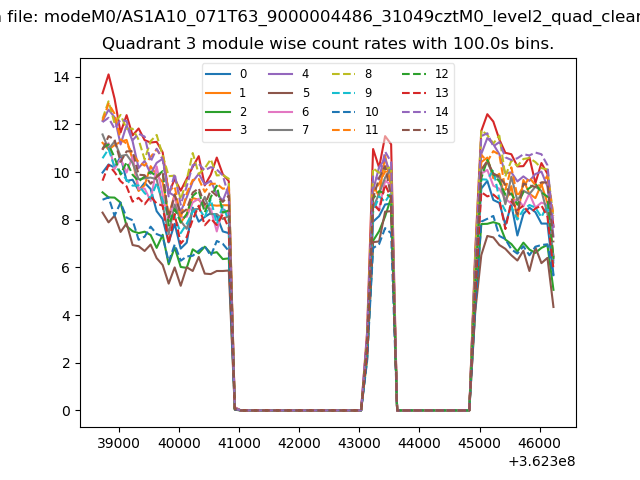
| Module-wise count rates for Quadrant A Data is divided into 100 sec bins |
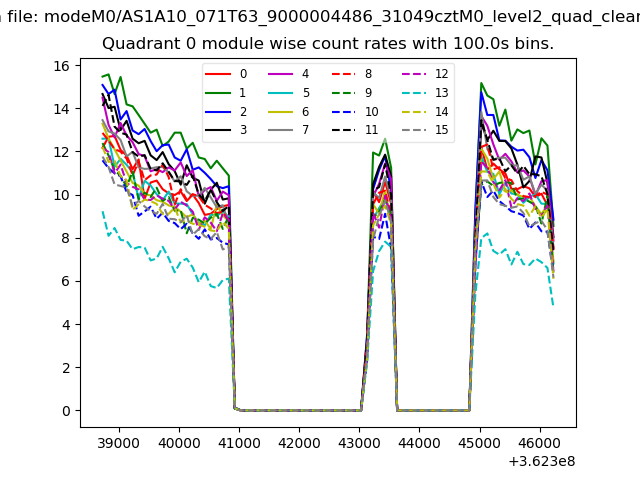 |
 |
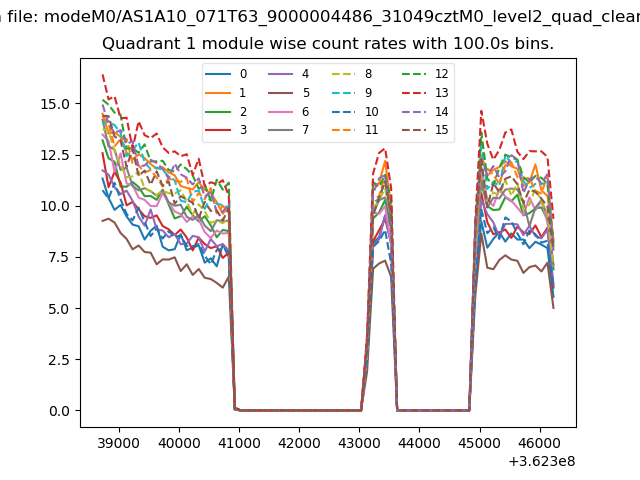
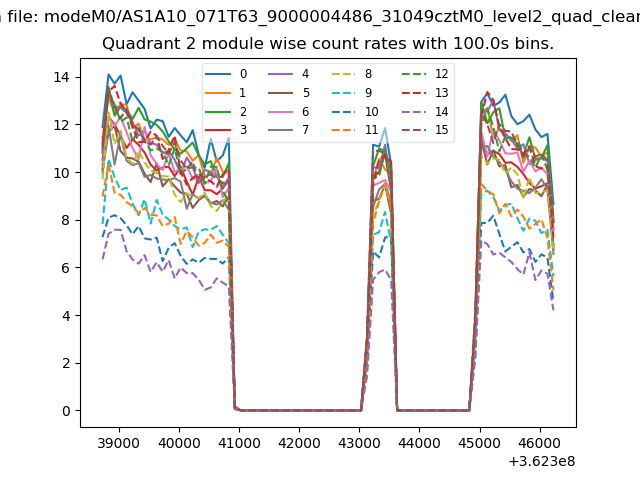
| Module-wise count rates for Quadrant B Data is divided into 100 sec bins |
 |
 |
| Module-wise count rates for Quadrant C Data is divided into 100 sec bins |
 |
 |
| Module-wise count rates for Quadrant D Data is divided into 100 sec bins |
 |
 |
| Parameter | Plot |
|---|---|
| CZT HV Monitor | 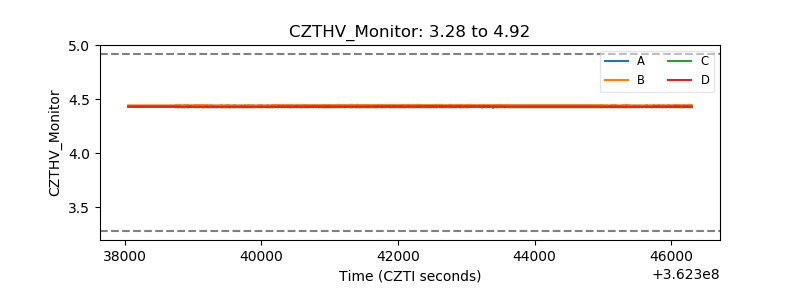 |
| D_VDD | 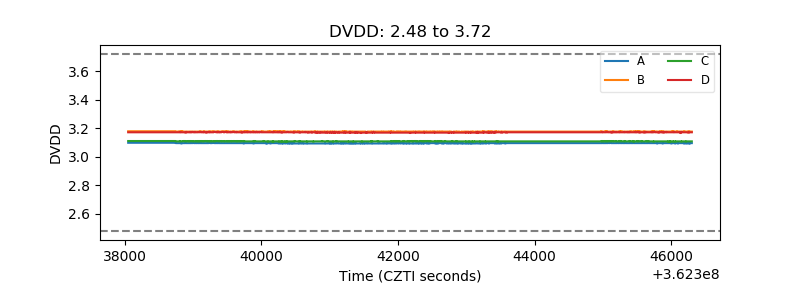 |
| Temperature 1 | 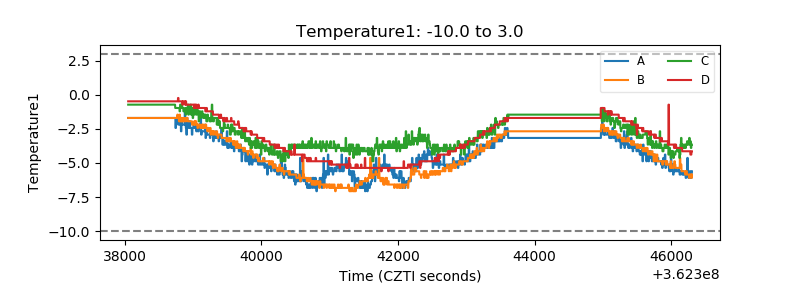 |
| Veto HV Monitor | 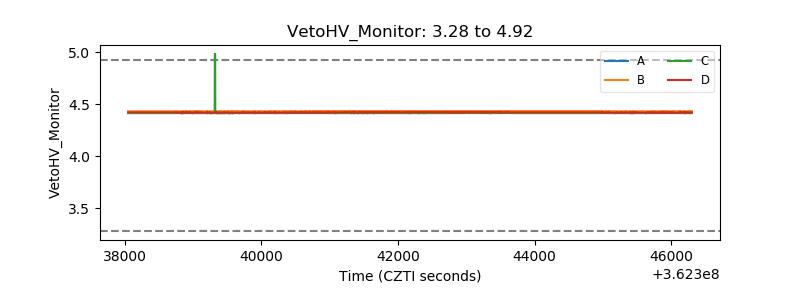 |
| Veto LLD | 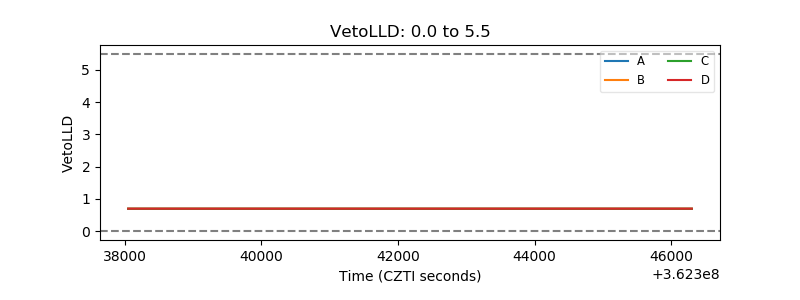 |
| Alpha Counter | 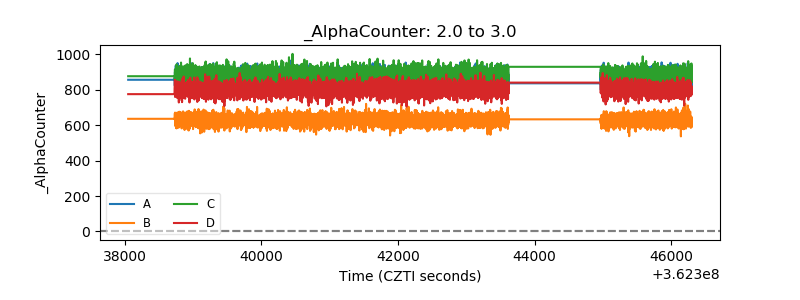 |
| _CPM_Rate | 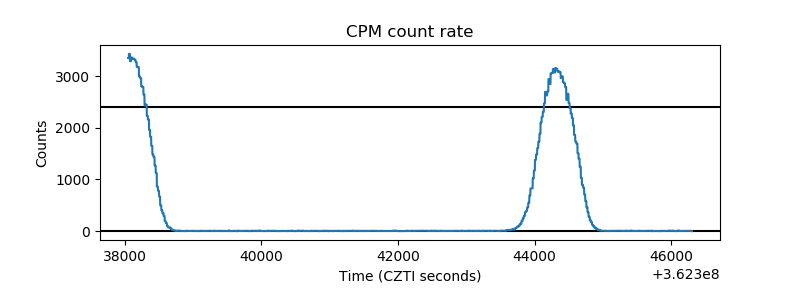 |
| CZT Counter | 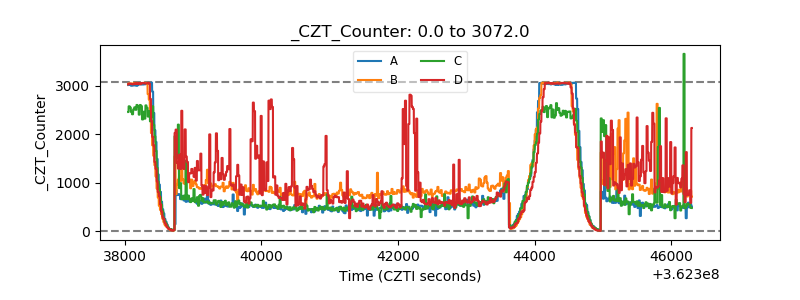 |
| +2.5 Volts monitor |  |
| +5 Volts monitor |  |
| _ROLL_ROT | 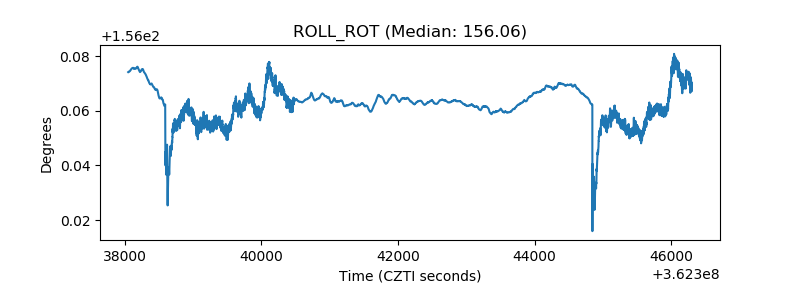 |
| _Roll_DEC | 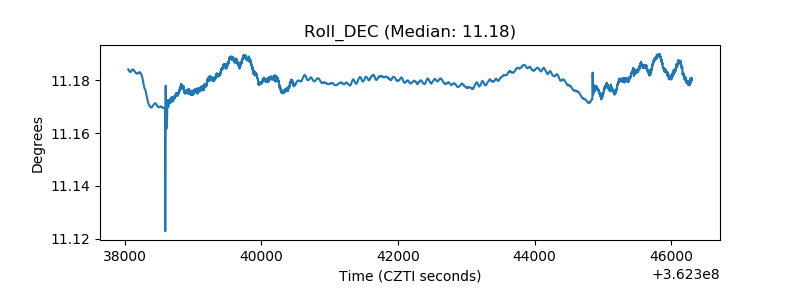 |
| _Roll_RA | 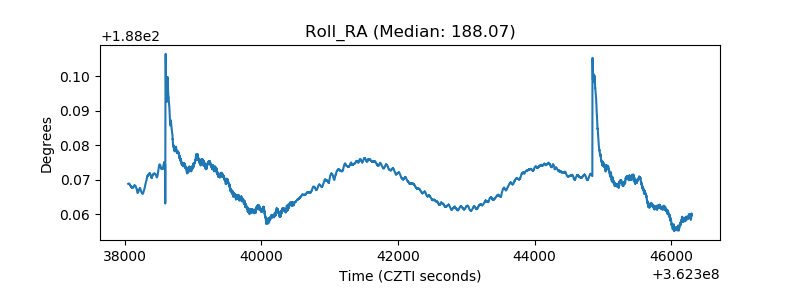 |
| Veto Counter | 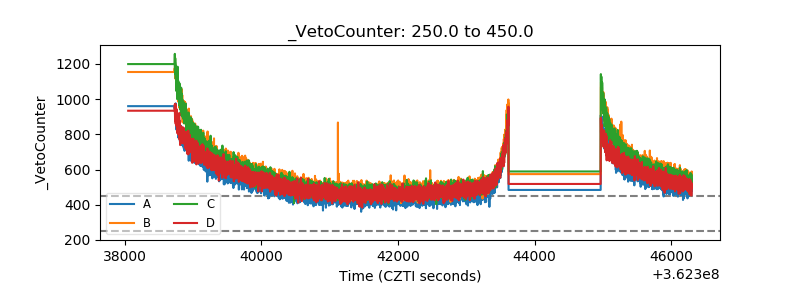 |