| Param | Original file | Final file |
|---|---|---|
| Filename | modeM0/AS1A10_071T63_9000004486_31050cztM0_level2.evt | modeM0/AS1A10_071T63_9000004486_31050cztM0_level2_quad_clean.evt |
| Size (bytes) | 607,642,560 | 90,999,360 |
| Size | 579.5 MB | 86.8 MB |
| Events in quadrant A | 3,176,189 | 616,389 |
| Events in quadrant B | 5,324,069 | 616,180 |
| Events in quadrant C | 3,515,588 | 577,334 |
| Events in quadrant D | 5,971,525 | 516,613 |
| Mode M9 | |||
|---|---|---|---|
| Quadrant | BADHDUFLAG | Total packets | Discarded packets |
| A | 0 | 17 | 0 |
| B | 0 | 18 | 0 |
| C | 0 | 18 | 0 |
| D | 0 | 18 | 0 |
| Mode SS | |||
|---|---|---|---|
| Quadrant | BADHDUFLAG | Total packets | Discarded packets |
| A | 0 | 126 | 0 |
| B | 0 | 126 | 0 |
| C | 0 | 126 | 0 |
| D | 0 | 126 | 0 |
| Mode M0 | |||
|---|---|---|---|
| Quadrant | BADHDUFLAG | Total packets | Discarded packets |
| A | 0 | 13131 | 2 |
| B | 0 | 19809 | 2 |
| C | 0 | 14103 | 2 |
| D | 0 | 21889 | 2 |
| Quadrant | Total seconds | Saturated seconds | Saturation percentage |
|---|---|---|---|
| A | 6139 | 52 | 0.847043% |
| B | 6139 | 239 | 3.893142% |
| C | 6139 | 190 | 3.094967% |
| D | 6139 | 688 | 11.207037% |
Noise dominated data is calculated using 1-second bins in cleaned event files. If a bin has >2000 counts, and if more than 50% of those come from <1% of pixels, then it is considered to be noise-dominated and hence unusable.
| Quadrant | # 1 sec bins | Bins with >0 counts | Bins with >2000 counts | High rate bins dominated by noise | Noise dominated (total time) | Noise dominated (detector-on time) | Marked lightcurve |
|---|---|---|---|---|---|---|---|
| A | 7479 | 6139 | 0 | 0 | 0.00% | 0.00% | 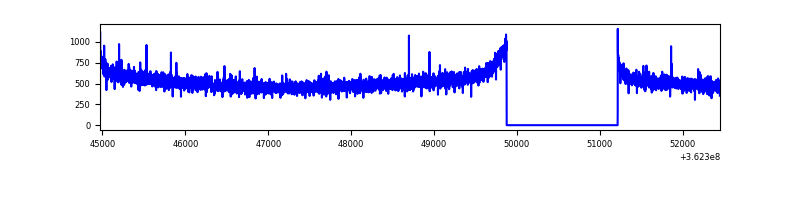 |
| B | 7478 | 6138 | 93 | 93 | 1.24% | 1.52% | 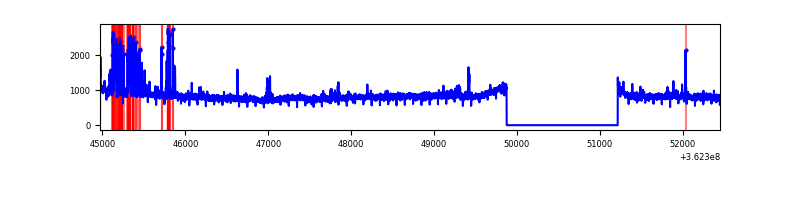 |
| C | 7478 | 6139 | 75 | 75 | 1.00% | 1.22% | 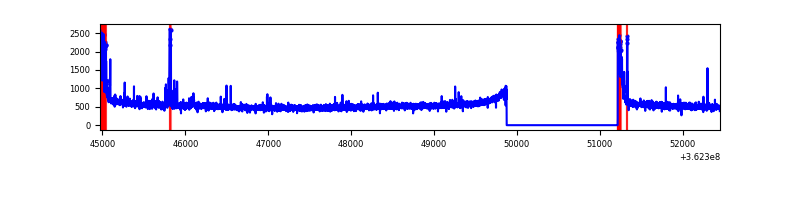 |
| D | 7478 | 6139 | 689 | 689 | 9.21% | 11.22% | 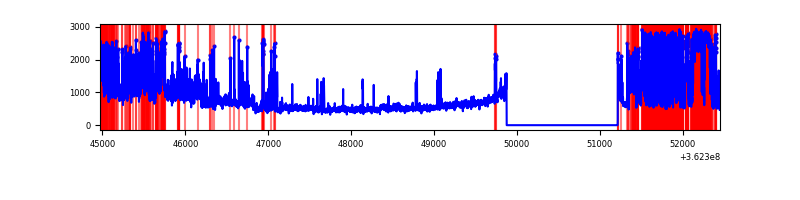 |
Top three noisy pixels from each quadrant. If the there are fewer than three noisy pixels in the level2.evt file, extra rows are filled as -1
| Pixel properties | Quadrant properties | ||||||
|---|---|---|---|---|---|---|---|
| Quadrant | DetID | PixID | Counts | Sigma | Mean | Median | Sigma |
| A | 13 | 254 | 11588 | 65.6 | 822 | 808 | 164.3 |
| A | 3 | 137 | 7834 | 42.75 | 822 | 808 | 164.3 |
| A | 0 | 226 | 6922 | 37.2 | 822 | 808 | 164.3 |
| B | 6 | 159 | 1746052 | 11306.61 | 813 | 795 | 154.4 |
| B | 5 | 172 | 257796 | 1664.98 | 813 | 795 | 154.4 |
| B | 0 | 190 | 50616 | 322.76 | 813 | 795 | 154.4 |
| C | 0 | 10 | 244416 | 1337.93 | 776 | 785 | 182.1 |
| C | 14 | 238 | 126556 | 690.69 | 776 | 785 | 182.1 |
| C | 15 | 208 | 40048 | 215.62 | 776 | 785 | 182.1 |
| D | 12 | 218 | 880592 | 5000.15 | 746 | 729 | 176.0 |
| D | 8 | 195 | 787191 | 4469.36 | 746 | 729 | 176.0 |
| D | 1 | 52 | 724139 | 4111.04 | 746 | 729 | 176.0 |
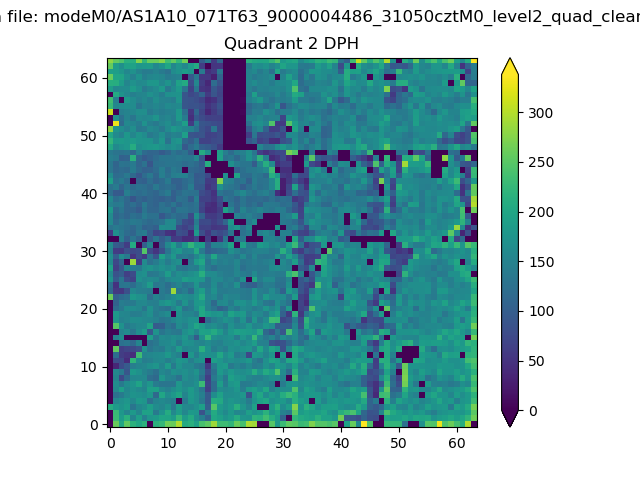
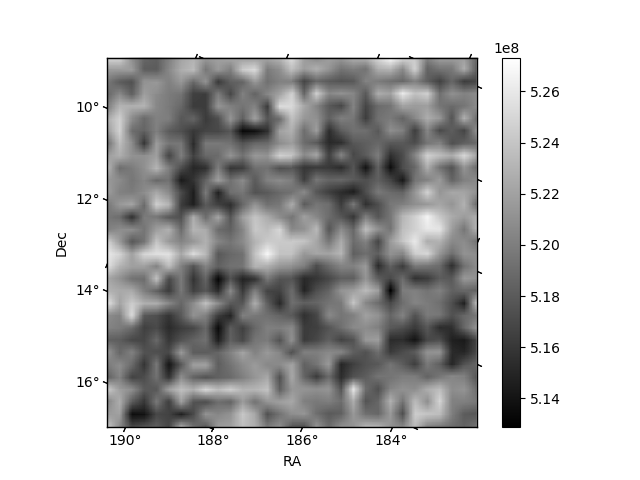
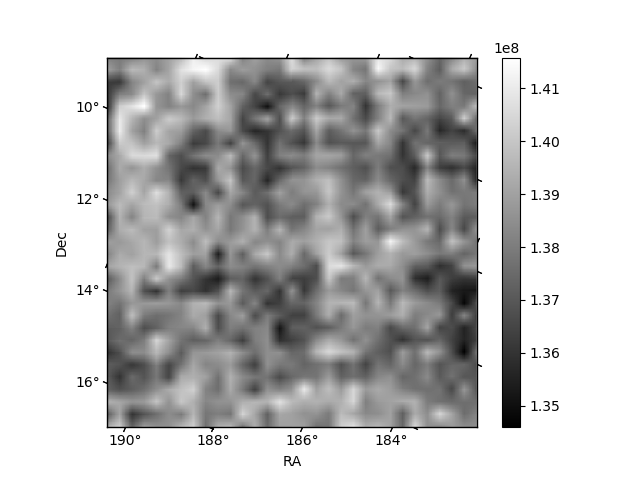
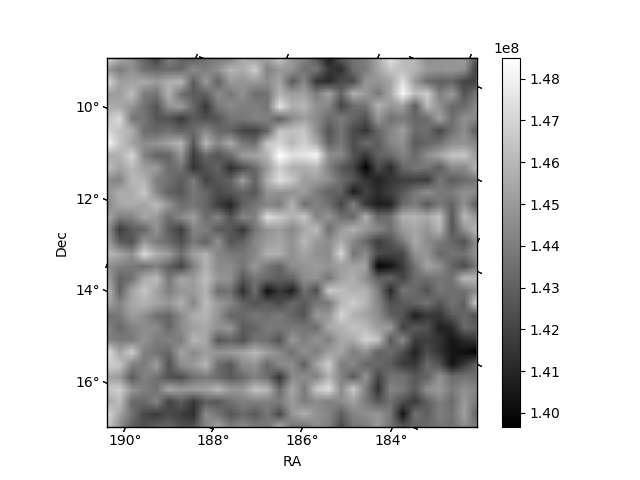
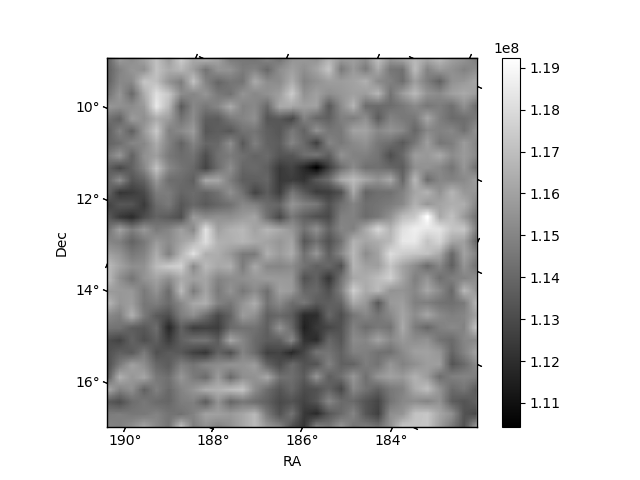
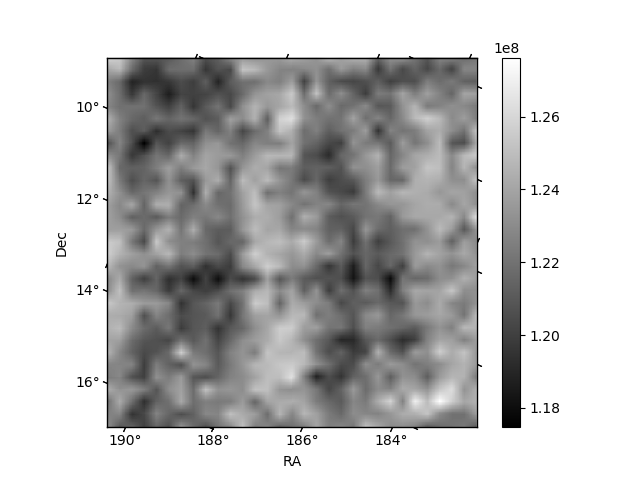
Histogram calculated using DETX and DETY for each event in the final _common_clean file
| Quadrant A | 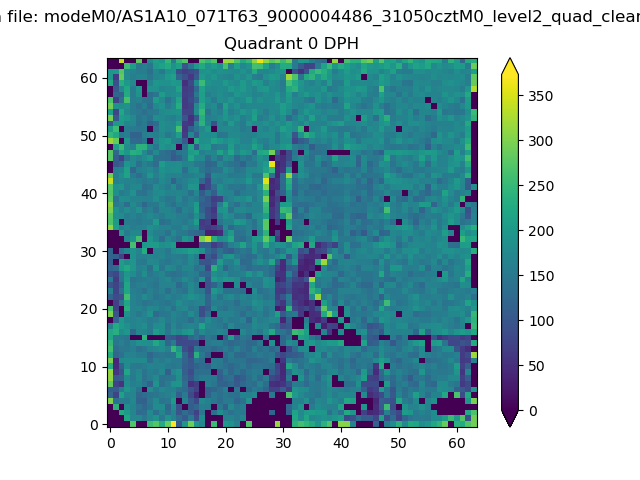 |
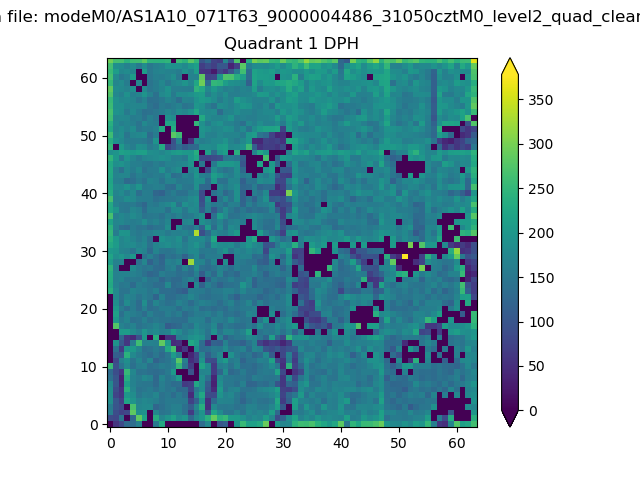 |
Quadrant B |
|---|---|---|---|
| Quadrant D | 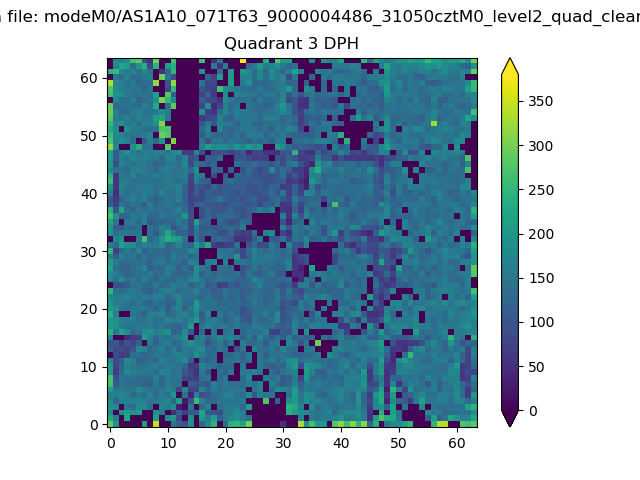 |
 |
Quadrant C |
| Plot type | Count rate plots | Images |
|---|---|---|
| Comparison with Poisson distribution Blue bars denote a histogram of data divided into 1 sec bins. Red curve is a Poisson curve with rate = median count rate of data. |
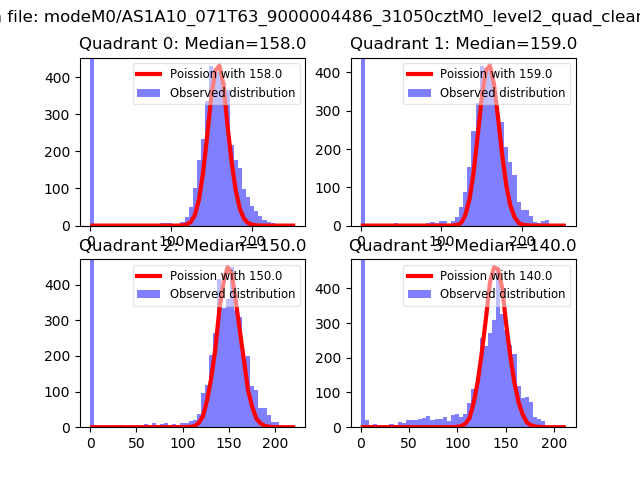 |
 |
| Quadrant-wise count rates Data is divided into 100 sec bins |
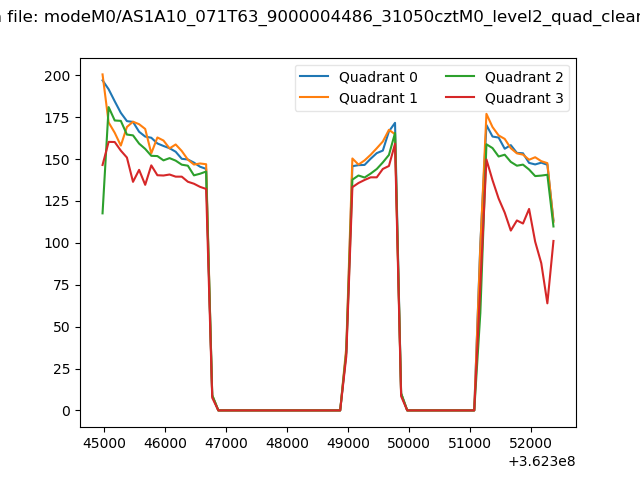 |
|
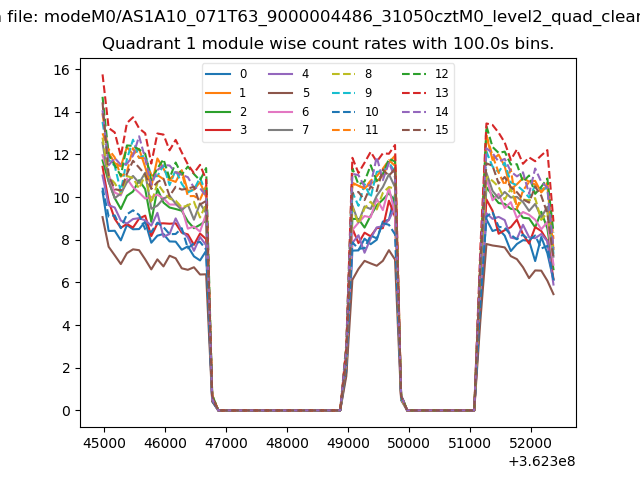
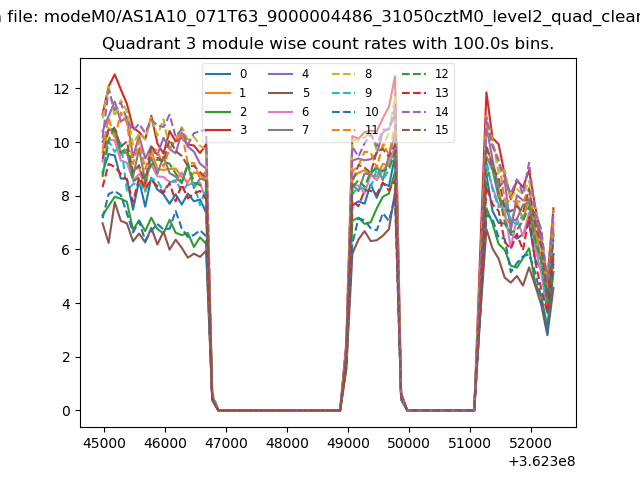
| Module-wise count rates for Quadrant A Data is divided into 100 sec bins |
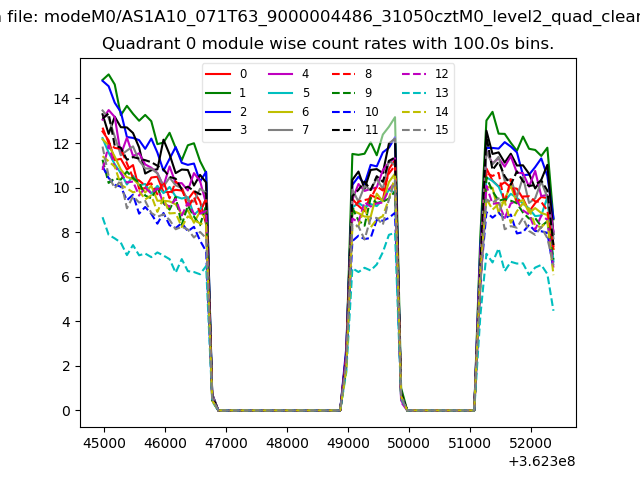 |
 |
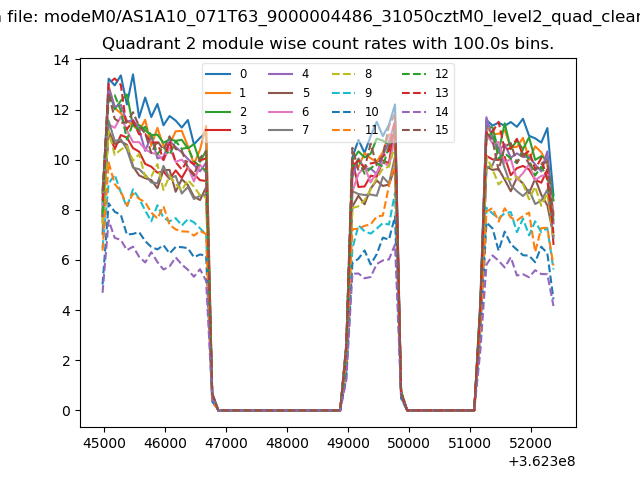
| Module-wise count rates for Quadrant B Data is divided into 100 sec bins |
 |
 |
| Module-wise count rates for Quadrant C Data is divided into 100 sec bins |
 |
 |
| Module-wise count rates for Quadrant D Data is divided into 100 sec bins |
 |
 |
| Parameter | Plot |
|---|---|
| CZT HV Monitor | 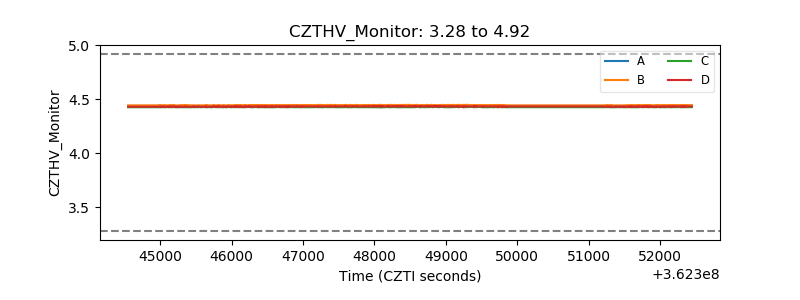 |
| D_VDD | 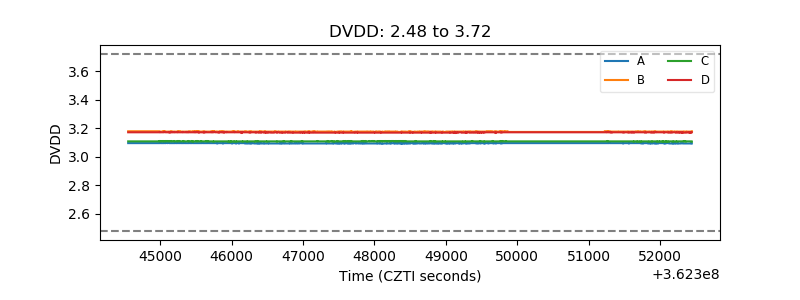 |
| Temperature 1 | 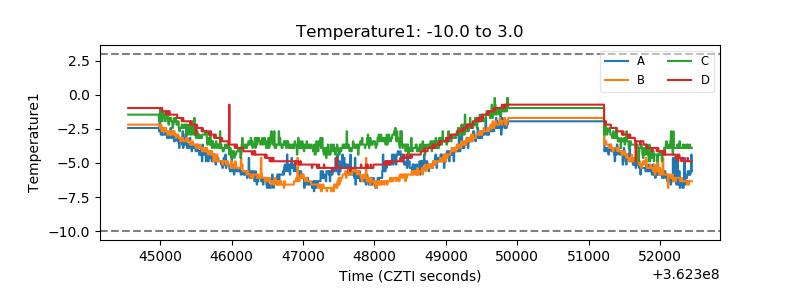 |
| Veto HV Monitor | 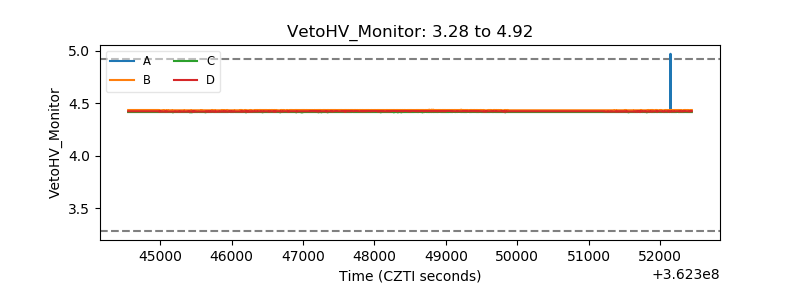 |
| Veto LLD | 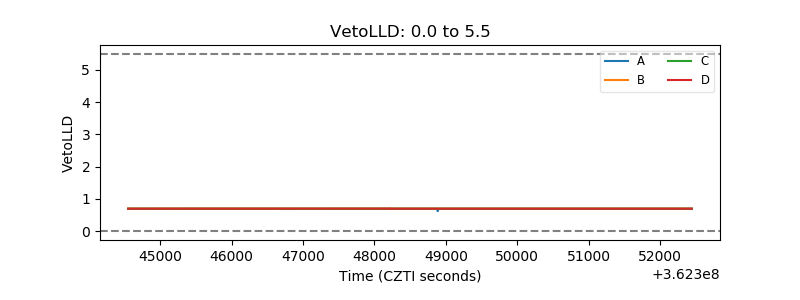 |
| Alpha Counter | 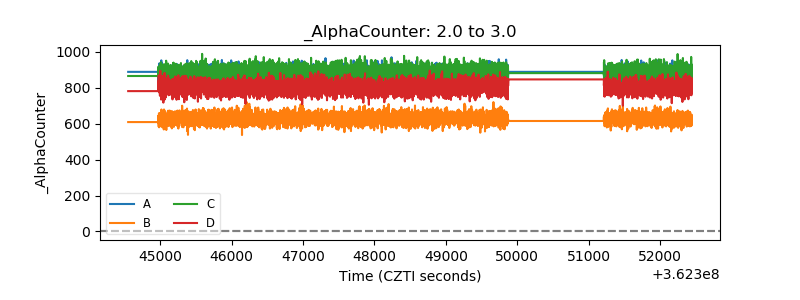 |
| _CPM_Rate | 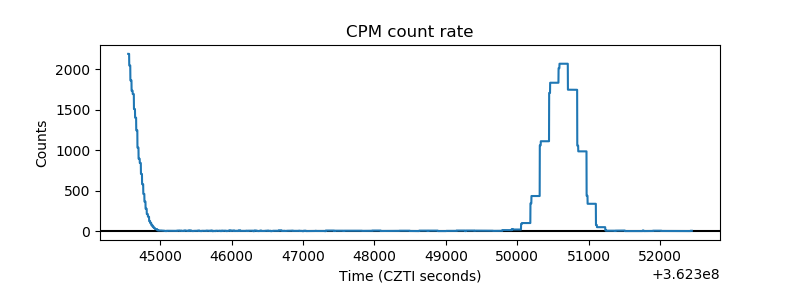 |
| CZT Counter | 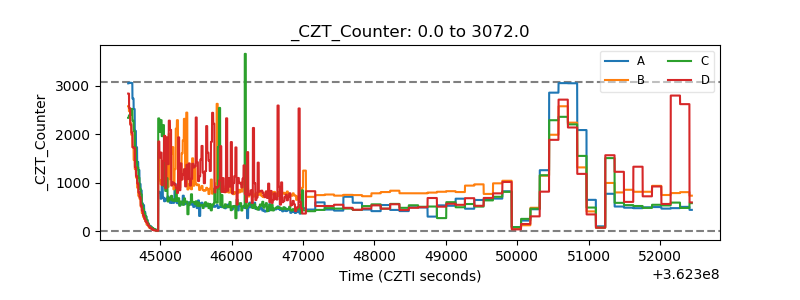 |
| +2.5 Volts monitor | 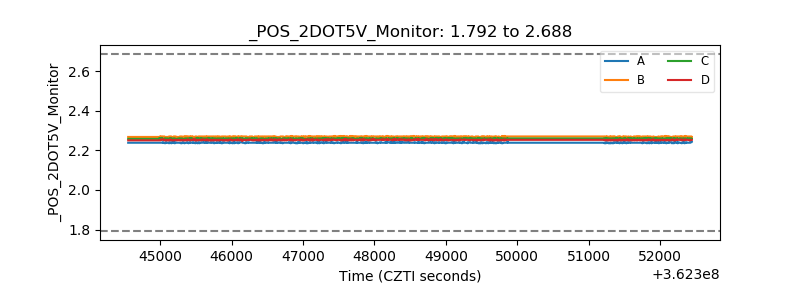 |
| +5 Volts monitor | 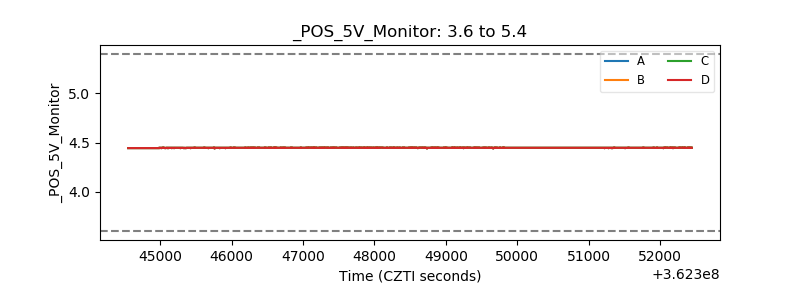 |
| _ROLL_ROT | 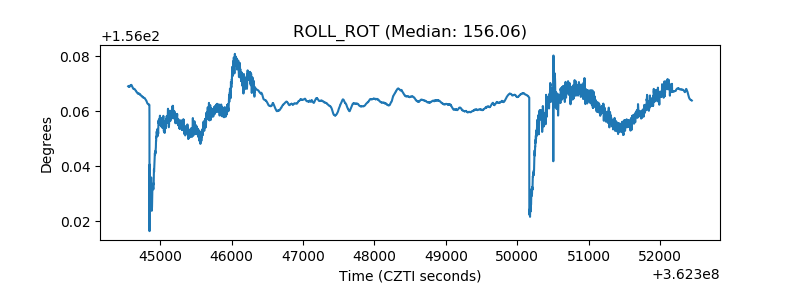 |
| _Roll_DEC | 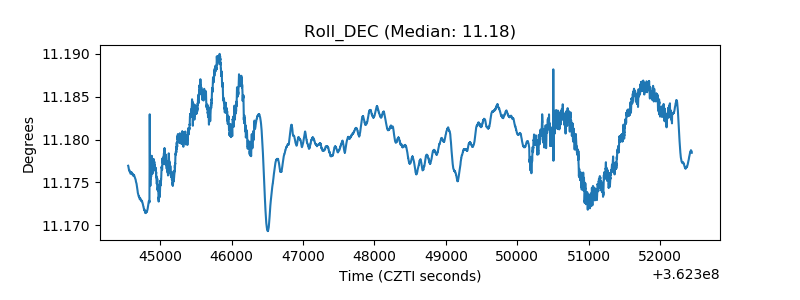 |
| _Roll_RA | 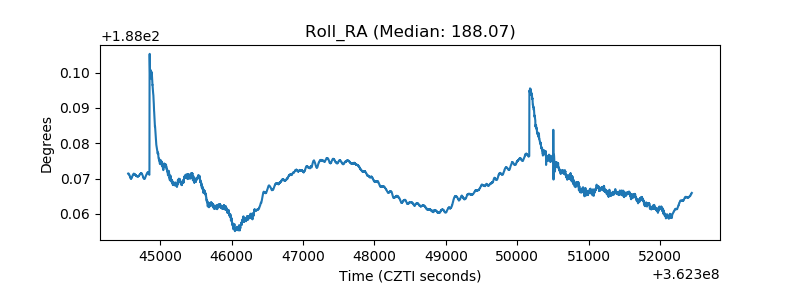 |
| Veto Counter | 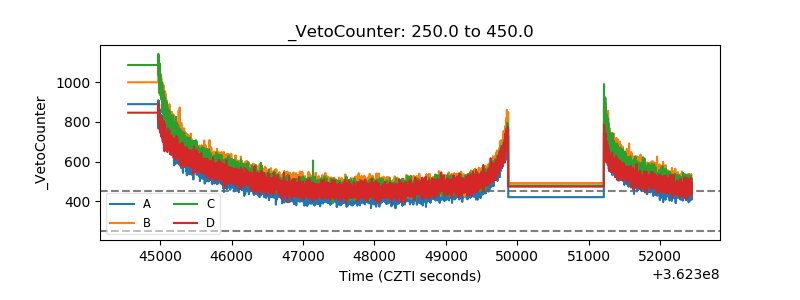 |