| Param | Original file | Final file |
|---|---|---|
| Filename | modeM0/AS1A10_071T63_9000004486_31051cztM0_level2.evt | modeM0/AS1A10_071T63_9000004486_31051cztM0_level2_quad_clean.evt |
| Size (bytes) | 150,048,000 | 26,493,120 |
| Size | 143.1 MB | 25.3 MB |
| Events in quadrant A | 635,586 | 192,335 |
| Events in quadrant B | 1,023,400 | 194,465 |
| Events in quadrant C | 746,943 | 179,669 |
| Events in quadrant D | 2,051,863 | 141,960 |
| Mode M9 | |||
|---|---|---|---|
| Quadrant | BADHDUFLAG | Total packets | Discarded packets |
| A | 1 | 139708795824936 | 46 |
| B | 1 | -1 | -1 |
| C | 1 | -1 | -1 |
| D | 1 | -1 | -1 |
| Mode SS | |||
|---|---|---|---|
| Quadrant | BADHDUFLAG | Total packets | Discarded packets |
| A | 0 | 26 | 0 |
| B | 0 | 26 | 0 |
| C | 0 | 26 | 0 |
| D | 0 | 26 | 0 |
| Mode M0 | |||
|---|---|---|---|
| Quadrant | BADHDUFLAG | Total packets | Discarded packets |
| A | 0 | 2585 | 1 |
| B | 0 | 3794 | 1 |
| C | 0 | 2911 | 1 |
| D | 0 | 6985 | 1 |
| Quadrant | Total seconds | Saturated seconds | Saturation percentage |
|---|---|---|---|
| A | 1234 | 4 | 0.324149% |
| B | 1234 | 9 | 0.729335% |
| C | 1234 | 50 | 4.051864% |
| D | 1234 | 480 | 38.897893% |
Noise dominated data is calculated using 1-second bins in cleaned event files. If a bin has >2000 counts, and if more than 50% of those come from <1% of pixels, then it is considered to be noise-dominated and hence unusable.
| Quadrant | # 1 sec bins | Bins with >0 counts | Bins with >2000 counts | High rate bins dominated by noise | Noise dominated (total time) | Noise dominated (detector-on time) | Marked lightcurve |
|---|---|---|---|---|---|---|---|
| A | 1233 | 1233 | 0 | 0 | 0.00% | 0.00% | 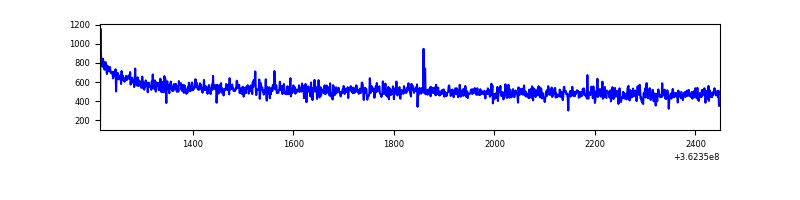 |
| B | 1233 | 1233 | 1 | 1 | 0.08% | 0.08% | 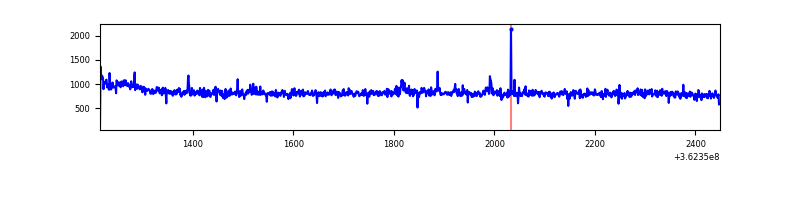 |
| C | 1234 | 1234 | 22 | 22 | 1.78% | 1.78% | 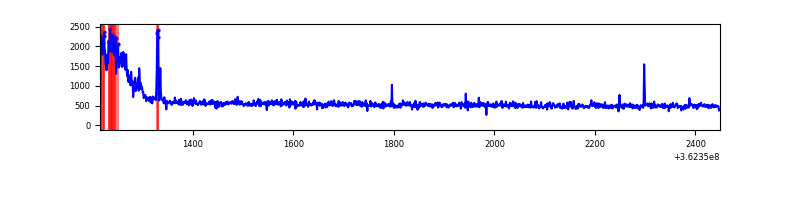 |
| D | 1234 | 1234 | 502 | 502 | 40.68% | 40.68% | 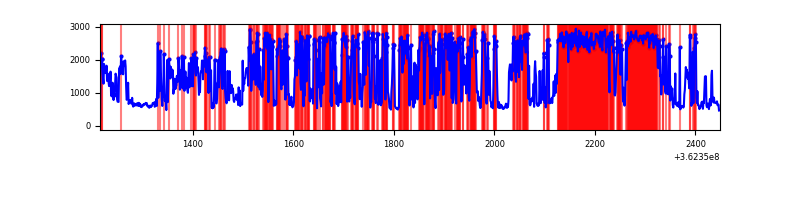 |
Top three noisy pixels from each quadrant. If the there are fewer than three noisy pixels in the level2.evt file, extra rows are filled as -1
| Pixel properties | Quadrant properties | ||||||
|---|---|---|---|---|---|---|---|
| Quadrant | DetID | PixID | Counts | Sigma | Mean | Median | Sigma |
| A | 13 | 254 | 2507 | 67.71 | 164 | 161 | 34.6 |
| A | 3 | 137 | 1495 | 38.5 | 164 | 161 | 34.6 |
| A | 0 | 226 | 1361 | 34.63 | 164 | 161 | 34.6 |
| B | 6 | 159 | 352466 | 10735.22 | 165 | 161 | 32.8 |
| B | 0 | 183 | 8532 | 255.08 | 165 | 161 | 32.8 |
| B | 0 | 190 | 4527 | 133.04 | 165 | 161 | 32.8 |
| C | 0 | 10 | 100904 | 2684.75 | 154 | 155 | 37.5 |
| C | 14 | 238 | 24657 | 652.93 | 154 | 155 | 37.5 |
| C | 4 | 175 | 7978 | 208.47 | 154 | 155 | 37.5 |
| D | 12 | 218 | 876041 | 25997.52 | 131 | 127 | 33.7 |
| D | 13 | 174 | 409529 | 12151.23 | 131 | 127 | 33.7 |
| D | 8 | 195 | 158275 | 4693.9 | 131 | 127 | 33.7 |
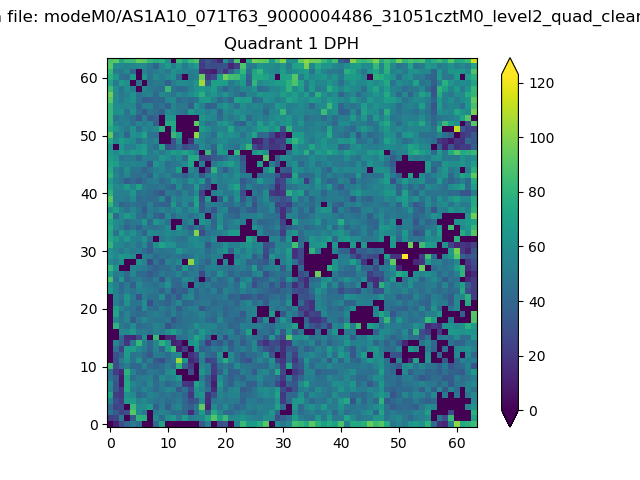
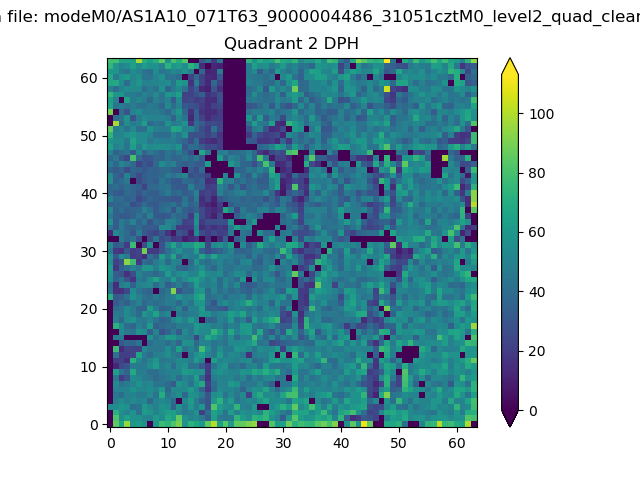
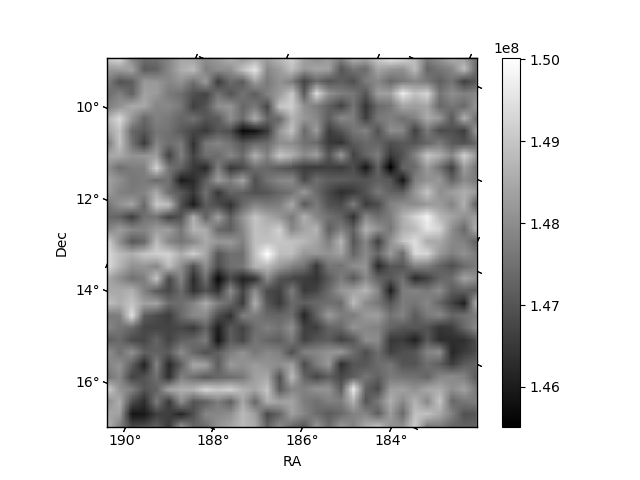
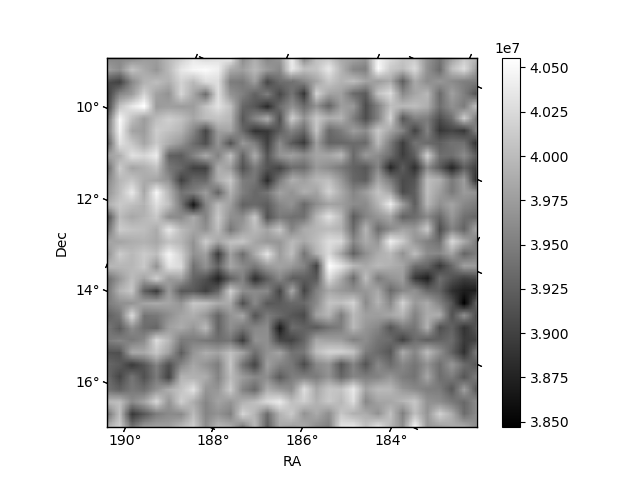
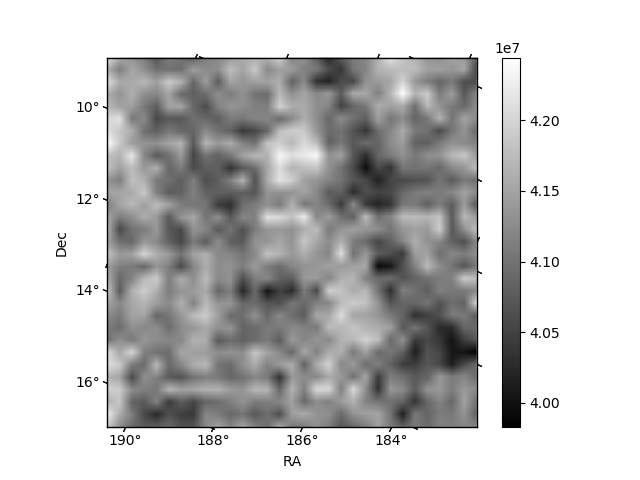
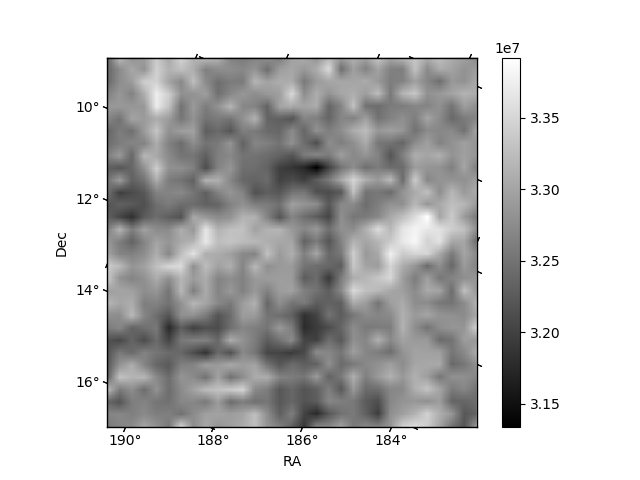
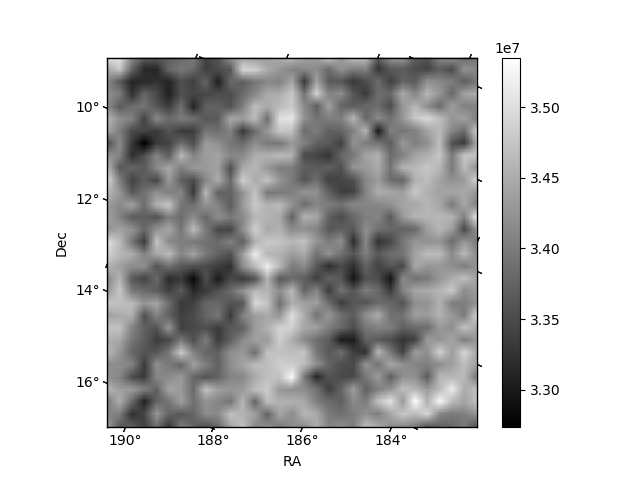
Histogram calculated using DETX and DETY for each event in the final _common_clean file
| Quadrant A |  |
 |
Quadrant B |
|---|---|---|---|
| Quadrant D | 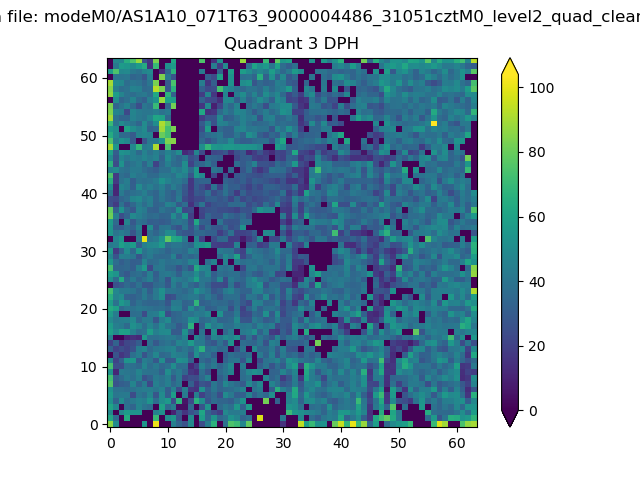 |
 |
Quadrant C |
| Plot type | Count rate plots | Images |
|---|---|---|
| Comparison with Poisson distribution Blue bars denote a histogram of data divided into 1 sec bins. Red curve is a Poisson curve with rate = median count rate of data. |
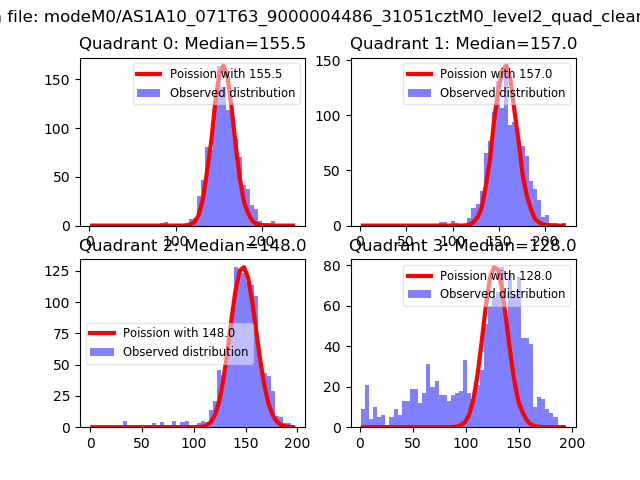 |
 |
| Quadrant-wise count rates Data is divided into 100 sec bins |
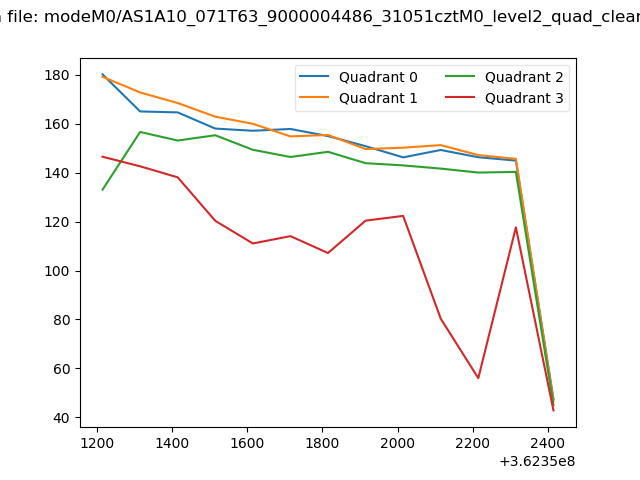 |
|
| Module-wise count rates for Quadrant A Data is divided into 100 sec bins |
 |
 |
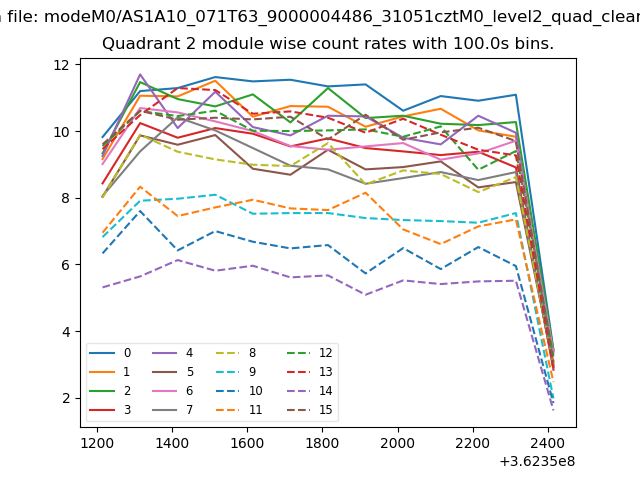
| Module-wise count rates for Quadrant B Data is divided into 100 sec bins |
 |
 |
| Module-wise count rates for Quadrant C Data is divided into 100 sec bins |
 |
 |
| Module-wise count rates for Quadrant D Data is divided into 100 sec bins |
 |
 |
| Parameter | Plot |
|---|---|
| CZT HV Monitor | 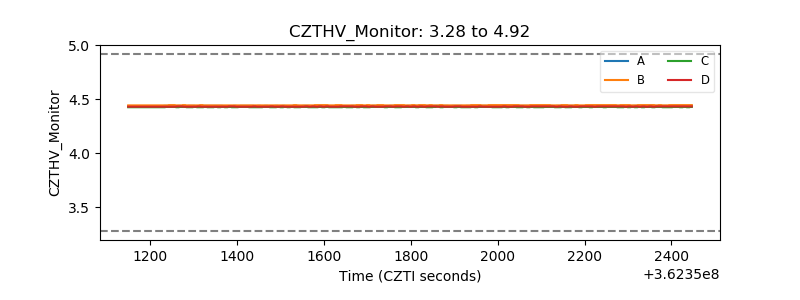 |
| D_VDD | 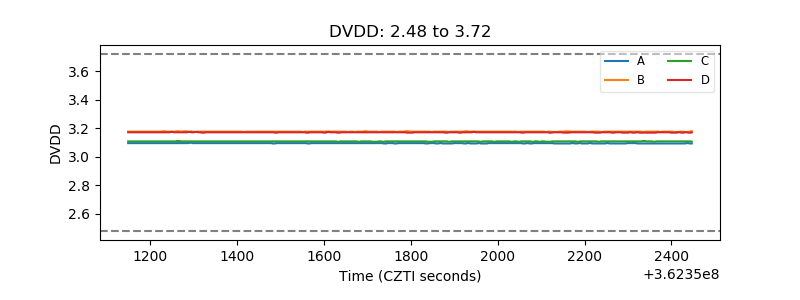 |
| Temperature 1 | 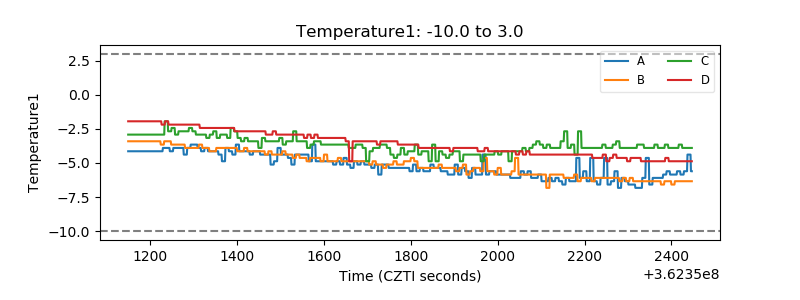 |
| Veto HV Monitor | 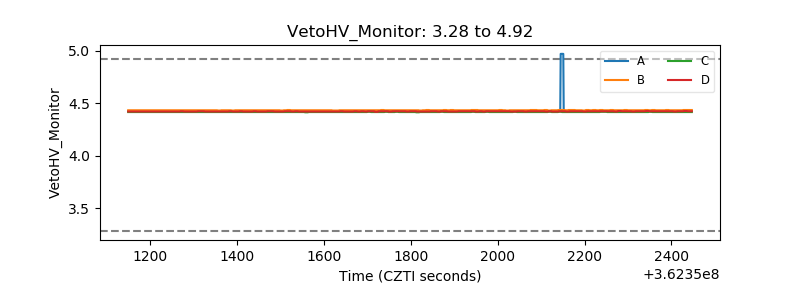 |
| Veto LLD | 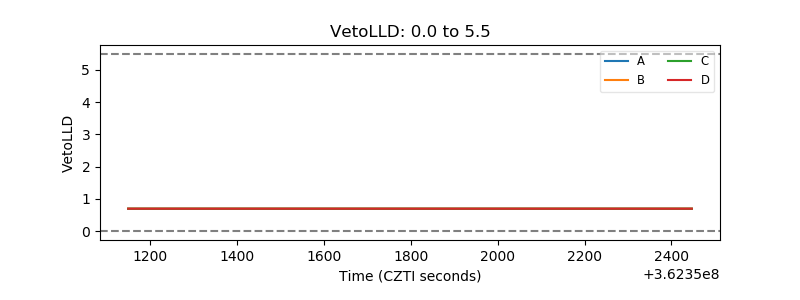 |
| Alpha Counter | 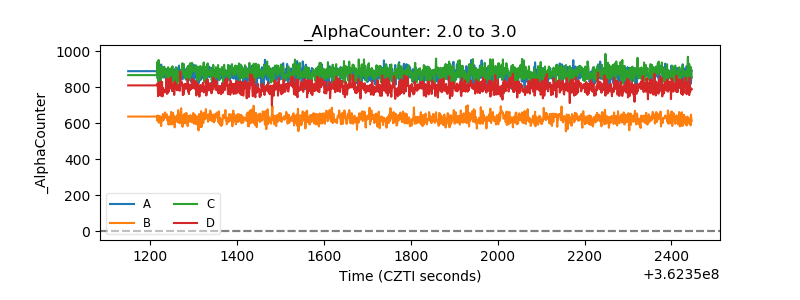 |
| _CPM_Rate | 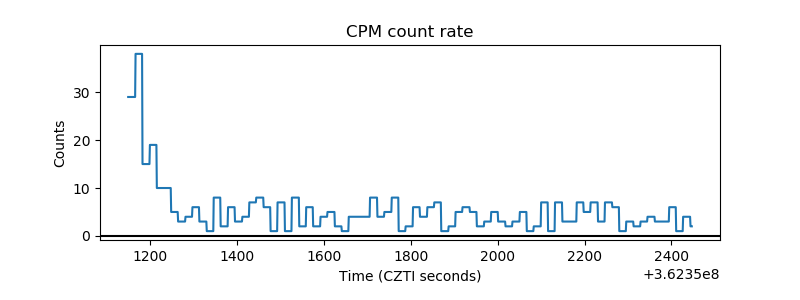 |
| CZT Counter | 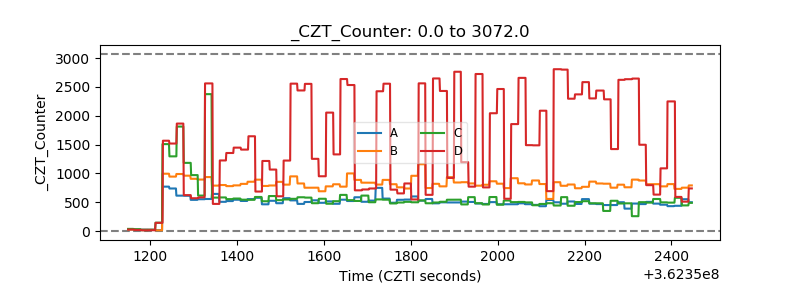 |
| +2.5 Volts monitor | 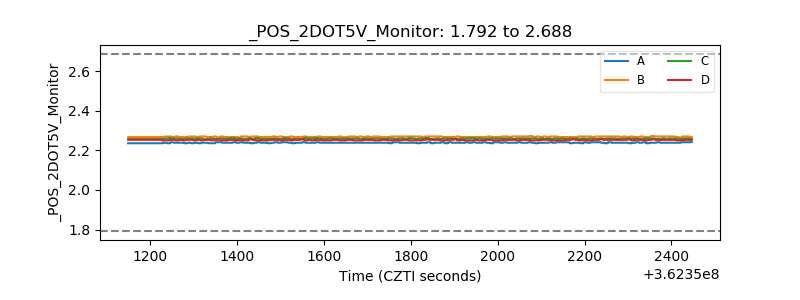 |
| +5 Volts monitor | 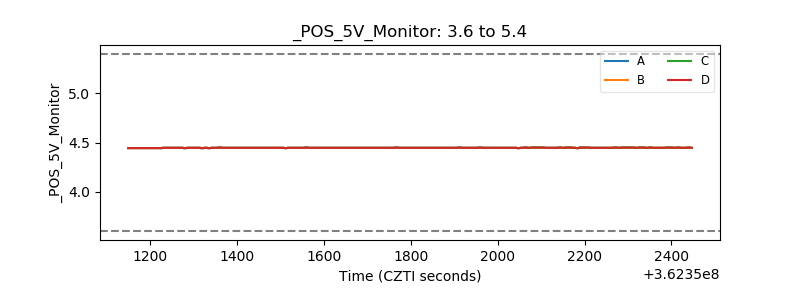 |
| _ROLL_ROT |  |
| _Roll_DEC | 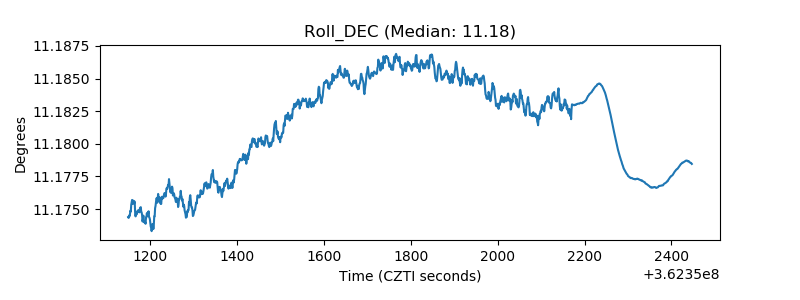 |
| _Roll_RA | 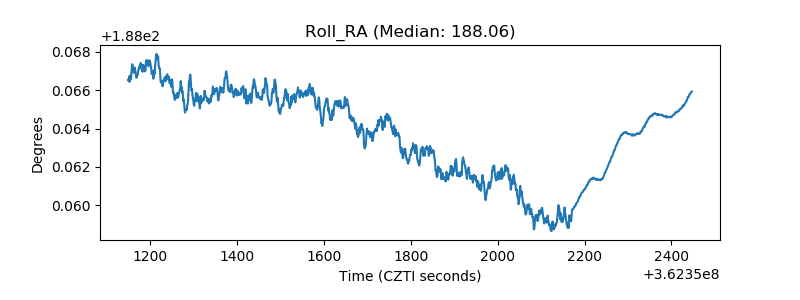 |
| Veto Counter | 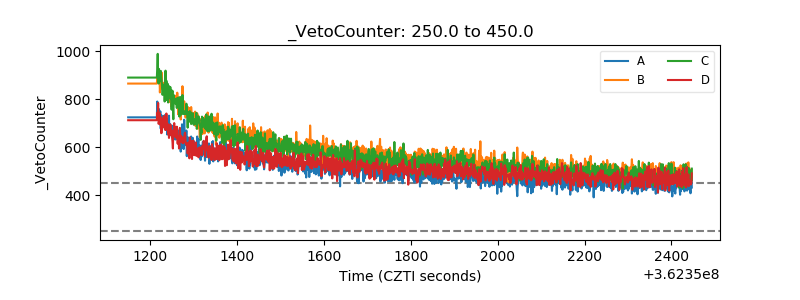 |