| Param | Original file | Final file |
|---|---|---|
| Filename | modeM0/AS1A10_071T69_9000004488cztM0_level2.fits | modeM0/AS1A10_071T69_9000004488cztM0_level2_quad_clean.evt |
| Size (bytes) | 117,550,080 | 64,094,400 |
| Size | 112.1 MB | 61.1 MB |
| Events in quadrant A | 736,740 | 296,739 |
| Events in quadrant B | 691,040 | 292,220 |
| Events in quadrant C | 704,904 | 277,236 |
| Events in quadrant D | 597,472 | 243,435 |
| Mode SS | |||
|---|---|---|---|
| Quadrant | BADHDUFLAG | Total packets | Discarded packets |
| A | 0 | 244 | 0 |
| B | 0 | 244 | 0 |
| C | 0 | 244 | 0 |
| D | 0 | 244 | 0 |
| Mode M9 | |||
|---|---|---|---|
| Quadrant | BADHDUFLAG | Total packets | Discarded packets |
| A | 0 | 18 | 0 |
| B | 0 | 18 | 0 |
| C | 0 | 18 | 0 |
| D | 0 | 18 | 0 |
| Mode M0 | |||
|---|---|---|---|
| Quadrant | BADHDUFLAG | Total packets | Discarded packets |
| A | 0 | 24765 | 0 |
| B | 0 | 36950 | 0 |
| C | 0 | 25834 | 0 |
| D | 0 | 35974 | 0 |
| Quadrant | Total seconds | Saturated seconds | Saturation percentage |
|---|---|---|---|
| A | 11996 | 56 | 0.466822% |
| B | 11996 | 290 | 2.417472% |
| C | 11996 | 265 | 2.209070% |
| D | 11996 | 806 | 6.718906% |
Noise dominated data is calculated using 1-second bins in cleaned event files. If a bin has >2000 counts, and if more than 50% of those come from <1% of pixels, then it is considered to be noise-dominated and hence unusable.
| Quadrant | # 1 sec bins | Bins with >0 counts | Bins with >2000 counts | High rate bins dominated by noise | Noise dominated (total time) | Noise dominated (detector-on time) | Marked lightcurve |
|---|---|---|---|---|---|---|---|
| A | 13825 | 11993 | 0 | 0 | 0.00% | 0.00% |  |
| B | 13826 | 11995 | 0 | 0 | 0.00% | 0.00% |  |
| C | 13825 | 11994 | 0 | 0 | 0.00% | 0.00% |  |
| D | 13825 | 11972 | 0 | 0 | 0.00% | 0.00% |  |
Top three noisy pixels from each quadrant. If the there are fewer than three noisy pixels in the level2.evt file, extra rows are filled as -1
| Pixel properties | Quadrant properties | ||||||
|---|---|---|---|---|---|---|---|
| Quadrant | DetID | PixID | Counts | Sigma | Mean | Median | Sigma |
| A | 0 | 29 | 691 | 10.35 | 192 | 181 | 49.3 |
| A | 7 | 110 | 584 | 8.18 | 192 | 181 | 49.3 |
| A | 0 | 30 | 540 | 7.28 | 192 | 181 | 49.3 |
| B | 2 | 9 | 523 | 9.21 | 182 | 174 | 37.9 |
| B | 3 | 17 | 468 | 7.76 | 182 | 174 | 37.9 |
| B | 5 | 128 | 446 | 7.18 | 182 | 174 | 37.9 |
| C | 1 | 81 | 554 | 7.76 | 186 | 175 | 48.8 |
| C | 1 | 80 | 534 | 7.35 | 186 | 175 | 48.8 |
| C | 12 | 241 | 524 | 7.15 | 186 | 175 | 48.8 |
| D | 15 | 46 | 449 | 6.22 | 170 | 154 | 47.5 |
| D | 10 | 189 | 440 | 6.03 | 170 | 154 | 47.5 |
| D | 4 | 246 | 432 | 5.86 | 170 | 154 | 47.5 |
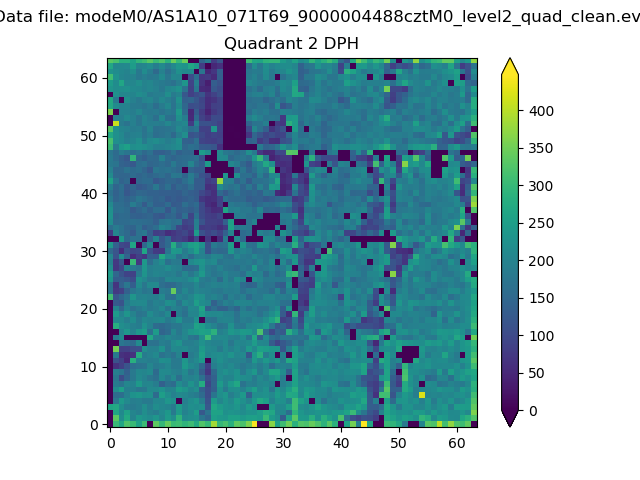
Histogram calculated using DETX and DETY for each event in the final _common_clean file
| Quadrant A |  |
 |
Quadrant B |
|---|---|---|---|
| Quadrant D |  |
 |
Quadrant C |
| Plot type | Count rate plots | Images |
|---|---|---|
| Comparison with Poisson distribution Blue bars denote a histogram of data divided into 1 sec bins. Red curve is a Poisson curve with rate = median count rate of data. |
 |
 |
| Quadrant-wise count rates Data is divided into 100 sec bins |
 |
|
| Module-wise count rates for Quadrant A Data is divided into 100 sec bins |
 |
 |
| Module-wise count rates for Quadrant B Data is divided into 100 sec bins |
 |
 |
| Module-wise count rates for Quadrant C Data is divided into 100 sec bins |
 |
 |
| Module-wise count rates for Quadrant D Data is divided into 100 sec bins |
 |
 |
| Parameter | Plot |
|---|---|
| CZT HV Monitor |  |
| D_VDD |  |
| Temperature 1 |  |
| Veto HV Monitor |  |
| Veto LLD |  |
| Alpha Counter |  |
| _CPM_Rate |  |
| CZT Counter |  |
| +2.5 Volts monitor |  |
| +5 Volts monitor |  |
| _ROLL_ROT |  |
| _Roll_DEC |  |
| _Roll_RA |  |
| Veto Counter |  |