| Param | Original file | Final file |
|---|---|---|
| Filename | modeM0/AS1A10_071T69_9000004488_31051cztM0_level2.evt | modeM0/AS1A10_071T69_9000004488_31051cztM0_level2_quad_clean.evt |
| Size (bytes) | 448,329,600 | 57,240,000 |
| Size | 427.6 MB | 54.6 MB |
| Events in quadrant A | 2,466,889 | 360,810 |
| Events in quadrant B | 4,087,194 | 359,860 |
| Events in quadrant C | 2,724,307 | 340,272 |
| Events in quadrant D | 3,962,934 | 324,191 |
| Mode SS | |||
|---|---|---|---|
| Quadrant | BADHDUFLAG | Total packets | Discarded packets |
| A | 0 | 100 | 0 |
| B | 0 | 100 | 0 |
| C | 0 | 100 | 0 |
| D | 0 | 100 | 0 |
| Mode M9 | |||
|---|---|---|---|
| Quadrant | BADHDUFLAG | Total packets | Discarded packets |
| A | 0 | 11 | 0 |
| B | 0 | 11 | 0 |
| C | 0 | 11 | 0 |
| D | 0 | 11 | 0 |
| Mode M0 | |||
|---|---|---|---|
| Quadrant | BADHDUFLAG | Total packets | Discarded packets |
| A | 0 | 10415 | 1 |
| B | 0 | 15465 | 2 |
| C | 0 | 11132 | 1 |
| D | 0 | 15071 | 1 |
| Quadrant | Total seconds | Saturated seconds | Saturation percentage |
|---|---|---|---|
| A | 4963 | 42 | 0.846262% |
| B | 4962 | 164 | 3.305119% |
| C | 4962 | 147 | 2.962515% |
| D | 4962 | 298 | 6.005643% |
Noise dominated data is calculated using 1-second bins in cleaned event files. If a bin has >2000 counts, and if more than 50% of those come from <1% of pixels, then it is considered to be noise-dominated and hence unusable.
| Quadrant | # 1 sec bins | Bins with >0 counts | Bins with >2000 counts | High rate bins dominated by noise | Noise dominated (total time) | Noise dominated (detector-on time) | Marked lightcurve |
|---|---|---|---|---|---|---|---|
| A | 6063 | 4963 | 0 | 0 | 0.00% | 0.00% | 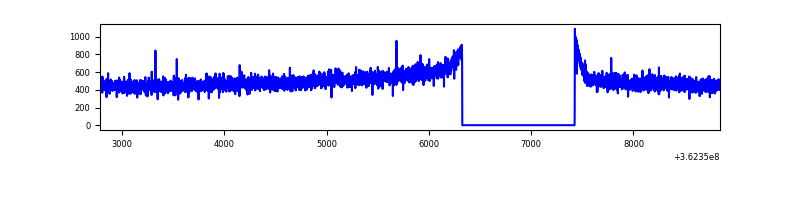 |
| B | 6062 | 4963 | 25 | 25 | 0.41% | 0.50% | 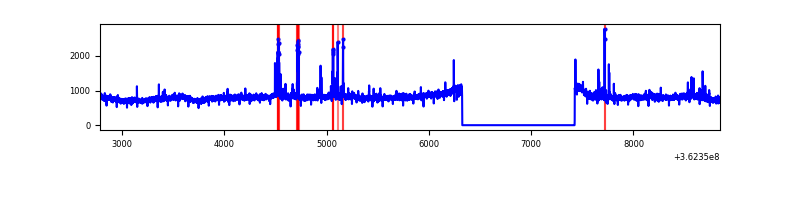 |
| C | 6062 | 4963 | 16 | 16 | 0.26% | 0.32% | 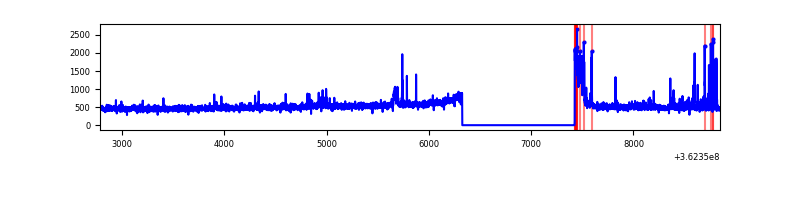 |
| D | 6062 | 4963 | 263 | 263 | 4.34% | 5.30% | 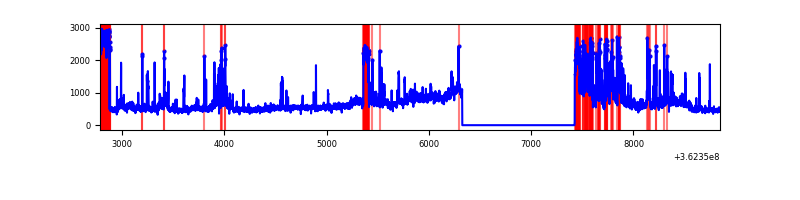 |
Top three noisy pixels from each quadrant. If the there are fewer than three noisy pixels in the level2.evt file, extra rows are filled as -1
| Pixel properties | Quadrant properties | ||||||
|---|---|---|---|---|---|---|---|
| Quadrant | DetID | PixID | Counts | Sigma | Mean | Median | Sigma |
| A | 13 | 254 | 8706 | 62.78 | 639 | 629 | 128.7 |
| A | 3 | 137 | 6439 | 45.16 | 639 | 629 | 128.7 |
| A | 0 | 226 | 5315 | 36.42 | 639 | 629 | 128.7 |
| B | 6 | 159 | 1433879 | 11772.84 | 630 | 613 | 121.7 |
| B | 4 | 80 | 105422 | 860.9 | 630 | 613 | 121.7 |
| B | 0 | 183 | 36646 | 295.97 | 630 | 613 | 121.7 |
| C | 14 | 238 | 99177 | 686.09 | 604 | 608 | 143.7 |
| C | 0 | 10 | 94196 | 651.42 | 604 | 608 | 143.7 |
| C | 3 | 233 | 76408 | 527.61 | 604 | 608 | 143.7 |
| D | 8 | 195 | 568036 | 4012.6 | 591 | 575 | 141.4 |
| D | 13 | 174 | 551056 | 3892.53 | 591 | 575 | 141.4 |
| D | 6 | 219 | 253047 | 1785.27 | 591 | 575 | 141.4 |
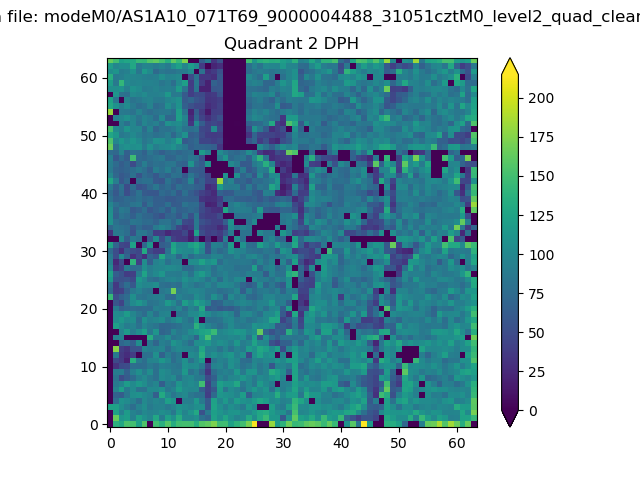
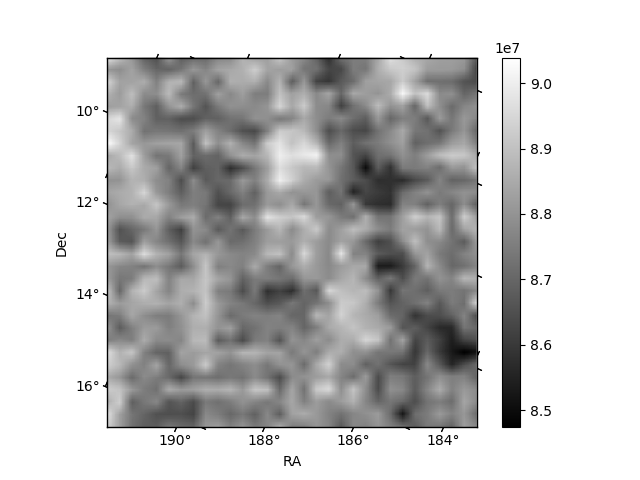
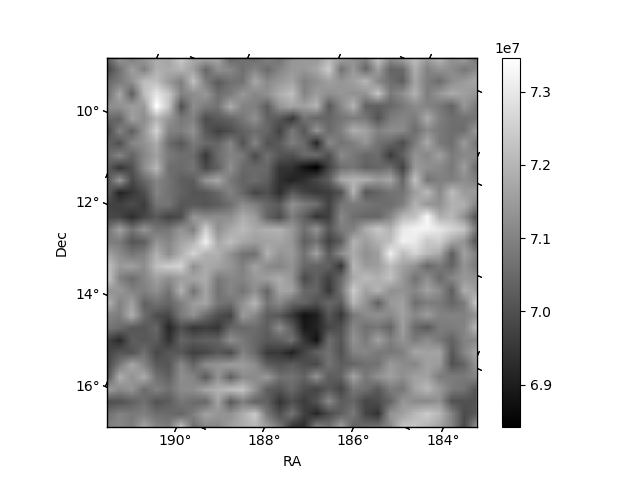
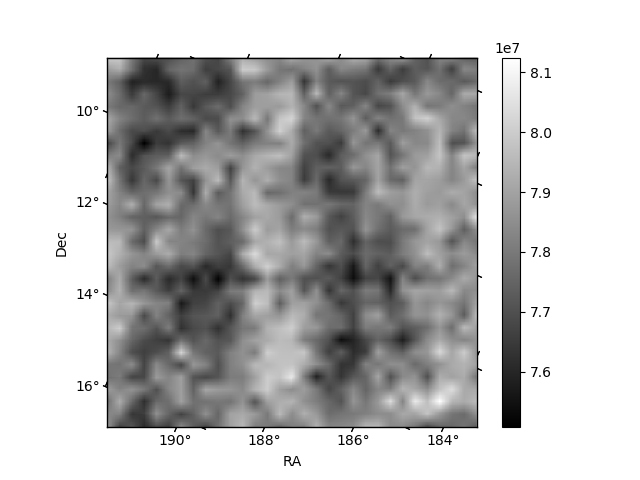
Histogram calculated using DETX and DETY for each event in the final _common_clean file
| Quadrant A | 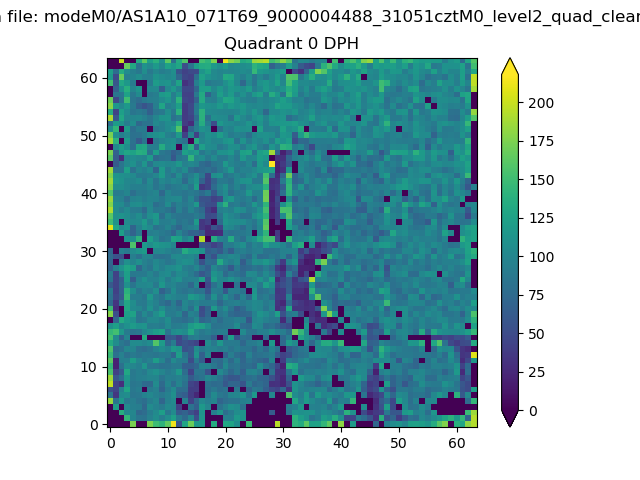 |
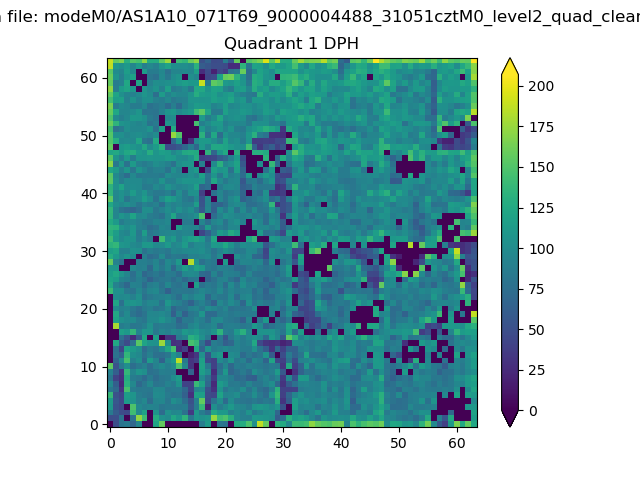 |
Quadrant B |
|---|---|---|---|
| Quadrant D | 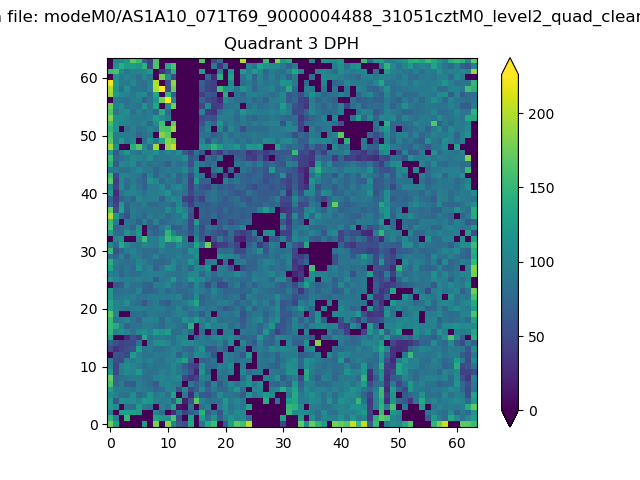 |
 |
Quadrant C |
| Plot type | Count rate plots | Images |
|---|---|---|
| Comparison with Poisson distribution Blue bars denote a histogram of data divided into 1 sec bins. Red curve is a Poisson curve with rate = median count rate of data. |
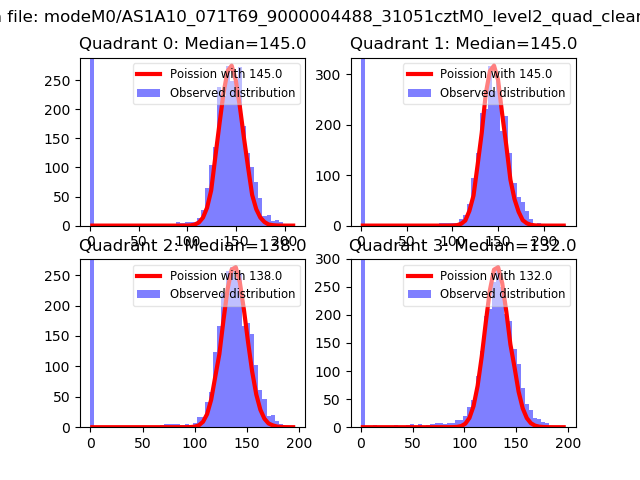 |
 |
| Quadrant-wise count rates Data is divided into 100 sec bins |
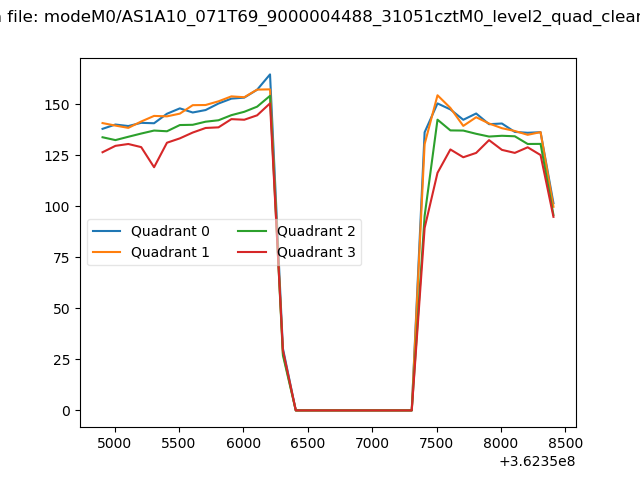 |
|
| Module-wise count rates for Quadrant A Data is divided into 100 sec bins |
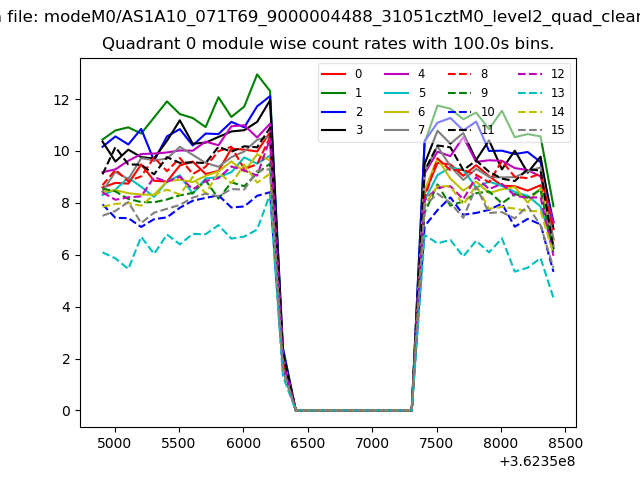 |
 |
| Module-wise count rates for Quadrant B Data is divided into 100 sec bins |
 |
 |
| Module-wise count rates for Quadrant C Data is divided into 100 sec bins |
 |
 |
| Module-wise count rates for Quadrant D Data is divided into 100 sec bins |
 |
 |
| Parameter | Plot |
|---|---|
| CZT HV Monitor |  |
| D_VDD | 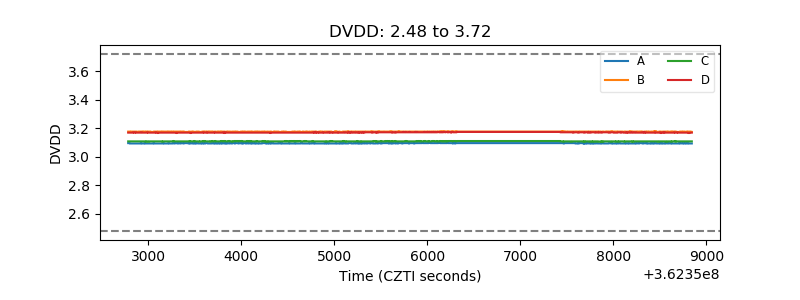 |
| Temperature 1 | 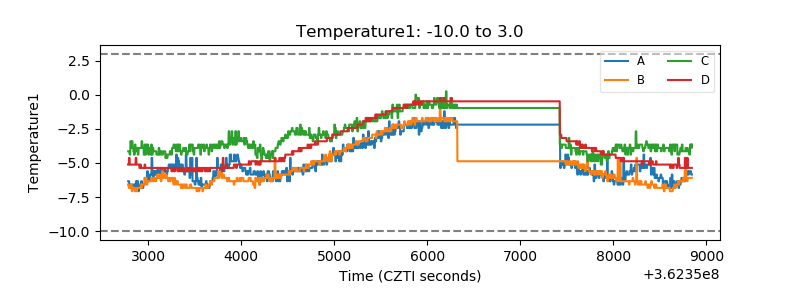 |
| Veto HV Monitor | 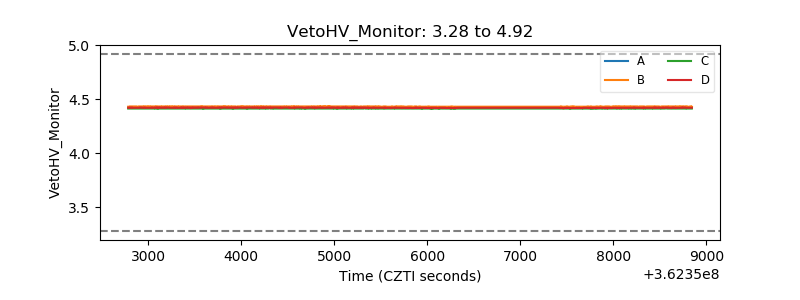 |
| Veto LLD | 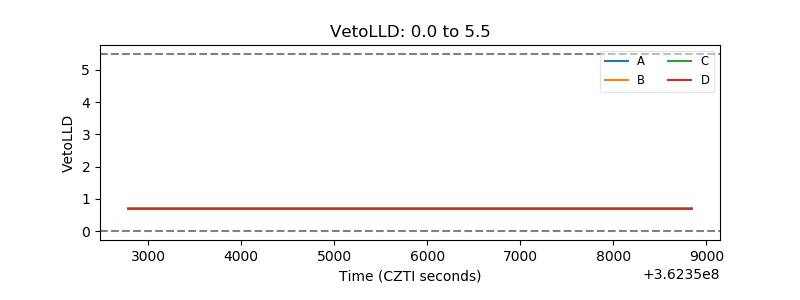 |
| Alpha Counter | 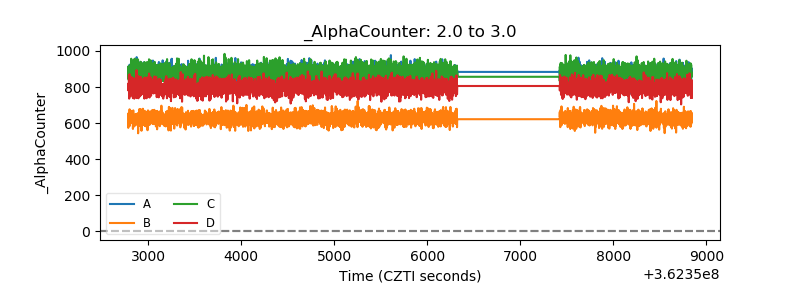 |
| _CPM_Rate | 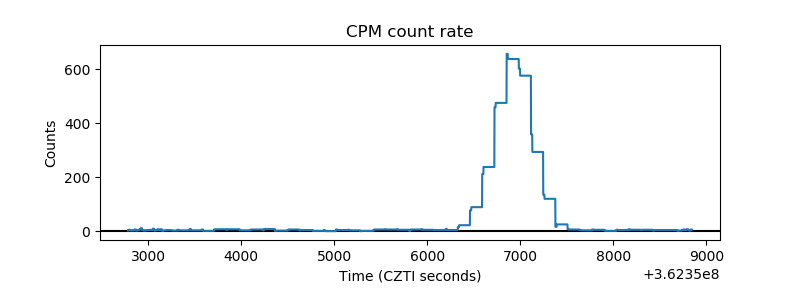 |
| CZT Counter | 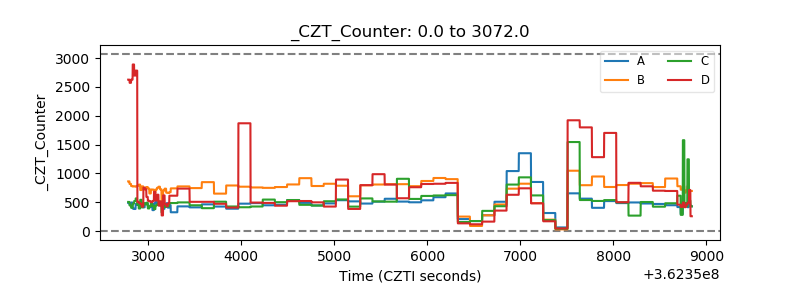 |
| +2.5 Volts monitor |  |
| +5 Volts monitor |  |
| _ROLL_ROT | 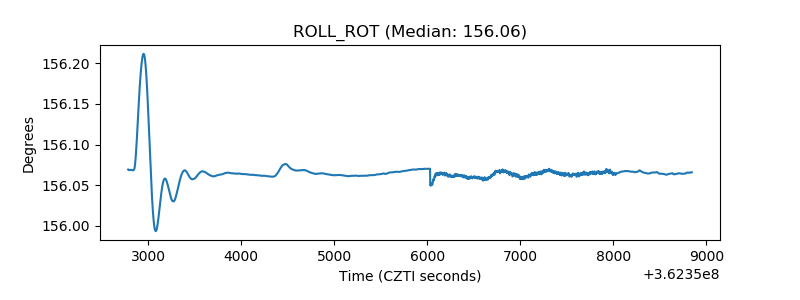 |
| _Roll_DEC | 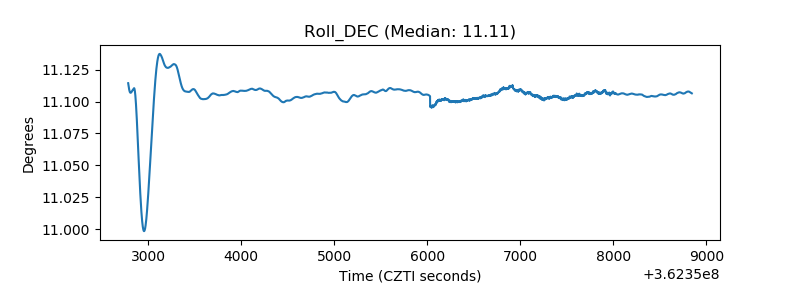 |
| _Roll_RA |  |
| Veto Counter |  |