| Param | Original file | Final file |
|---|---|---|
| Filename | modeM0/AS1C06_002T01_9000004490_31052cztM0_level2.evt | modeM0/AS1C06_002T01_9000004490_31052cztM0_level2_quad_clean.evt |
| Size (bytes) | 208,857,600 | 44,835,840 |
| Size | 199.2 MB | 42.8 MB |
| Events in quadrant A | 1,115,241 | 311,180 |
| Events in quadrant B | 1,847,726 | 307,301 |
| Events in quadrant C | 1,207,450 | 297,889 |
| Events in quadrant D | 1,997,969 | 276,232 |
| Mode M0 | |||
|---|---|---|---|
| Quadrant | BADHDUFLAG | Total packets | Discarded packets |
| A | 0 | 4802 | 1 |
| B | 0 | 7111 | 3 |
| C | 0 | 5031 | 1 |
| D | 0 | 7530 | 1 |
| Mode M9 | |||
|---|---|---|---|
| Quadrant | BADHDUFLAG | Total packets | Discarded packets |
| A | 0 | 7 | 0 |
| B | 0 | 7 | 0 |
| C | 0 | 7 | 0 |
| D | 0 | 7 | 0 |
| Mode SS | |||
|---|---|---|---|
| Quadrant | BADHDUFLAG | Total packets | Discarded packets |
| A | 0 | 48 | 0 |
| B | 0 | 48 | 0 |
| C | 0 | 48 | 0 |
| D | 0 | 48 | 0 |
| Quadrant | Total seconds | Saturated seconds | Saturation percentage |
|---|---|---|---|
| A | 2282 | 11 | 0.482033% |
| B | 2281 | 98 | 4.296361% |
| C | 2281 | 90 | 3.945638% |
| D | 2281 | 236 | 10.346339% |
Noise dominated data is calculated using 1-second bins in cleaned event files. If a bin has >2000 counts, and if more than 50% of those come from <1% of pixels, then it is considered to be noise-dominated and hence unusable.
| Quadrant | # 1 sec bins | Bins with >0 counts | Bins with >2000 counts | High rate bins dominated by noise | Noise dominated (total time) | Noise dominated (detector-on time) | Marked lightcurve |
|---|---|---|---|---|---|---|---|
| A | 3012 | 2283 | 1 | 1 | 0.03% | 0.04% | 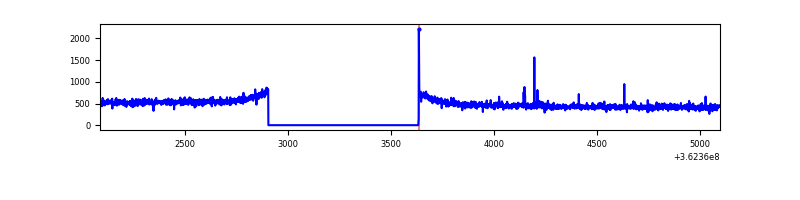 |
| B | 3011 | 2282 | 10 | 10 | 0.33% | 0.44% | 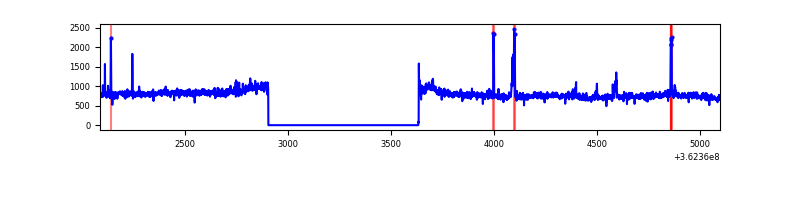 |
| C | 3011 | 2282 | 1 | 1 | 0.03% | 0.04% | 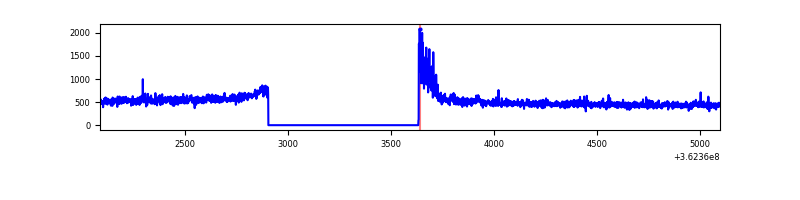 |
| D | 3011 | 2282 | 188 | 188 | 6.24% | 8.24% | 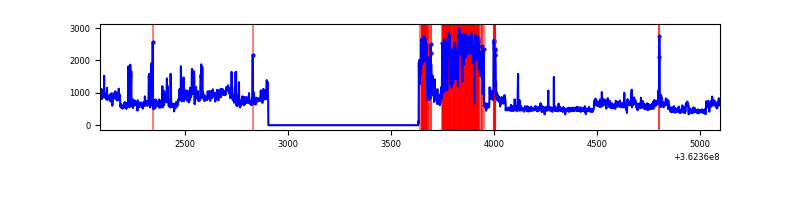 |
Top three noisy pixels from each quadrant. If the there are fewer than three noisy pixels in the level2.evt file, extra rows are filled as -1
| Pixel properties | Quadrant properties | ||||||
|---|---|---|---|---|---|---|---|
| Quadrant | DetID | PixID | Counts | Sigma | Mean | Median | Sigma |
| A | 12 | 96 | 7788 | 126.84 | 286 | 279 | 59.2 |
| A | 13 | 254 | 4261 | 67.27 | 286 | 279 | 59.2 |
| A | 8 | 160 | 3439 | 53.38 | 286 | 279 | 59.2 |
| B | 6 | 159 | 647300 | 11585.96 | 284 | 276 | 55.8 |
| B | 4 | 80 | 38707 | 688.17 | 284 | 276 | 55.8 |
| B | 0 | 183 | 18614 | 328.37 | 284 | 276 | 55.8 |
| C | 0 | 10 | 60442 | 902.63 | 279 | 280 | 66.7 |
| C | 14 | 238 | 43721 | 651.76 | 279 | 280 | 66.7 |
| C | 2 | 114 | 5430 | 77.27 | 279 | 280 | 66.7 |
| D | 13 | 174 | 446997 | 6812.54 | 267 | 259 | 65.6 |
| D | 8 | 195 | 391119 | 5960.42 | 267 | 259 | 65.6 |
| D | 13 | 249 | 86927 | 1321.64 | 267 | 259 | 65.6 |
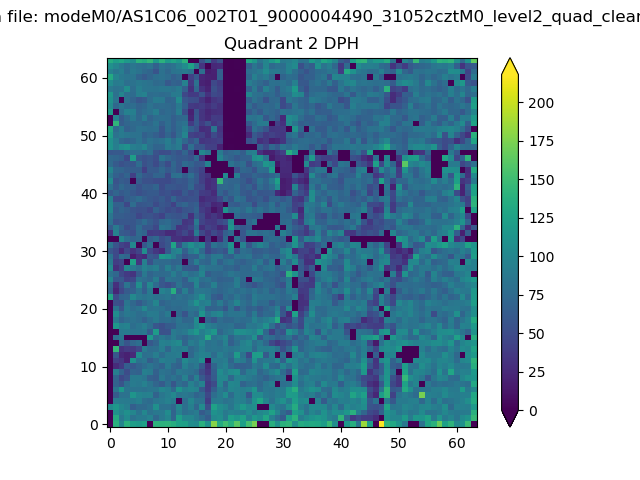
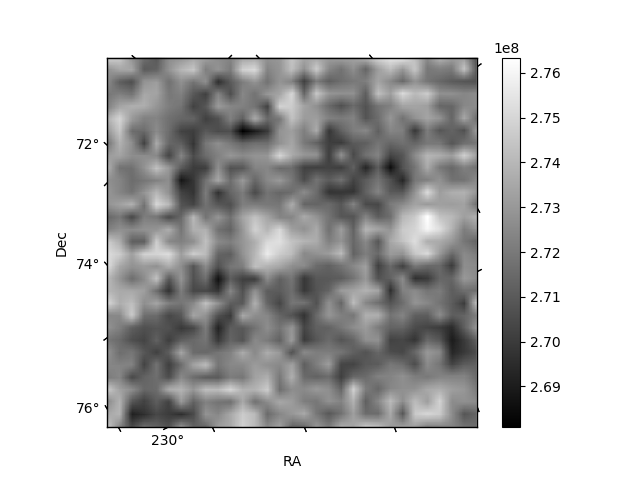
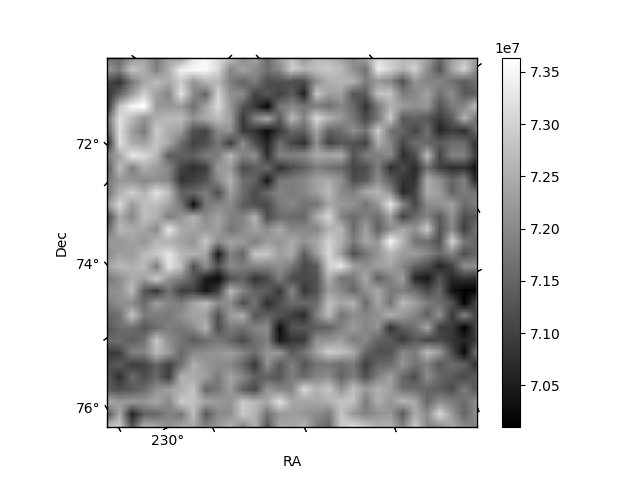
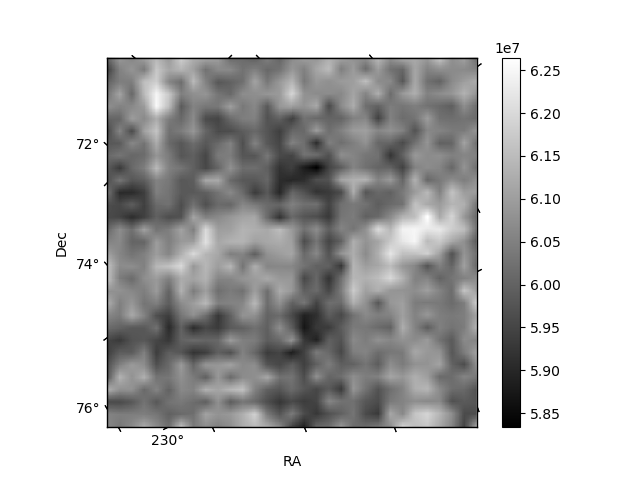
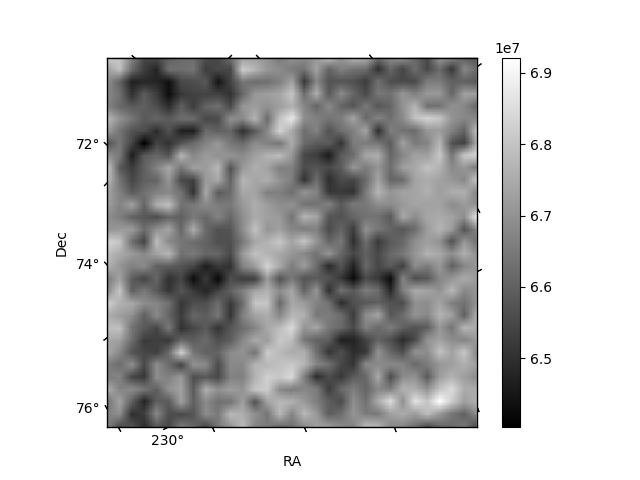
Histogram calculated using DETX and DETY for each event in the final _common_clean file
| Quadrant A | 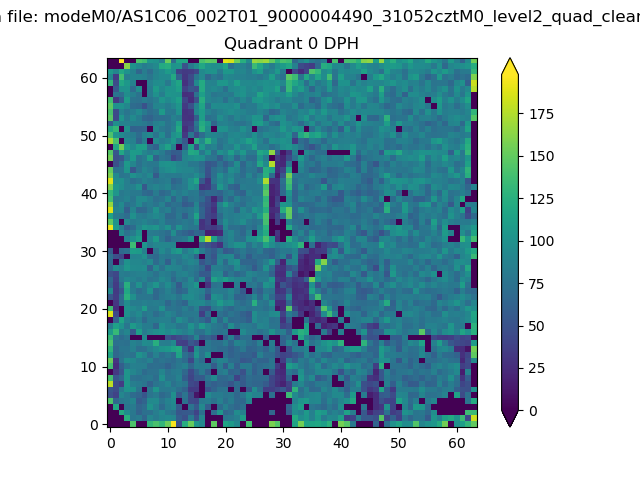 |
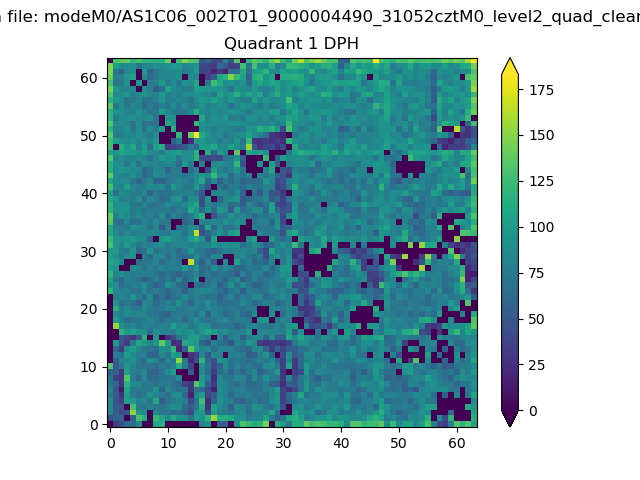 |
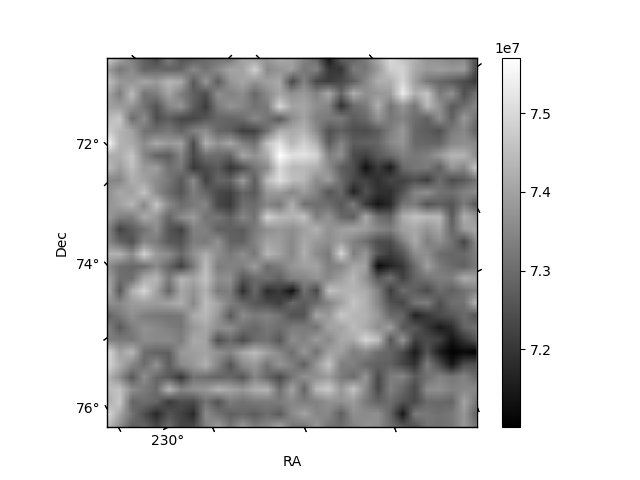
Quadrant B |
|---|---|---|---|
| Quadrant D | 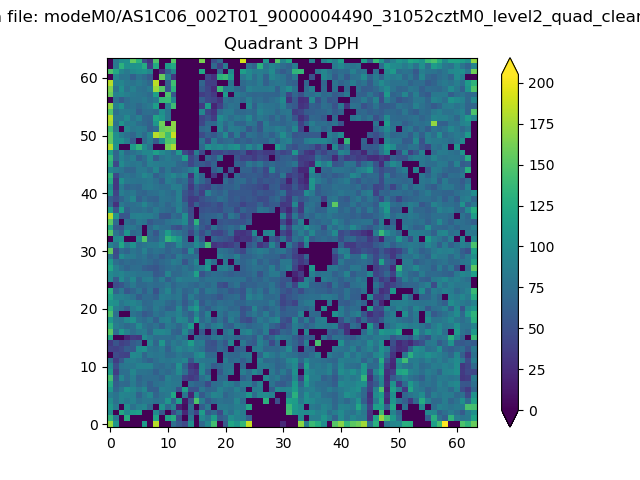 |
 |
Quadrant C |
| Plot type | Count rate plots | Images |
|---|---|---|
| Comparison with Poisson distribution Blue bars denote a histogram of data divided into 1 sec bins. Red curve is a Poisson curve with rate = median count rate of data. |
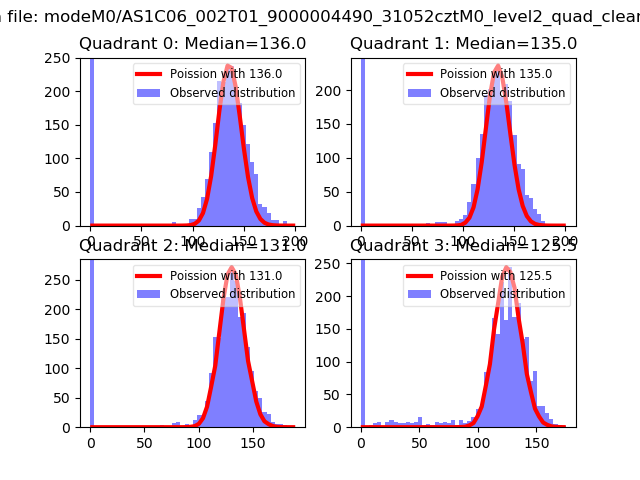 |
 |
| Quadrant-wise count rates Data is divided into 100 sec bins |
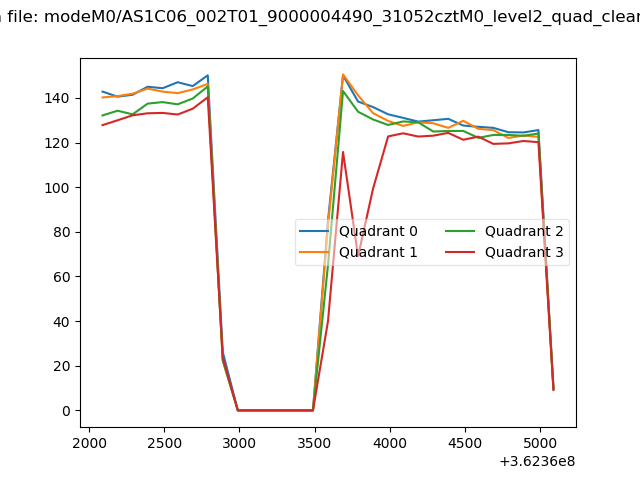 |
|
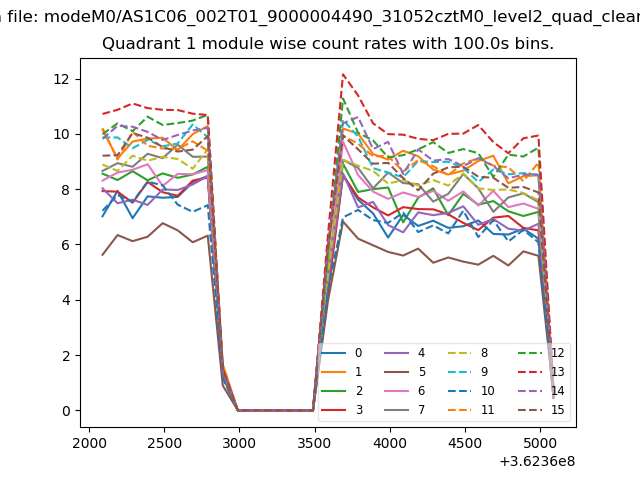
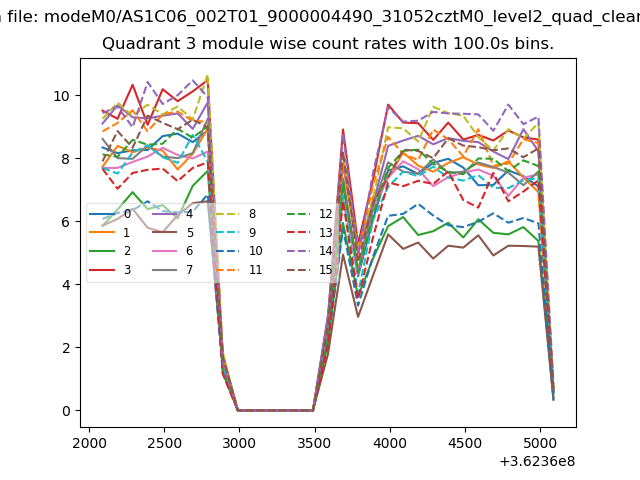
| Module-wise count rates for Quadrant A Data is divided into 100 sec bins |
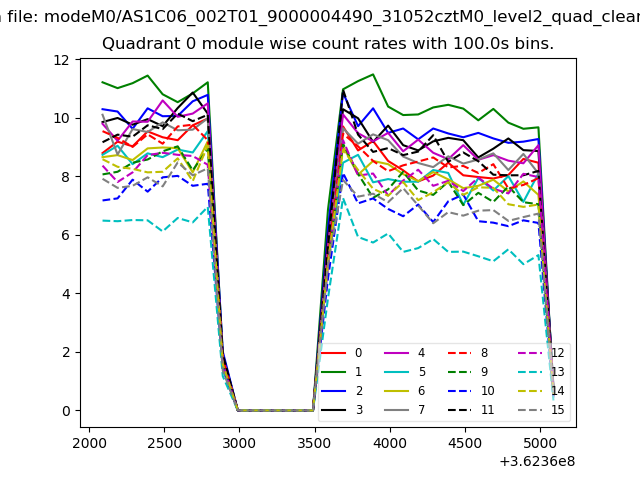 |
 |
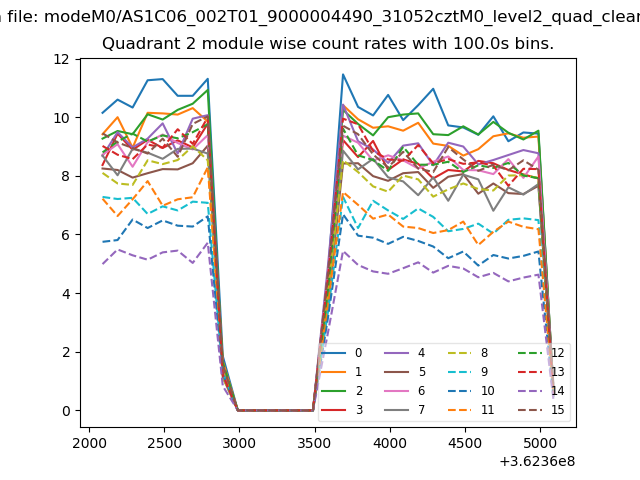
| Module-wise count rates for Quadrant B Data is divided into 100 sec bins |
 |
 |
| Module-wise count rates for Quadrant C Data is divided into 100 sec bins |
 |
 |
| Module-wise count rates for Quadrant D Data is divided into 100 sec bins |
 |
 |
| Parameter | Plot |
|---|---|
| CZT HV Monitor | 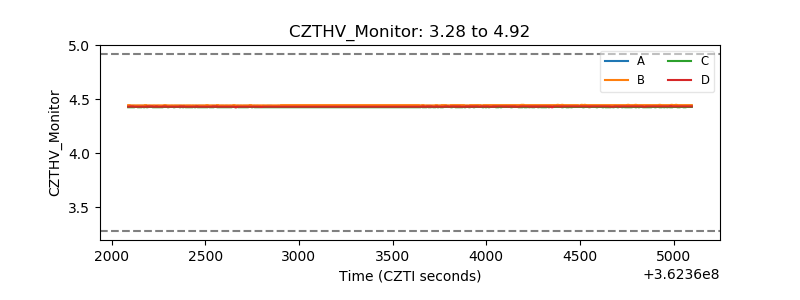 |
| D_VDD | 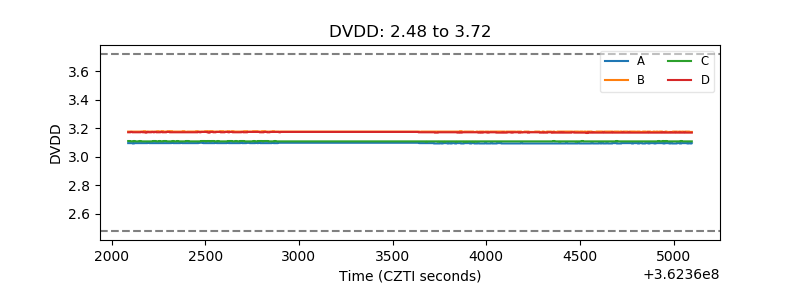 |
| Temperature 1 | 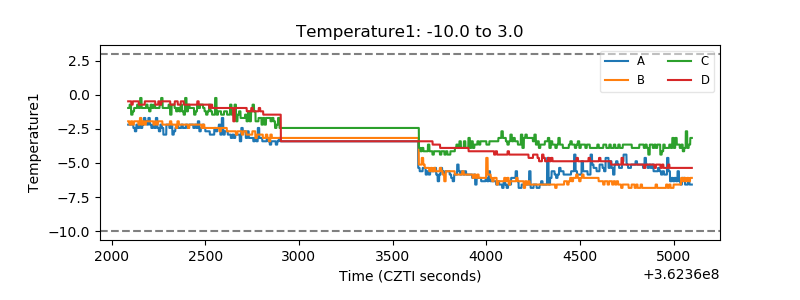 |
| Veto HV Monitor |  |
| Veto LLD | 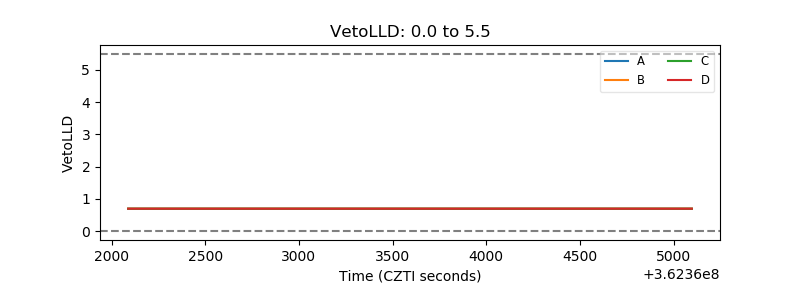 |
| Alpha Counter | 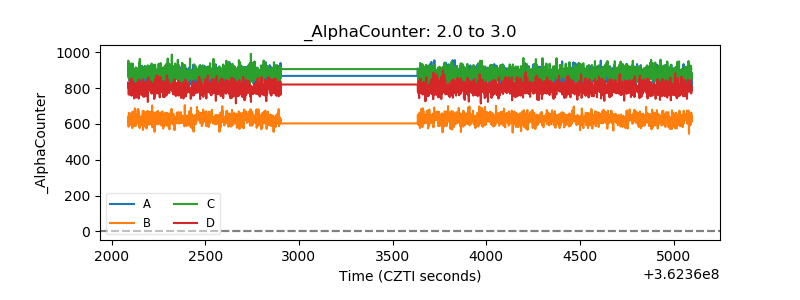 |
| _CPM_Rate | 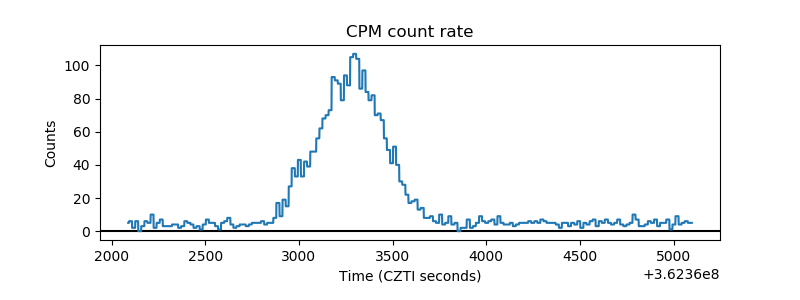 |
| CZT Counter | 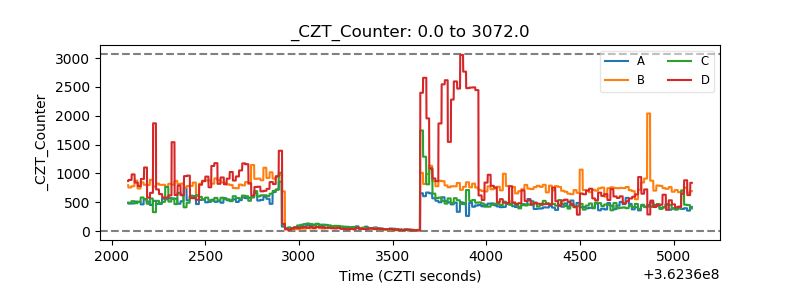 |
| +2.5 Volts monitor |  |
| +5 Volts monitor |  |
| _ROLL_ROT | 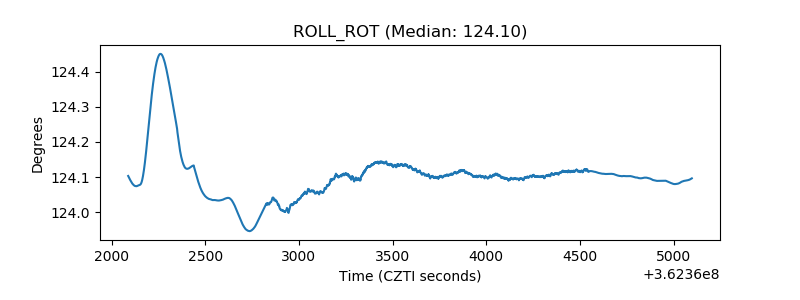 |
| _Roll_DEC | 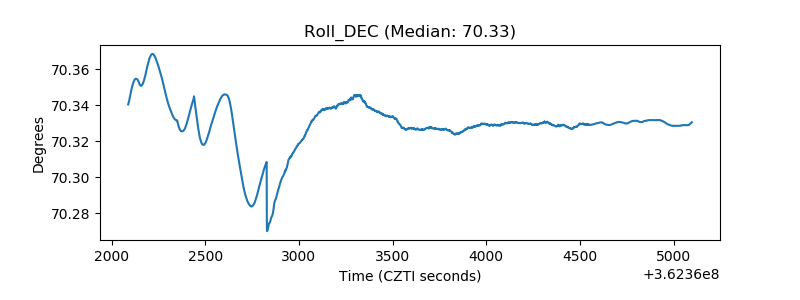 |
| _Roll_RA | 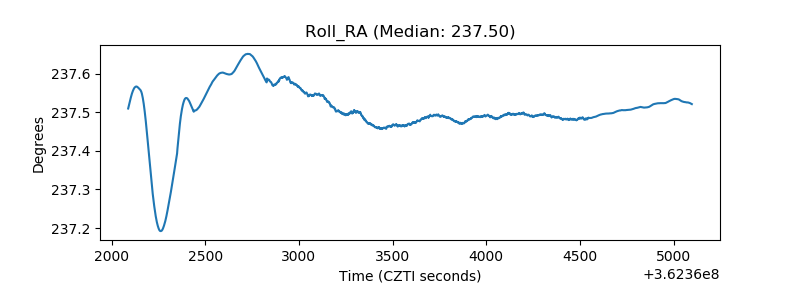 |
| Veto Counter | 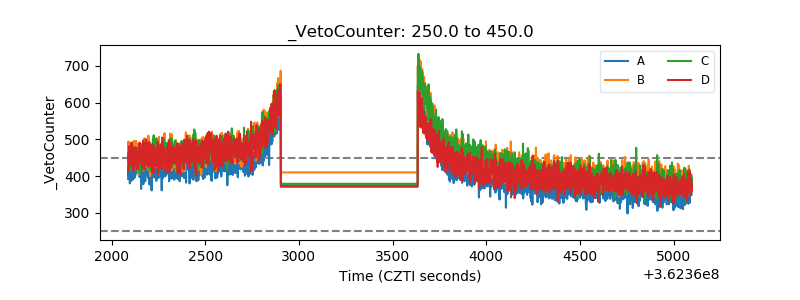 |