| Param | Original file | Final file |
|---|---|---|
| Filename | modeM0/AS1C06_002T01_9000004490_31053cztM0_level2.evt | modeM0/AS1C06_002T01_9000004490_31053cztM0_level2_quad_clean.evt |
| Size (bytes) | 835,807,680 | 127,336,320 |
| Size | 797.1 MB | 121.4 MB |
| Events in quadrant A | 3,670,855 | 886,570 |
| Events in quadrant B | 6,333,318 | 871,836 |
| Events in quadrant C | 3,880,431 | 858,872 |
| Events in quadrant D | 10,896,570 | 691,196 |
| Mode M0 | |||
|---|---|---|---|
| Quadrant | BADHDUFLAG | Total packets | Discarded packets |
| A | 0 | 16287 | 2 |
| B | 0 | 24678 | 3 |
| C | 0 | 16718 | 2 |
| D | 0 | 37861 | 2 |
| Mode M9 | |||
|---|---|---|---|
| Quadrant | BADHDUFLAG | Total packets | Discarded packets |
| A | 0 | 10 | 0 |
| B | 0 | 10 | 0 |
| C | 0 | 10 | 0 |
| D | 0 | 10 | 0 |
| Mode SS | |||
|---|---|---|---|
| Quadrant | BADHDUFLAG | Total packets | Discarded packets |
| A | 0 | 162 | 0 |
| B | 0 | 162 | 0 |
| C | 0 | 162 | 0 |
| D | 0 | 162 | 0 |
| Quadrant | Total seconds | Saturated seconds | Saturation percentage |
|---|---|---|---|
| A | 7867 | 48 | 0.610144% |
| B | 7866 | 298 | 3.788457% |
| C | 7866 | 170 | 2.161200% |
| D | 7866 | 2572 | 32.697686% |
Noise dominated data is calculated using 1-second bins in cleaned event files. If a bin has >2000 counts, and if more than 50% of those come from <1% of pixels, then it is considered to be noise-dominated and hence unusable.
| Quadrant | # 1 sec bins | Bins with >0 counts | Bins with >2000 counts | High rate bins dominated by noise | Noise dominated (total time) | Noise dominated (detector-on time) | Marked lightcurve |
|---|---|---|---|---|---|---|---|
| A | 8877 | 7869 | 2 | 2 | 0.02% | 0.03% | 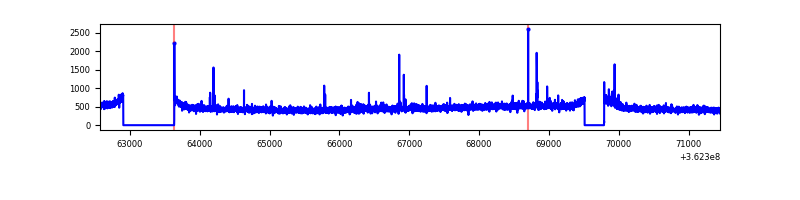 |
| B | 8876 | 7868 | 37 | 37 | 0.42% | 0.47% | 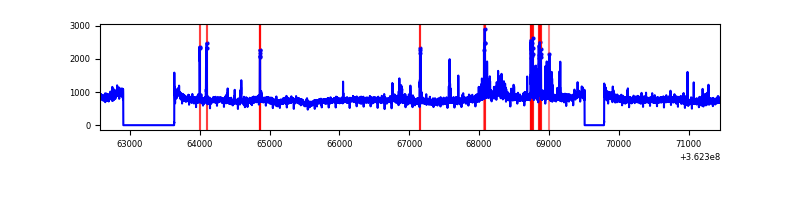 |
| C | 8876 | 7868 | 1 | 1 | 0.01% | 0.01% | 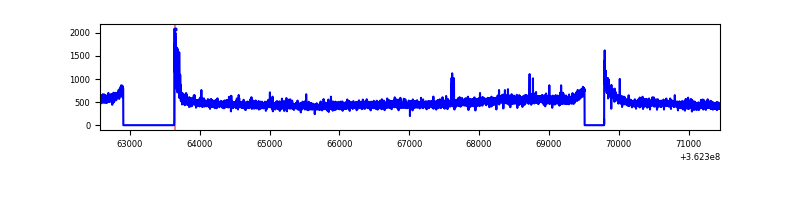 |
| D | 8876 | 7868 | 2422 | 2422 | 27.29% | 30.78% | 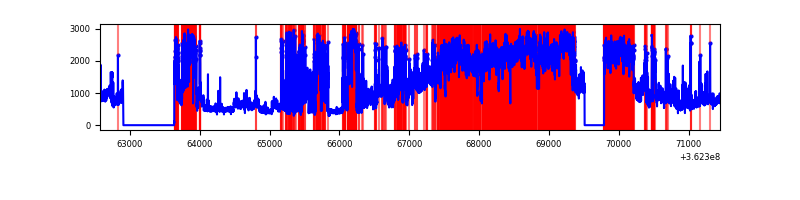 |
Top three noisy pixels from each quadrant. If the there are fewer than three noisy pixels in the level2.evt file, extra rows are filled as -1
| Pixel properties | Quadrant properties | ||||||
|---|---|---|---|---|---|---|---|
| Quadrant | DetID | PixID | Counts | Sigma | Mean | Median | Sigma |
| A | 12 | 96 | 40708 | 211.83 | 940 | 918 | 187.8 |
| A | 13 | 254 | 14674 | 73.23 | 940 | 918 | 187.8 |
| A | 3 | 137 | 9458 | 45.46 | 940 | 918 | 187.8 |
| B | 6 | 159 | 2264352 | 12835.17 | 930 | 905 | 176.3 |
| B | 5 | 172 | 90658 | 508.96 | 930 | 905 | 176.3 |
| B | 0 | 155 | 66223 | 370.39 | 930 | 905 | 176.3 |
| C | 14 | 238 | 145745 | 680.12 | 909 | 911 | 213.0 |
| C | 0 | 10 | 90140 | 419.01 | 909 | 911 | 213.0 |
| C | 1 | 16 | 66352 | 307.3 | 909 | 911 | 213.0 |
| D | 13 | 174 | 6427255 | 34509.38 | 783 | 760 | 186.2 |
| D | 8 | 195 | 1125906 | 6041.88 | 783 | 760 | 186.2 |
| D | 12 | 218 | 136623 | 729.57 | 783 | 760 | 186.2 |
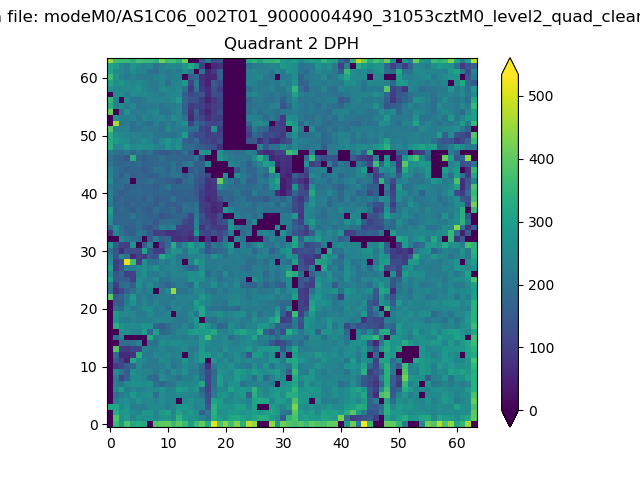
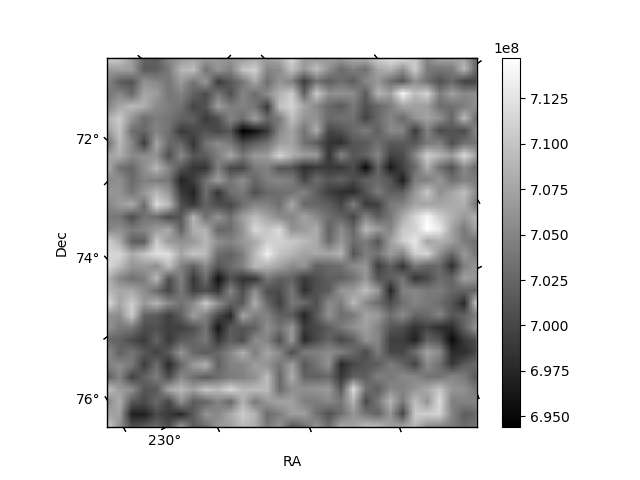
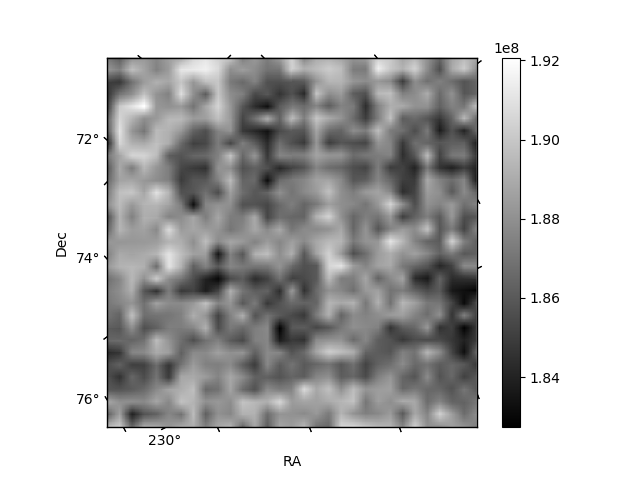
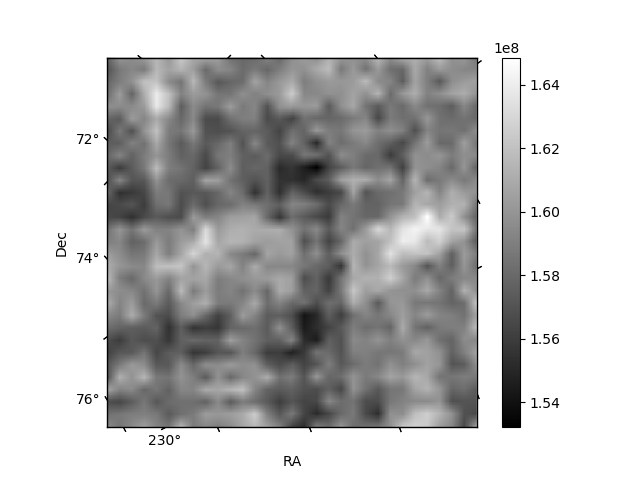
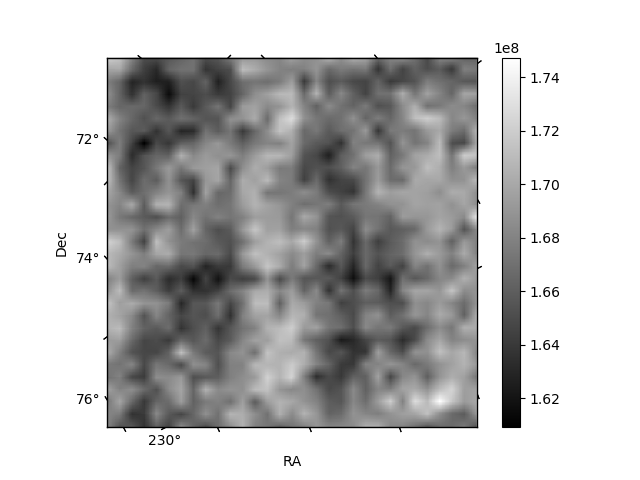
Histogram calculated using DETX and DETY for each event in the final _common_clean file
| Quadrant A | 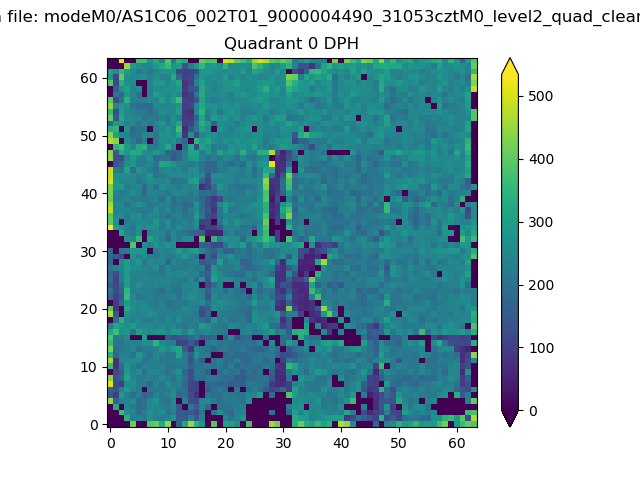 |
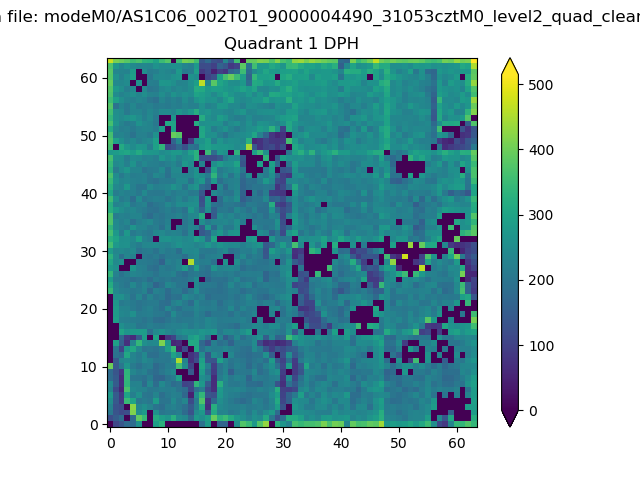 |
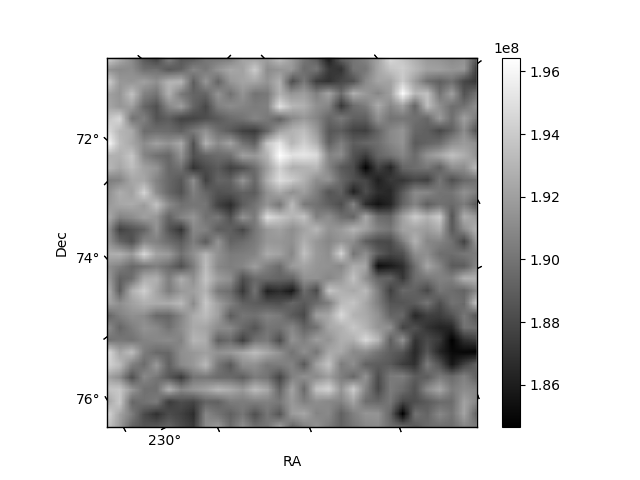
Quadrant B |
|---|---|---|---|
| Quadrant D | 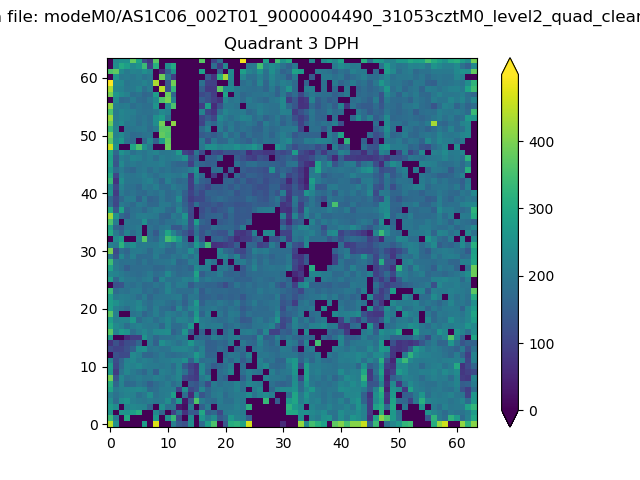 |
 |
Quadrant C |
| Plot type | Count rate plots | Images |
|---|---|---|
| Comparison with Poisson distribution Blue bars denote a histogram of data divided into 1 sec bins. Red curve is a Poisson curve with rate = median count rate of data. |
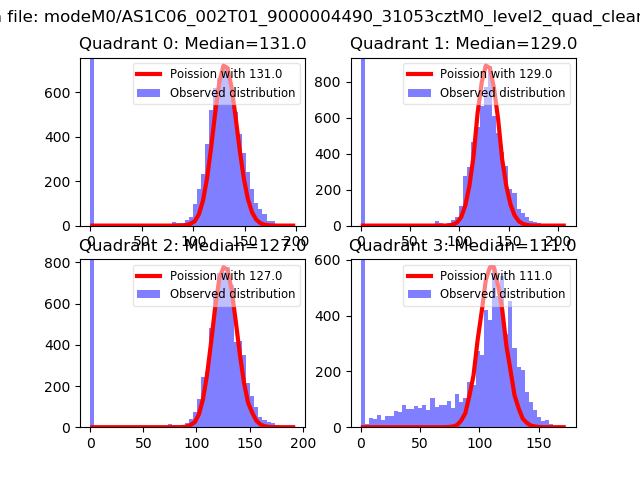 |
 |
| Quadrant-wise count rates Data is divided into 100 sec bins |
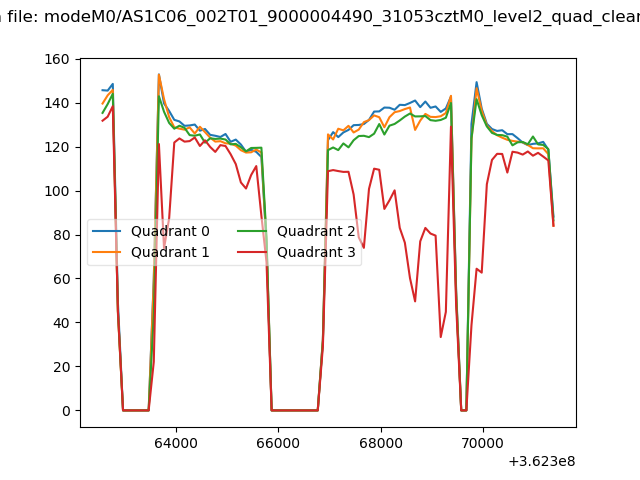 |
|
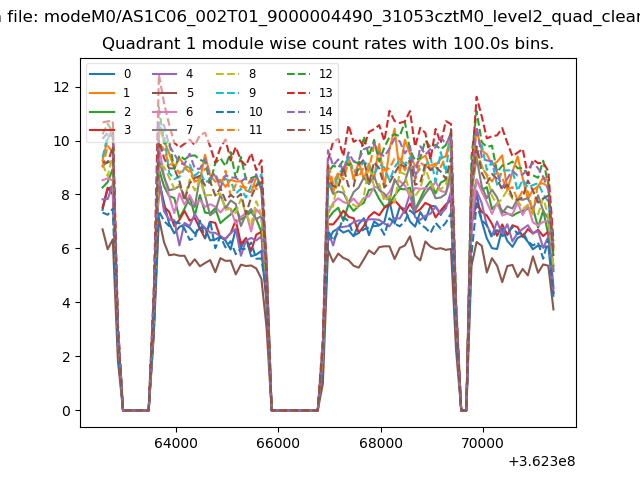
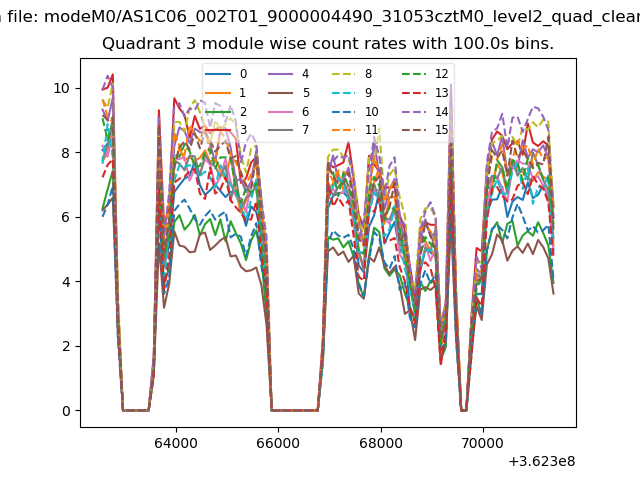
| Module-wise count rates for Quadrant A Data is divided into 100 sec bins |
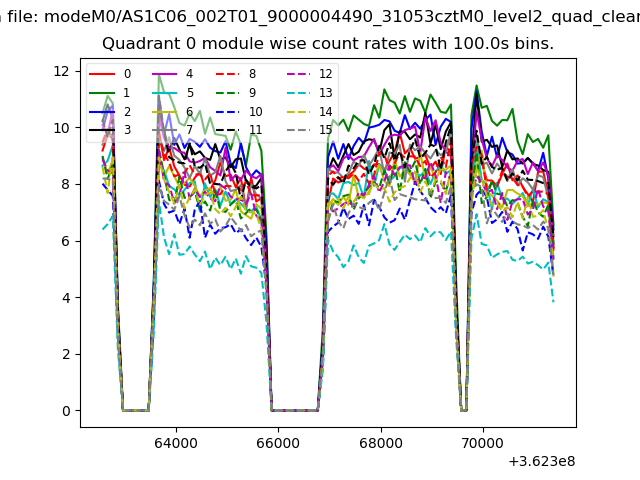 |
 |
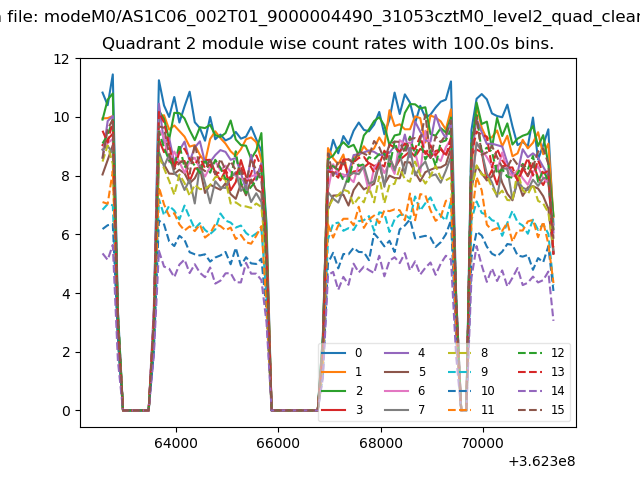
| Module-wise count rates for Quadrant B Data is divided into 100 sec bins |
 |
 |
| Module-wise count rates for Quadrant C Data is divided into 100 sec bins |
 |
 |
| Module-wise count rates for Quadrant D Data is divided into 100 sec bins |
 |
 |
| Parameter | Plot |
|---|---|
| CZT HV Monitor |  |
| D_VDD | 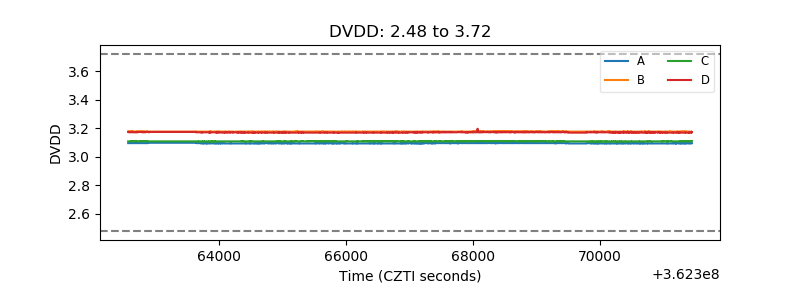 |
| Temperature 1 | 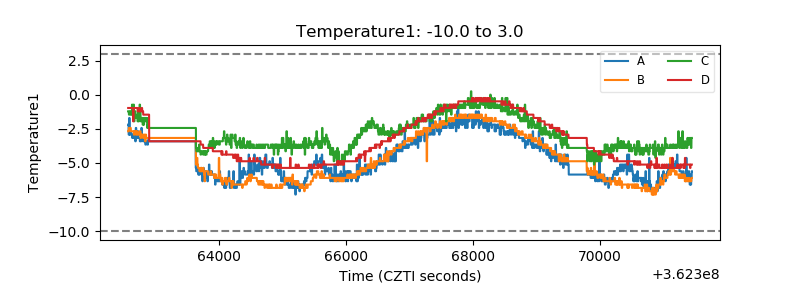 |
| Veto HV Monitor | 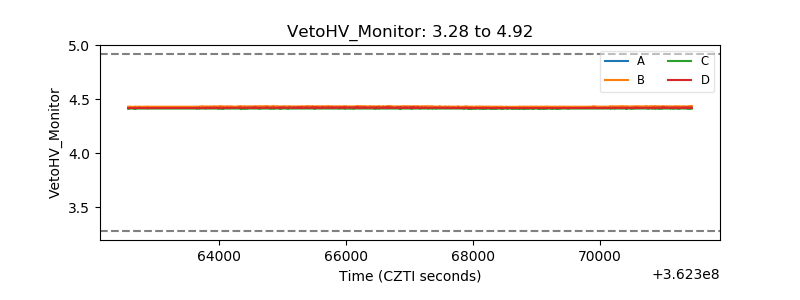 |
| Veto LLD | 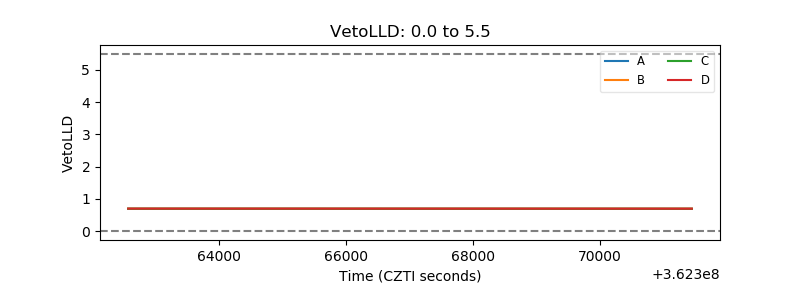 |
| Alpha Counter | 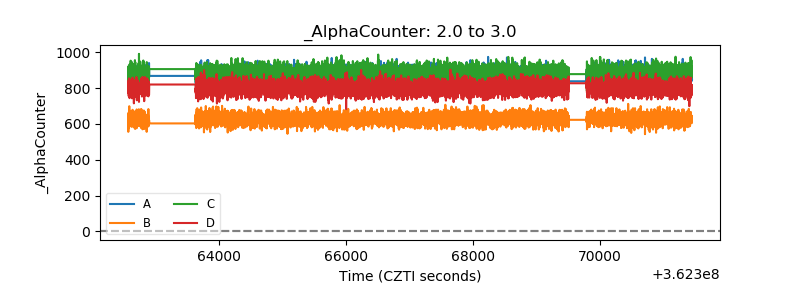 |
| _CPM_Rate | 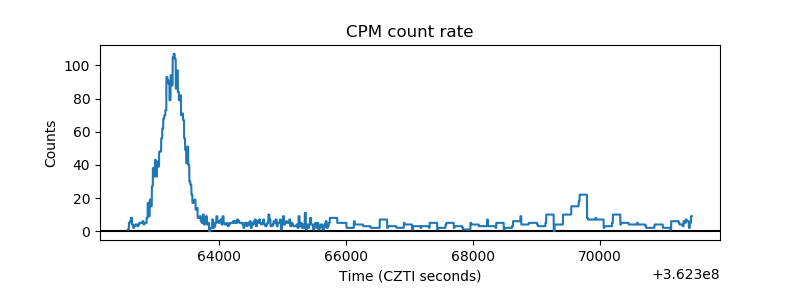 |
| CZT Counter | 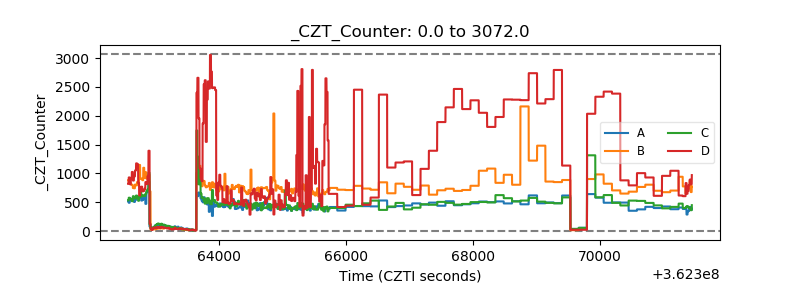 |
| +2.5 Volts monitor |  |
| +5 Volts monitor |  |
| _ROLL_ROT | 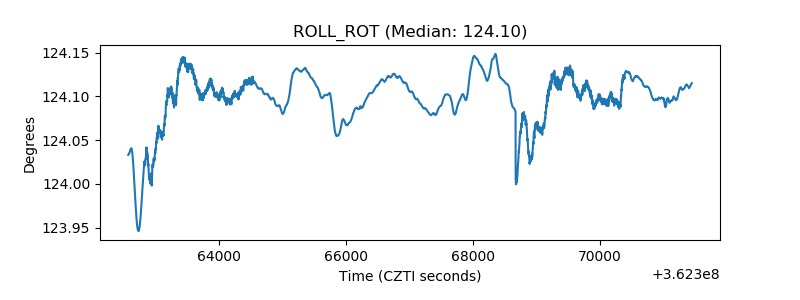 |
| _Roll_DEC | 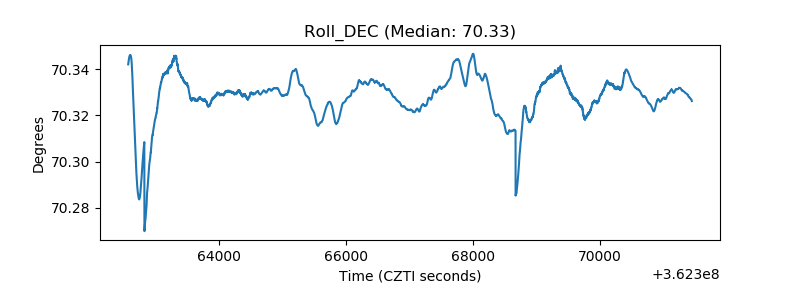 |
| _Roll_RA | 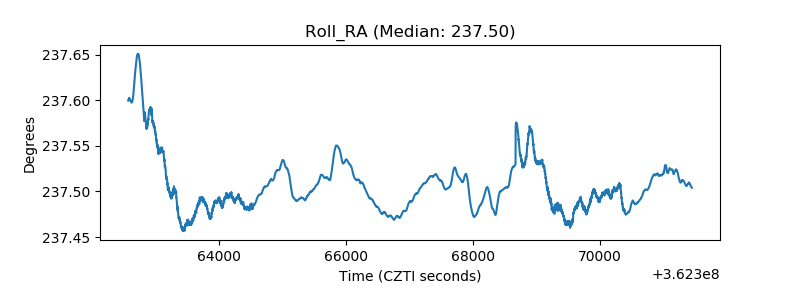 |
| Veto Counter | 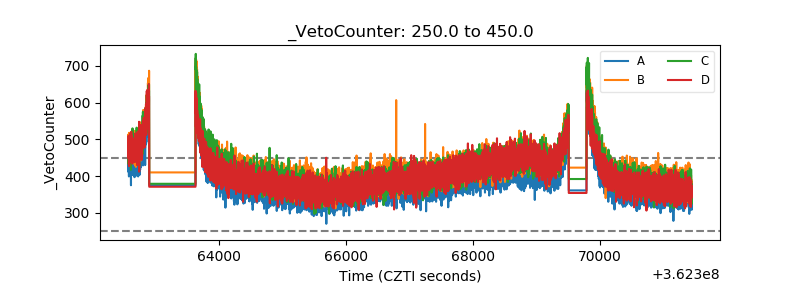 |