| Param | Original file | Final file |
|---|---|---|
| Filename | modeM0/AS1C06_002T01_9000004490_31054cztM0_level2.evt | modeM0/AS1C06_002T01_9000004490_31054cztM0_level2_quad_clean.evt |
| Size (bytes) | 878,834,880 | 121,178,880 |
| Size | 838.1 MB | 115.6 MB |
| Events in quadrant A | 3,704,763 | 854,620 |
| Events in quadrant B | 6,307,148 | 844,023 |
| Events in quadrant C | 4,041,988 | 831,857 |
| Events in quadrant D | 12,018,365 | 578,910 |
| Mode M0 | |||
|---|---|---|---|
| Quadrant | BADHDUFLAG | Total packets | Discarded packets |
| A | 0 | 16601 | 3 |
| B | 0 | 24747 | 3 |
| C | 0 | 17372 | 3 |
| D | 0 | 41328 | 4 |
| Mode M9 | |||
|---|---|---|---|
| Quadrant | BADHDUFLAG | Total packets | Discarded packets |
| A | 0 | 3 | 0 |
| B | 0 | 3 | 0 |
| C | 0 | 3 | 0 |
| D | 0 | 3 | 0 |
| Mode SS | |||
|---|---|---|---|
| Quadrant | BADHDUFLAG | Total packets | Discarded packets |
| A | 0 | 162 | 0 |
| B | 0 | 162 | 0 |
| C | 0 | 162 | 0 |
| D | 0 | 162 | 0 |
| Quadrant | Total seconds | Saturated seconds | Saturation percentage |
|---|---|---|---|
| A | 8045 | 185 | 2.299565% |
| B | 8046 | 419 | 5.207557% |
| C | 8046 | 246 | 3.057420% |
| D | 8045 | 3283 | 40.807955% |
Noise dominated data is calculated using 1-second bins in cleaned event files. If a bin has >2000 counts, and if more than 50% of those come from <1% of pixels, then it is considered to be noise-dominated and hence unusable.
| Quadrant | # 1 sec bins | Bins with >0 counts | Bins with >2000 counts | High rate bins dominated by noise | Noise dominated (total time) | Noise dominated (detector-on time) | Marked lightcurve |
|---|---|---|---|---|---|---|---|
| A | 8385 | 8048 | 0 | 0 | 0.00% | 0.00% | 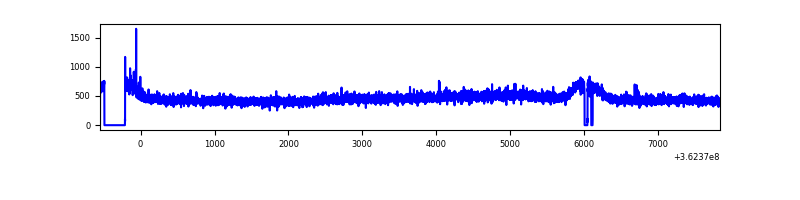 |
| B | 8386 | 8049 | 5 | 5 | 0.06% | 0.06% | 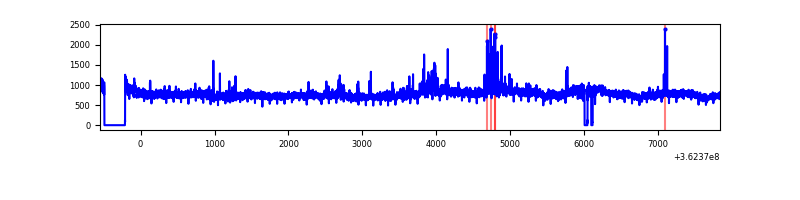 |
| C | 8386 | 8049 | 1 | 1 | 0.01% | 0.01% | 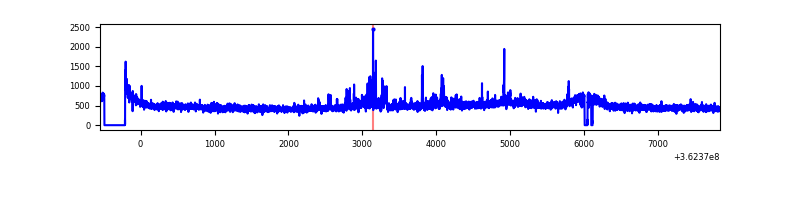 |
| D | 8385 | 8048 | 2899 | 2899 | 34.57% | 36.02% | 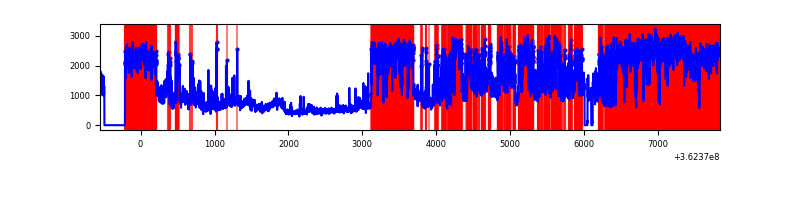 |
Top three noisy pixels from each quadrant. If the there are fewer than three noisy pixels in the level2.evt file, extra rows are filled as -1
| Pixel properties | Quadrant properties | ||||||
|---|---|---|---|---|---|---|---|
| Quadrant | DetID | PixID | Counts | Sigma | Mean | Median | Sigma |
| A | 13 | 254 | 14286 | 69.54 | 958 | 937 | 192.0 |
| A | 3 | 137 | 9697 | 45.63 | 958 | 937 | 192.0 |
| A | 0 | 226 | 8121 | 37.42 | 958 | 937 | 192.0 |
| B | 6 | 159 | 2309449 | 12781.42 | 948 | 921 | 180.6 |
| B | 5 | 172 | 80263 | 439.29 | 948 | 921 | 180.6 |
| B | 0 | 190 | 57260 | 311.93 | 948 | 921 | 180.6 |
| C | 3 | 233 | 202256 | 931.59 | 925 | 927 | 216.1 |
| C | 14 | 238 | 148422 | 682.49 | 925 | 927 | 216.1 |
| C | 1 | 16 | 43487 | 196.93 | 925 | 927 | 216.1 |
| D | 13 | 174 | 7878747 | 46653.0 | 711 | 690 | 168.9 |
| D | 8 | 195 | 1122778 | 6644.88 | 711 | 690 | 168.9 |
| D | 13 | 249 | 117063 | 689.15 | 711 | 690 | 168.9 |
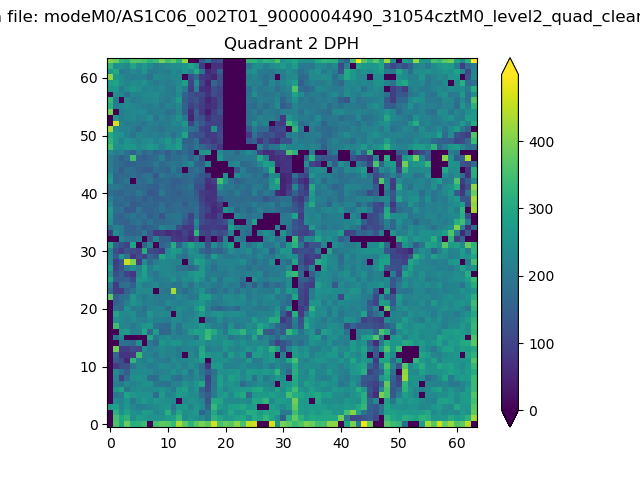
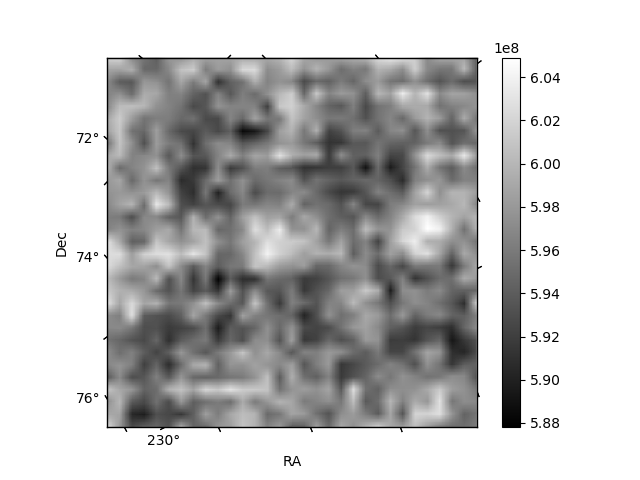
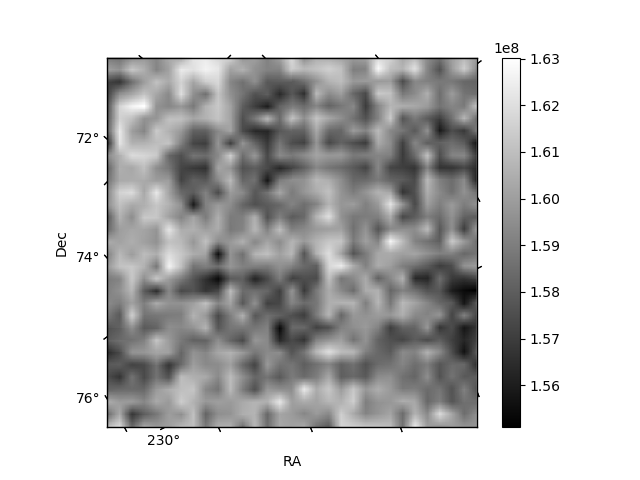
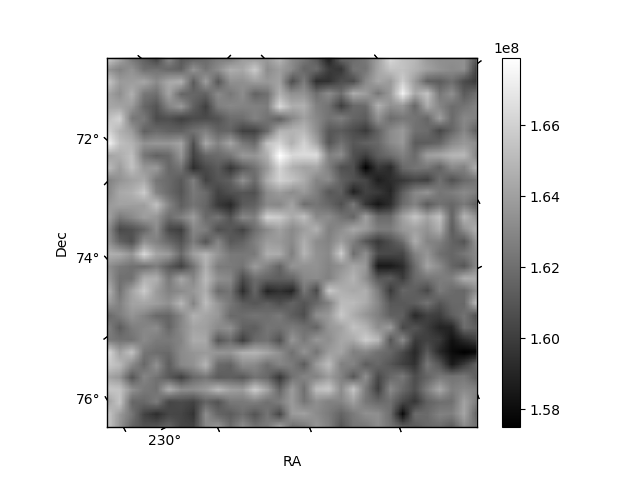
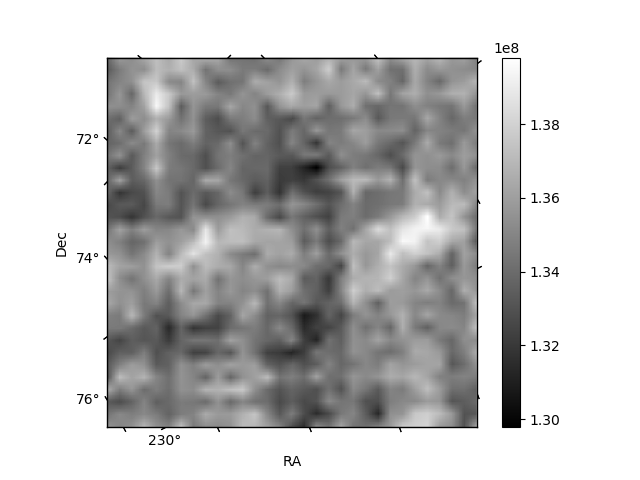
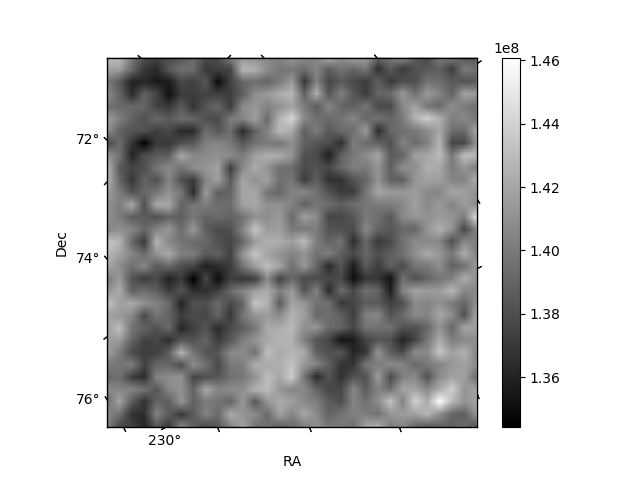
Histogram calculated using DETX and DETY for each event in the final _common_clean file
| Quadrant A | 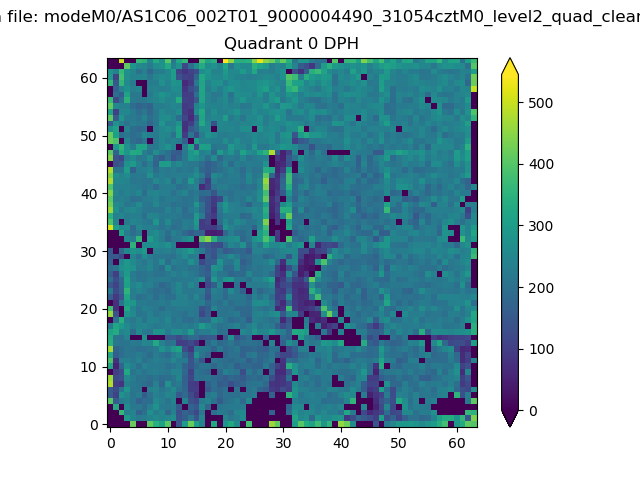 |
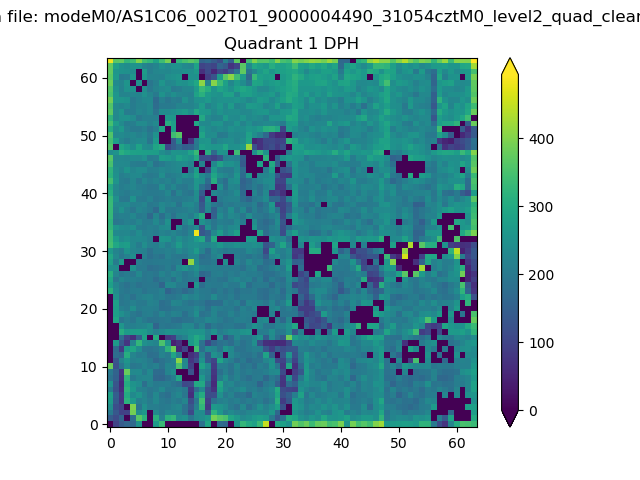 |
Quadrant B |
|---|---|---|---|
| Quadrant D | 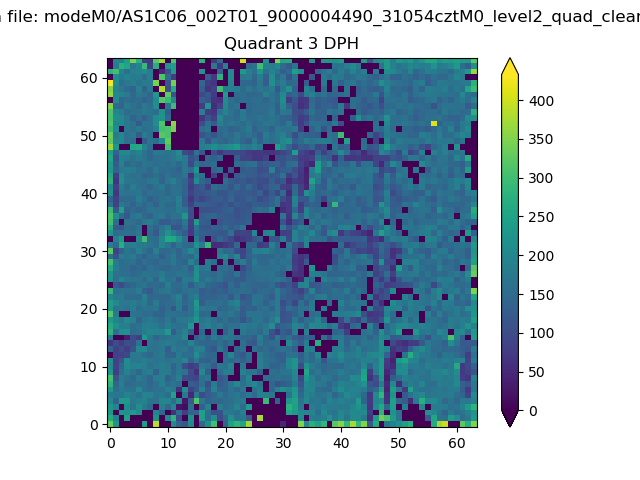 |
 |
Quadrant C |
| Plot type | Count rate plots | Images |
|---|---|---|
| Comparison with Poisson distribution Blue bars denote a histogram of data divided into 1 sec bins. Red curve is a Poisson curve with rate = median count rate of data. |
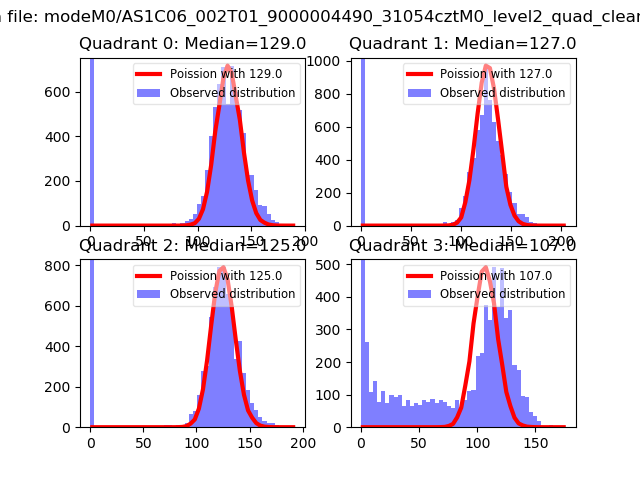 |
 |
| Quadrant-wise count rates Data is divided into 100 sec bins |
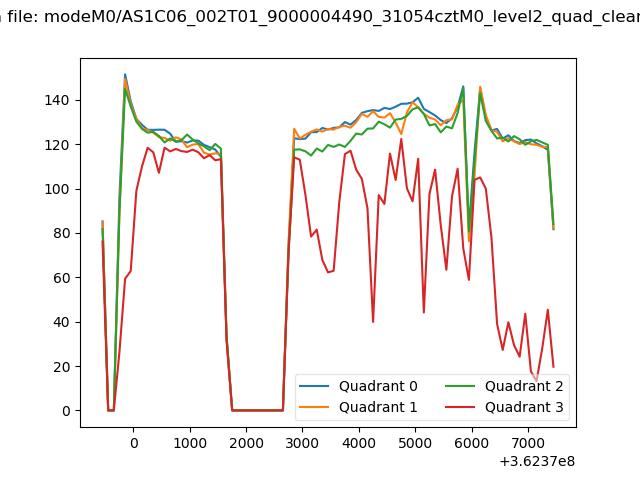 |
|
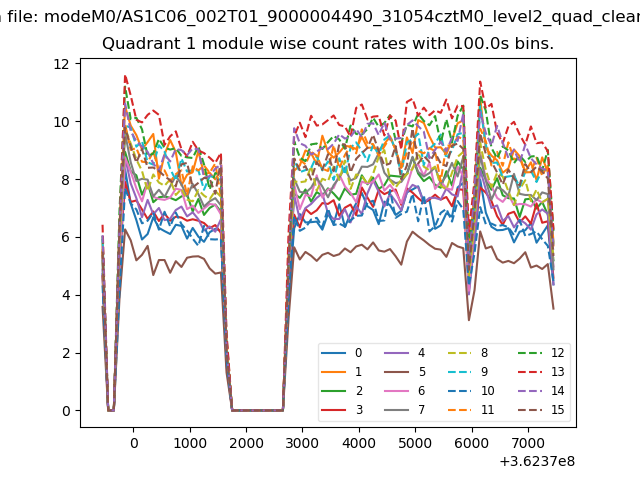
| Module-wise count rates for Quadrant A Data is divided into 100 sec bins |
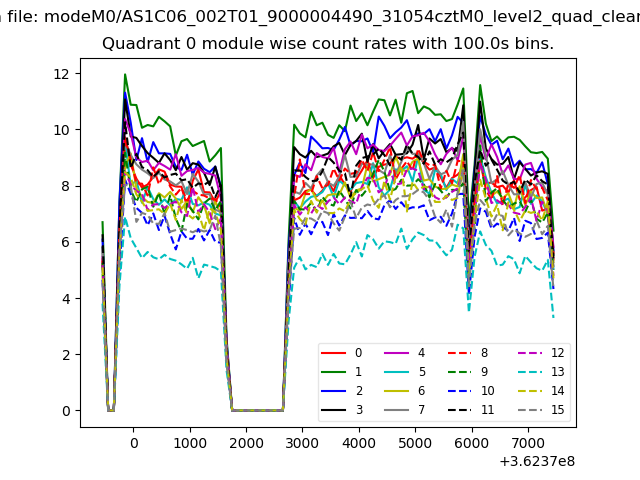 |
 |
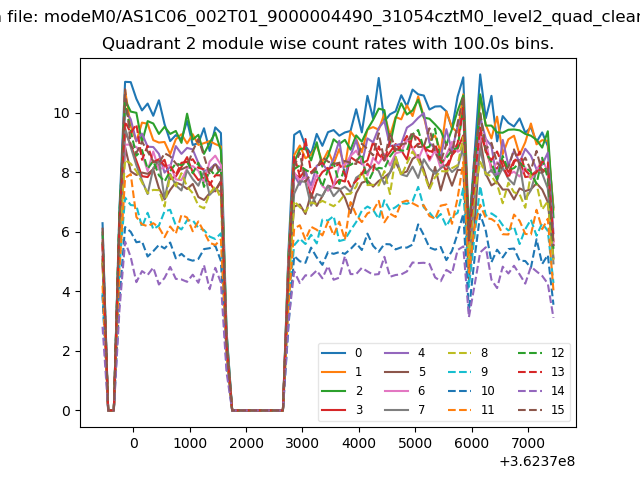
| Module-wise count rates for Quadrant B Data is divided into 100 sec bins |
 |
 |
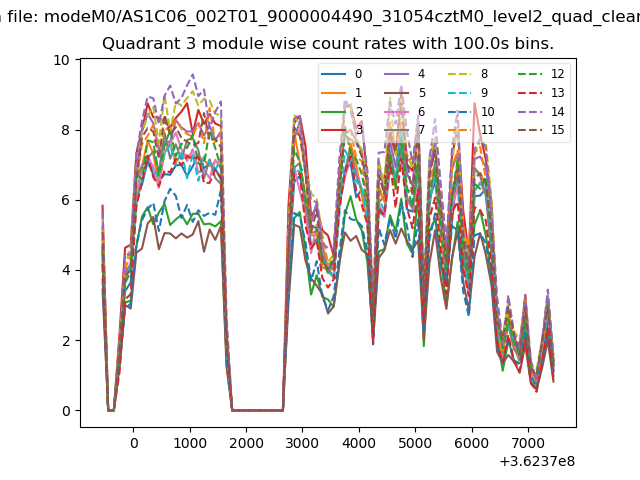
| Module-wise count rates for Quadrant C Data is divided into 100 sec bins |
 |
 |
| Module-wise count rates for Quadrant D Data is divided into 100 sec bins |
 |
 |
| Parameter | Plot |
|---|---|
| CZT HV Monitor | 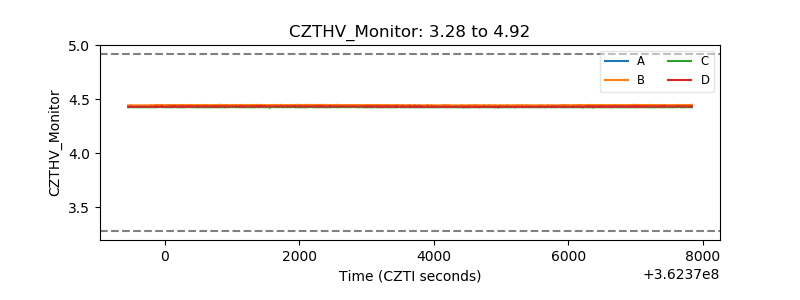 |
| D_VDD | 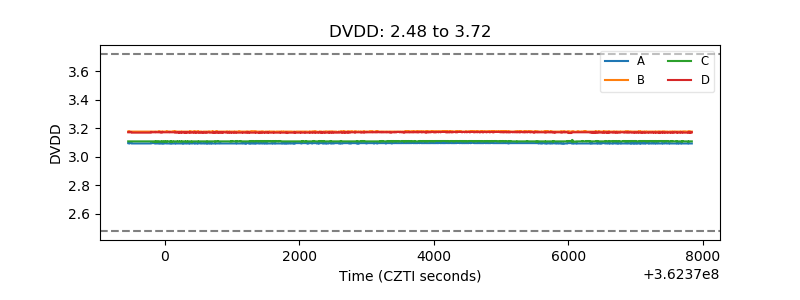 |
| Temperature 1 | 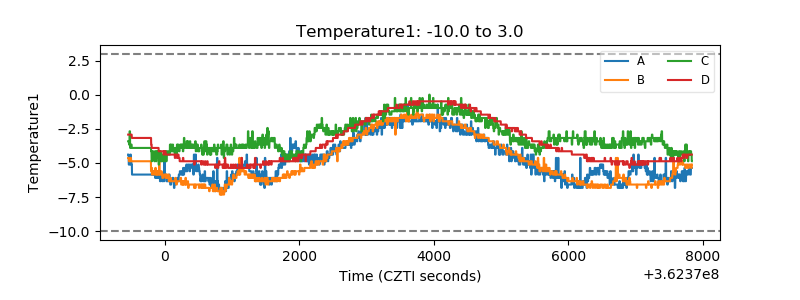 |
| Veto HV Monitor | 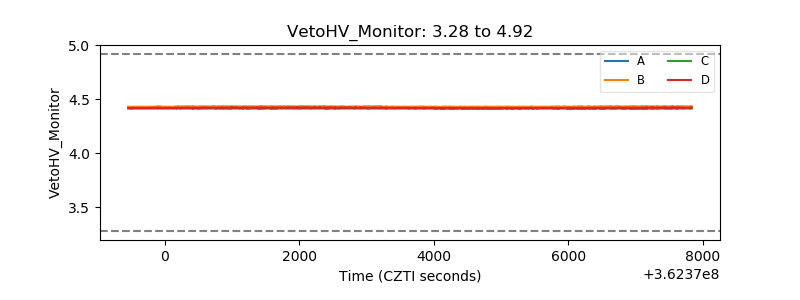 |
| Veto LLD | 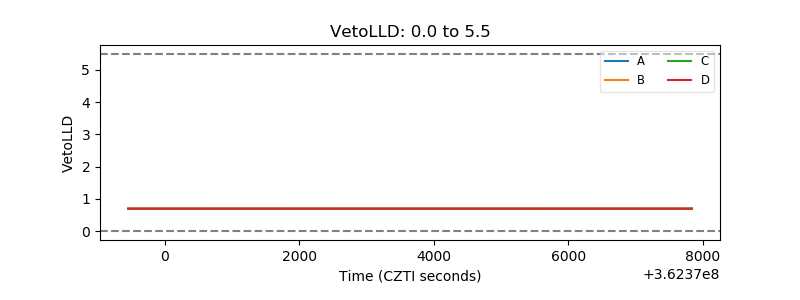 |
| Alpha Counter | 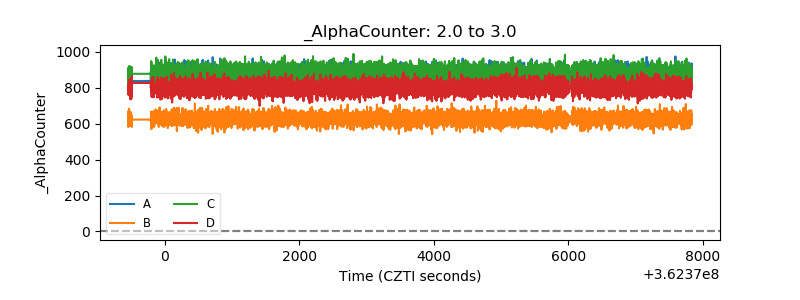 |
| _CPM_Rate | 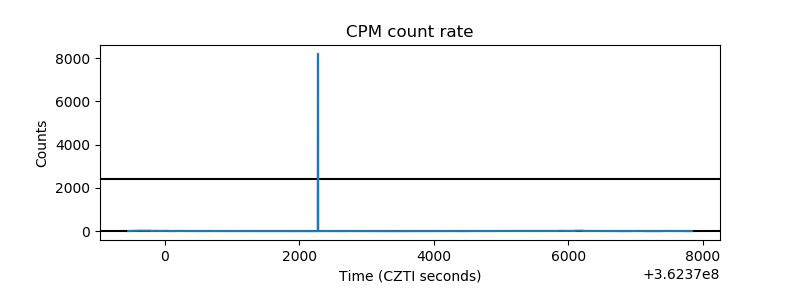 |
| CZT Counter | 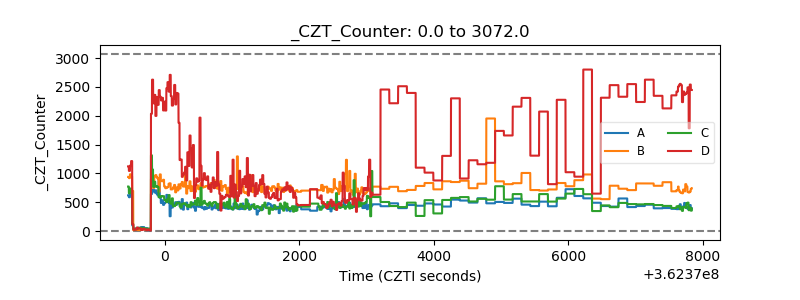 |
| +2.5 Volts monitor | 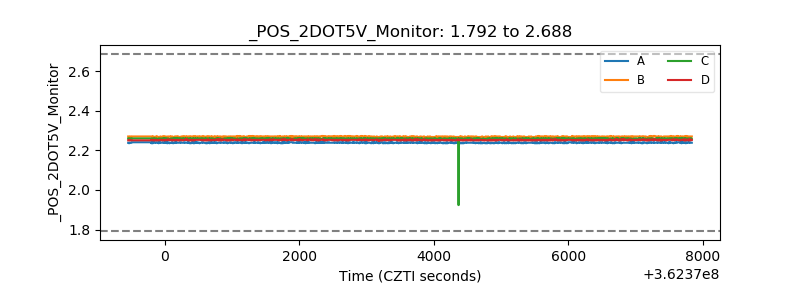 |
| +5 Volts monitor | 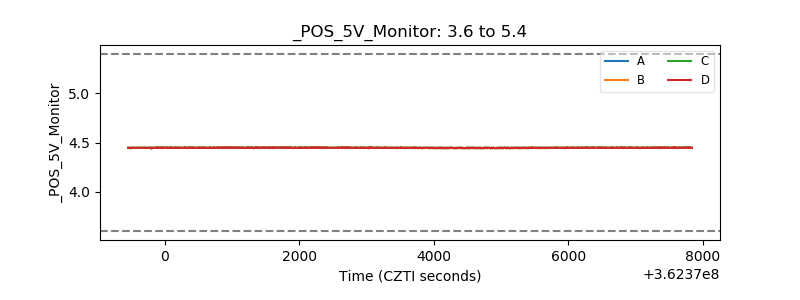 |
| _ROLL_ROT | 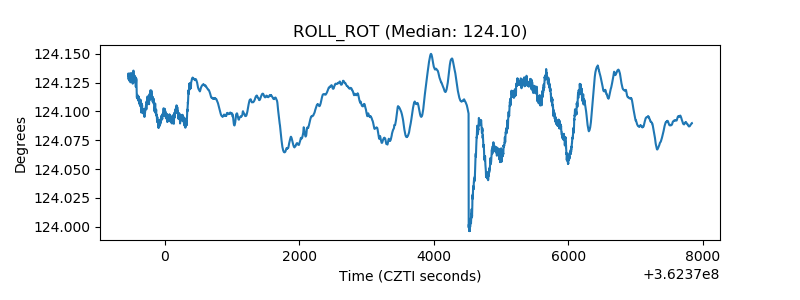 |
| _Roll_DEC | 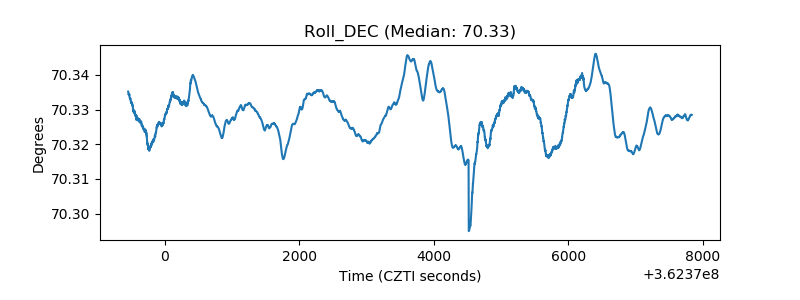 |
| _Roll_RA | 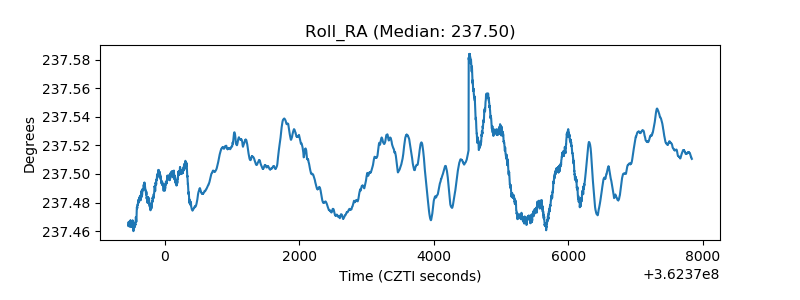 |
| Veto Counter | 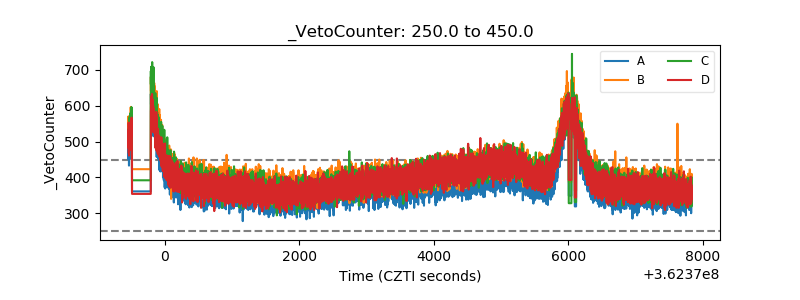 |