| Param | Original file | Final file |
|---|---|---|
| Filename | modeM0/AS1C06_002T01_9000004490_31057cztM0_level2.evt | modeM0/AS1C06_002T01_9000004490_31057cztM0_level2_quad_clean.evt |
| Size (bytes) | 1,528,211,520 | 162,187,200 |
| Size | 1.4 GB | 154.7 MB |
| Events in quadrant A | 5,841,856 | 1,194,946 |
| Events in quadrant B | 9,795,164 | 1,181,077 |
| Events in quadrant C | 6,112,146 | 1,145,674 |
| Events in quadrant D | 23,671,657 | 503,730 |
| Mode M0 | |||
|---|---|---|---|
| Quadrant | BADHDUFLAG | Total packets | Discarded packets |
| A | 0 | 25756 | 2 |
| B | 0 | 38820 | 2 |
| C | 0 | 26104 | 2 |
| D | 0 | 79174 | 2 |
| Mode M9 | |||
|---|---|---|---|
| Quadrant | BADHDUFLAG | Total packets | Discarded packets |
| A | 0 | 12 | 0 |
| B | 0 | 12 | 0 |
| C | 0 | 12 | 0 |
| D | 0 | 12 | 0 |
| Mode SS | |||
|---|---|---|---|
| Quadrant | BADHDUFLAG | Total packets | Discarded packets |
| A | 0 | 260 | 0 |
| B | 0 | 260 | 0 |
| C | 0 | 260 | 0 |
| D | 0 | 260 | 0 |
| Quadrant | Total seconds | Saturated seconds | Saturation percentage |
|---|---|---|---|
| A | 12777 | 92 | 0.720044% |
| B | 12778 | 201 | 1.573016% |
| C | 12778 | 153 | 1.197370% |
| D | 12778 | 8237 | 64.462357% |
Noise dominated data is calculated using 1-second bins in cleaned event files. If a bin has >2000 counts, and if more than 50% of those come from <1% of pixels, then it is considered to be noise-dominated and hence unusable.
| Quadrant | # 1 sec bins | Bins with >0 counts | Bins with >2000 counts | High rate bins dominated by noise | Noise dominated (total time) | Noise dominated (detector-on time) | Marked lightcurve |
|---|---|---|---|---|---|---|---|
| A | 14042 | 12779 | 0 | 0 | 0.00% | 0.00% | 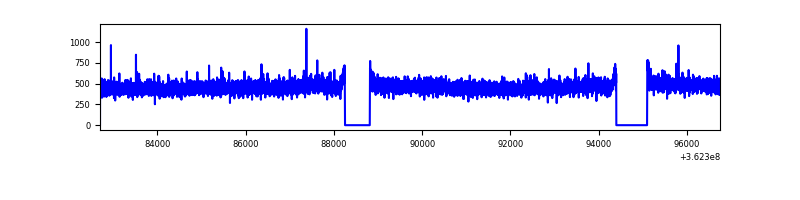 |
| B | 14043 | 12780 | 8 | 8 | 0.06% | 0.06% | 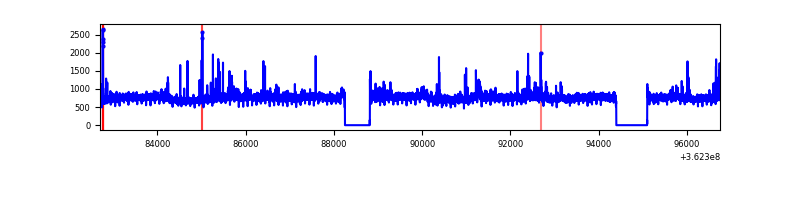 |
| C | 14043 | 12780 | 8 | 8 | 0.06% | 0.06% | 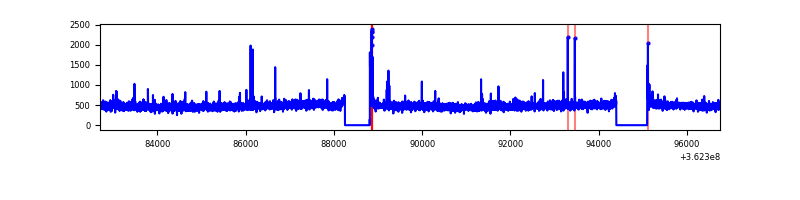 |
| D | 14043 | 12780 | 6760 | 6760 | 48.14% | 52.90% | 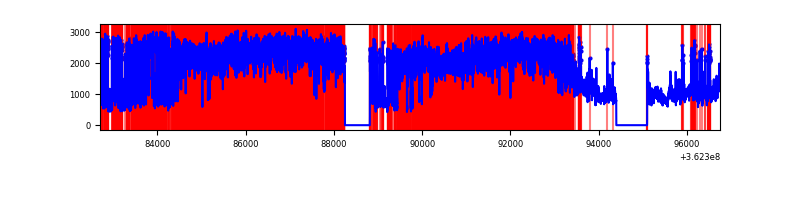 |
Top three noisy pixels from each quadrant. If the there are fewer than three noisy pixels in the level2.evt file, extra rows are filled as -1
| Pixel properties | Quadrant properties | ||||||
|---|---|---|---|---|---|---|---|
| Quadrant | DetID | PixID | Counts | Sigma | Mean | Median | Sigma |
| A | 13 | 254 | 22955 | 70.93 | 1512 | 1478 | 302.8 |
| A | 3 | 137 | 15551 | 46.48 | 1512 | 1478 | 302.8 |
| A | 0 | 226 | 12841 | 37.53 | 1512 | 1478 | 302.8 |
| B | 6 | 159 | 3505265 | 12296.92 | 1493 | 1455 | 284.9 |
| B | 0 | 190 | 119770 | 415.24 | 1493 | 1455 | 284.9 |
| B | 5 | 172 | 72839 | 250.53 | 1493 | 1455 | 284.9 |
| C | 14 | 238 | 232489 | 691.28 | 1440 | 1447 | 334.2 |
| C | 0 | 10 | 71792 | 210.47 | 1440 | 1447 | 334.2 |
| C | 1 | 16 | 68083 | 199.38 | 1440 | 1447 | 334.2 |
| D | 13 | 174 | 18588403 | 95042.11 | 819 | 795 | 195.6 |
| D | 8 | 195 | 1670306 | 8536.54 | 819 | 795 | 195.6 |
| D | 12 | 218 | 169830 | 864.31 | 819 | 795 | 195.6 |
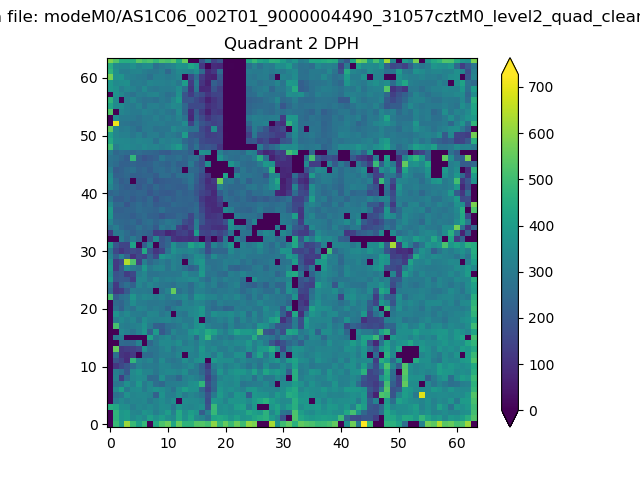
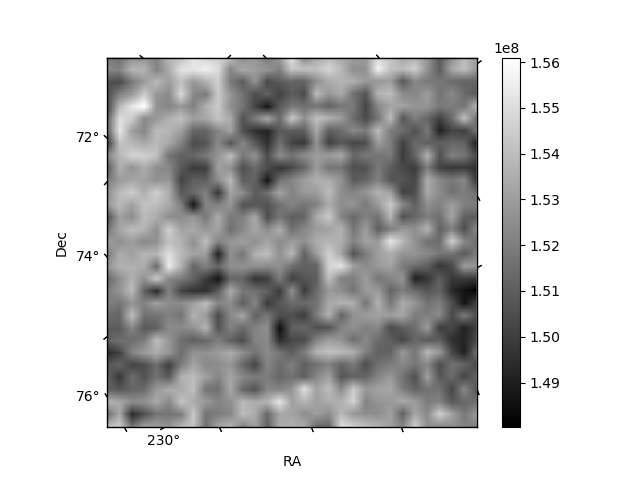
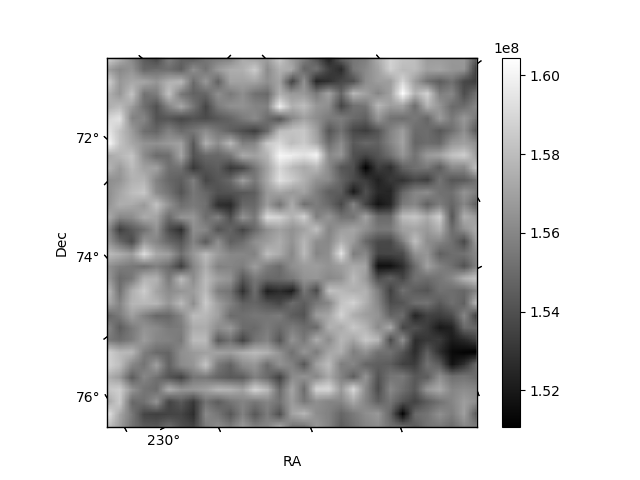
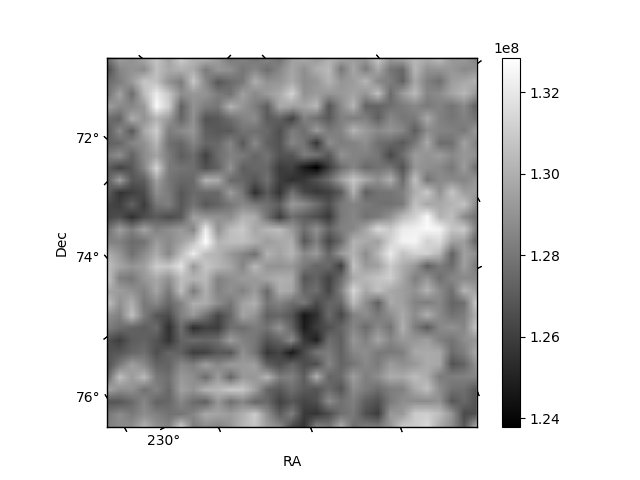
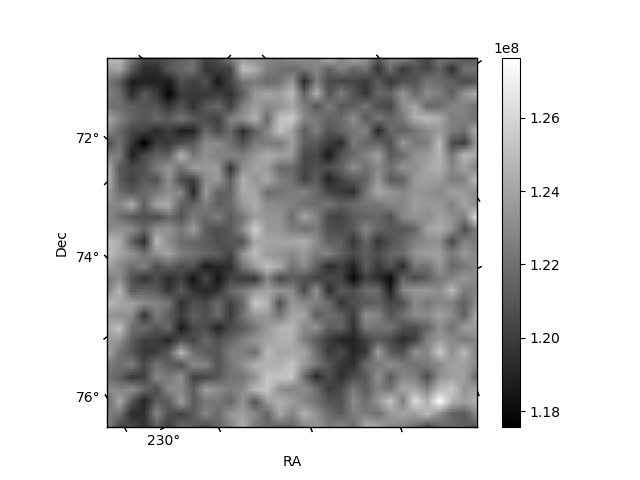
Histogram calculated using DETX and DETY for each event in the final _common_clean file
| Quadrant A | 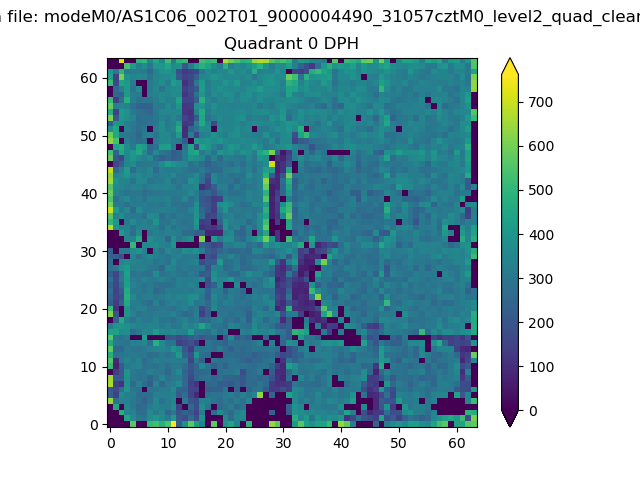 |
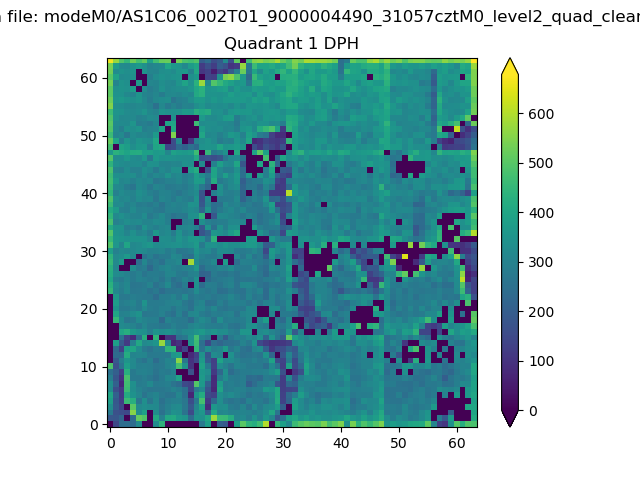 |
Quadrant B |
|---|---|---|---|
| Quadrant D | 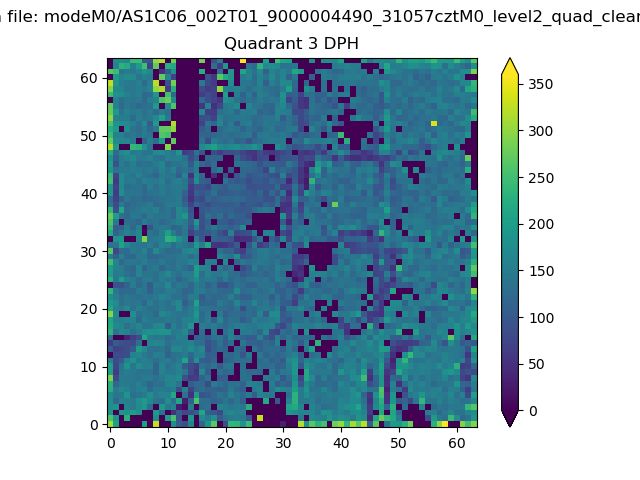 |
 |
Quadrant C |
| Plot type | Count rate plots | Images |
|---|---|---|
| Comparison with Poisson distribution Blue bars denote a histogram of data divided into 1 sec bins. Red curve is a Poisson curve with rate = median count rate of data. |
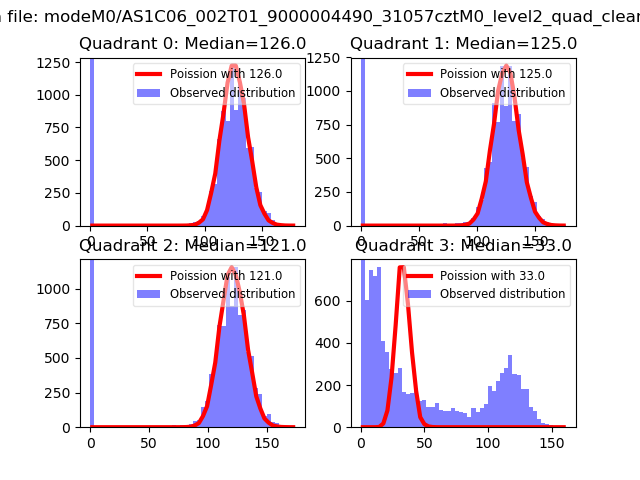 |
 |
| Quadrant-wise count rates Data is divided into 100 sec bins |
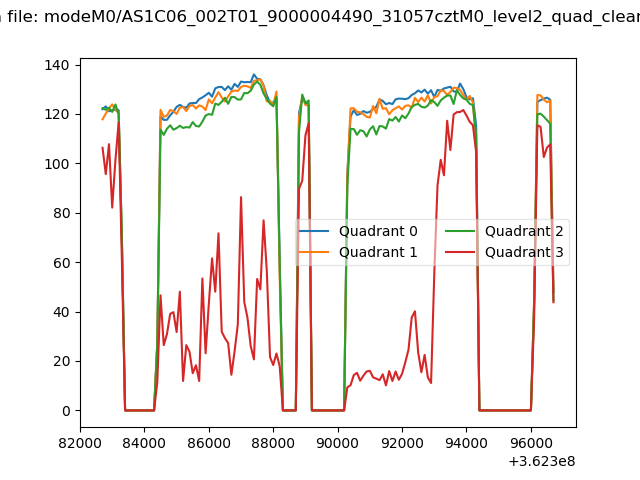 |
|
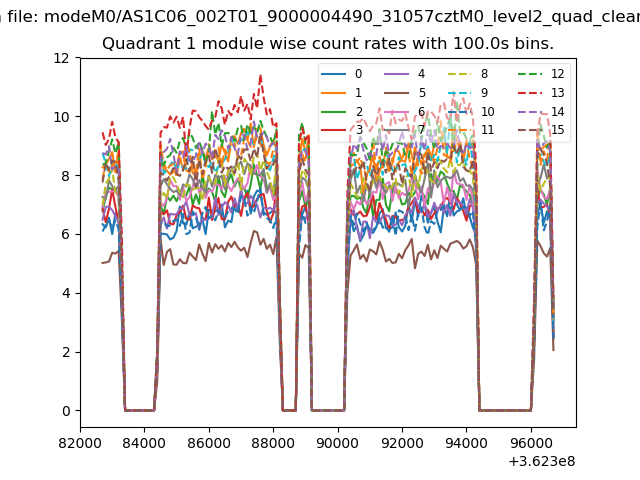
| Module-wise count rates for Quadrant A Data is divided into 100 sec bins |
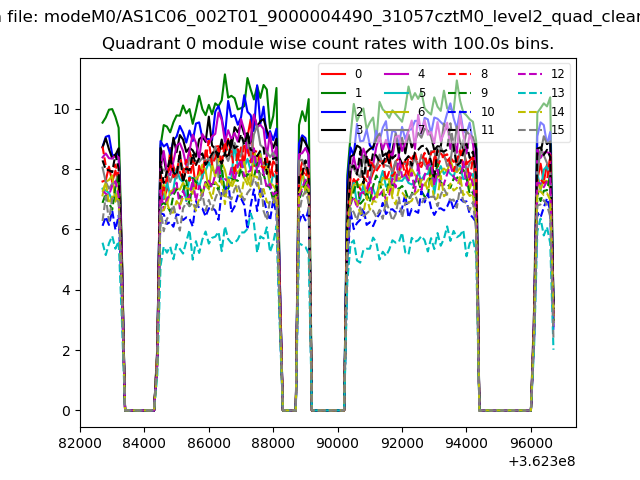 |
 |
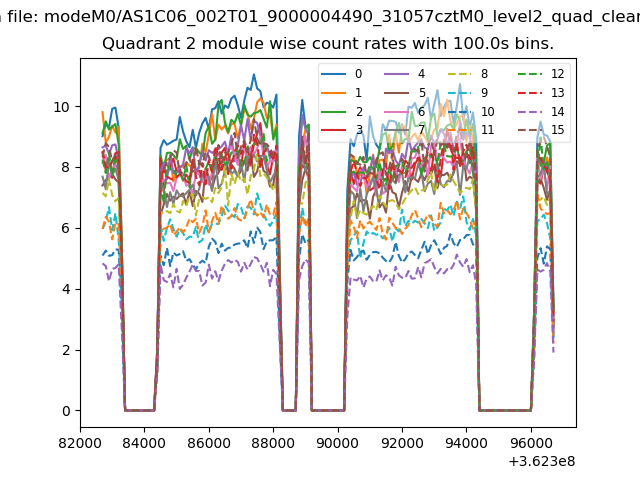
| Module-wise count rates for Quadrant B Data is divided into 100 sec bins |
 |
 |
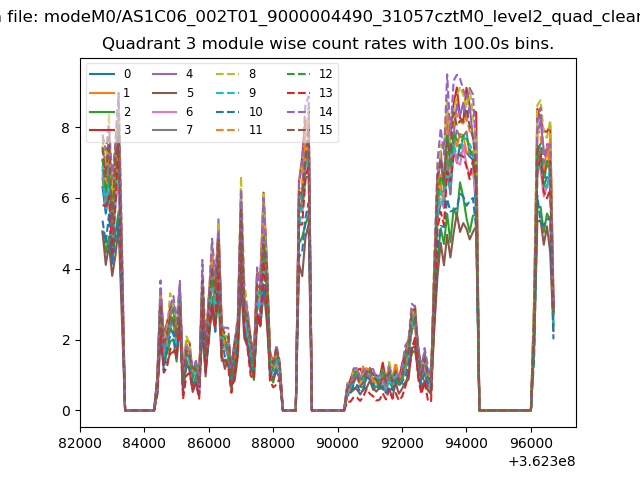
| Module-wise count rates for Quadrant C Data is divided into 100 sec bins |
 |
 |
| Module-wise count rates for Quadrant D Data is divided into 100 sec bins |
 |
 |
| Parameter | Plot |
|---|---|
| CZT HV Monitor | 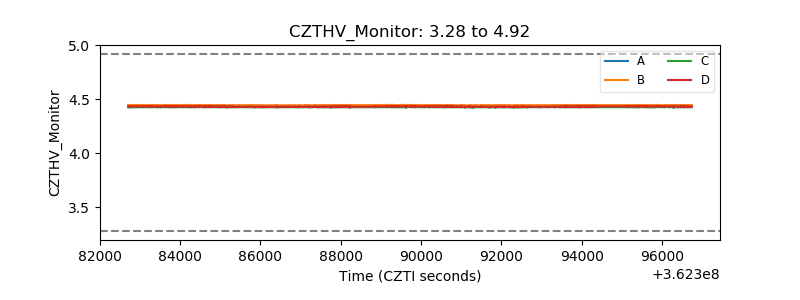 |
| D_VDD | 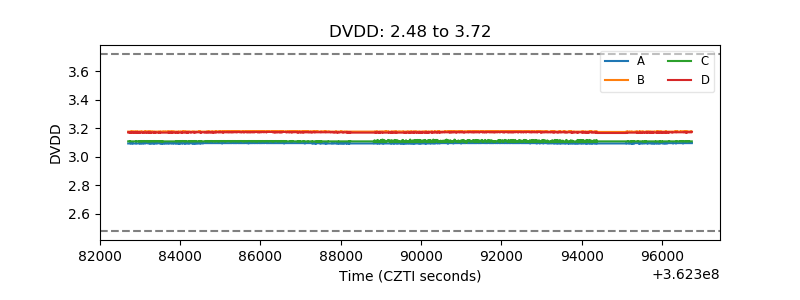 |
| Temperature 1 | 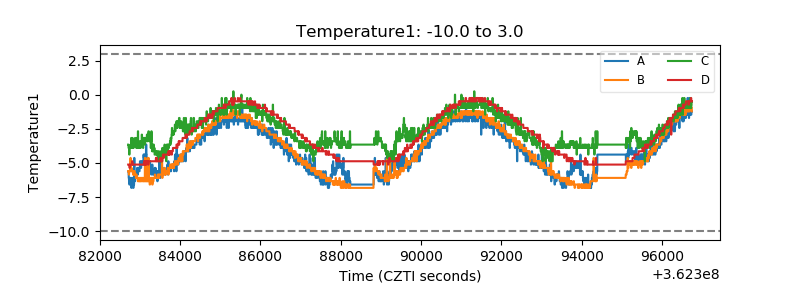 |
| Veto HV Monitor | 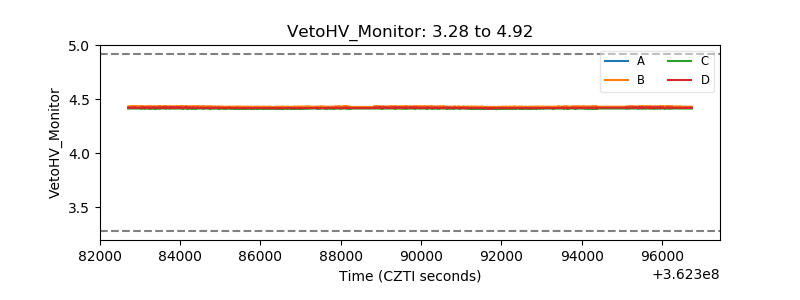 |
| Veto LLD | 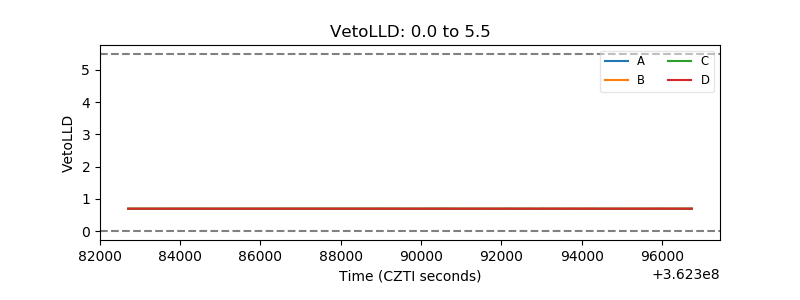 |
| Alpha Counter | 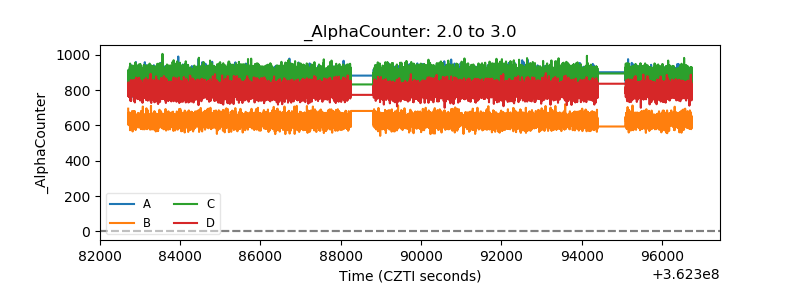 |
| _CPM_Rate | 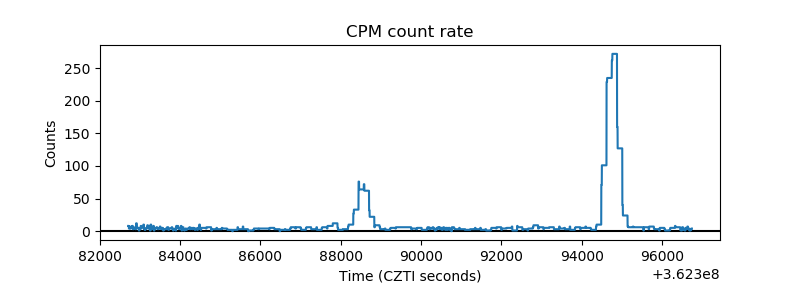 |
| CZT Counter | 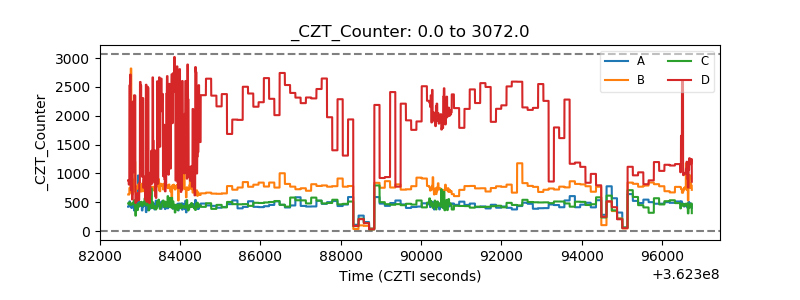 |
| +2.5 Volts monitor |  |
| +5 Volts monitor |  |
| _ROLL_ROT | 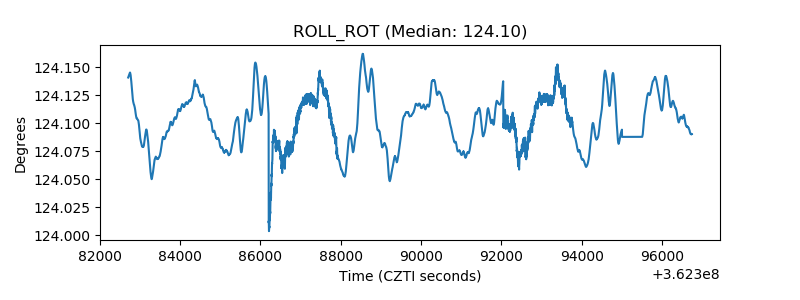 |
| _Roll_DEC | 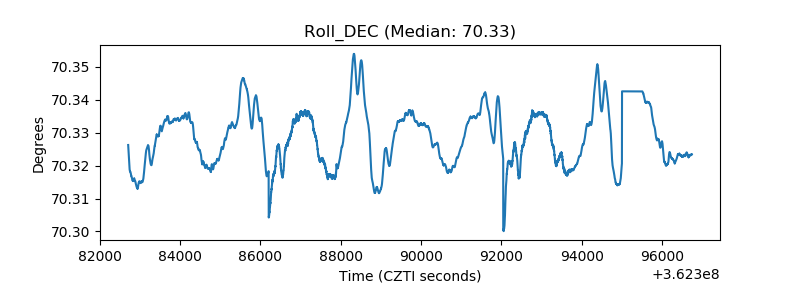 |
| _Roll_RA | 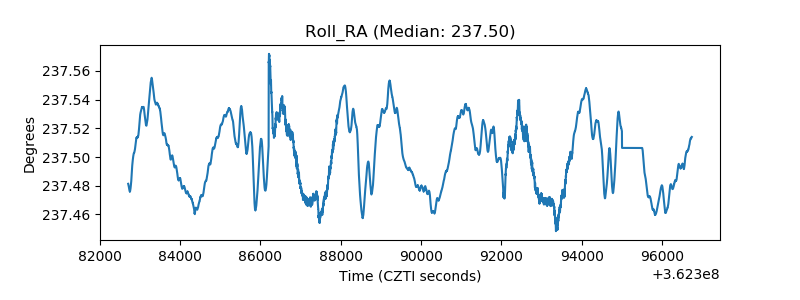 |
| Veto Counter | 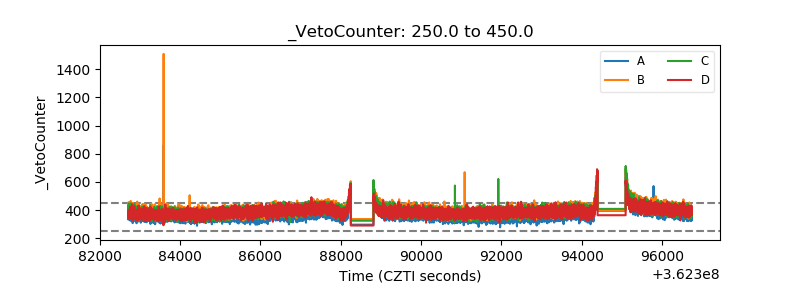 |