| Param | Original file | Final file |
|---|---|---|
| Filename | modeM0/AS1C06_002T01_9000004490_31058cztM0_level2.evt | modeM0/AS1C06_002T01_9000004490_31058cztM0_level2_quad_clean.evt |
| Size (bytes) | 727,119,360 | 99,711,360 |
| Size | 693.4 MB | 95.1 MB |
| Events in quadrant A | 3,173,150 | 676,015 |
| Events in quadrant B | 5,651,494 | 659,103 |
| Events in quadrant C | 3,295,729 | 644,938 |
| Events in quadrant D | 9,444,705 | 568,242 |
| Mode M0 | |||
|---|---|---|---|
| Quadrant | BADHDUFLAG | Total packets | Discarded packets |
| A | 0 | 13751 | 1 |
| B | 0 | 21676 | 1 |
| C | 0 | 13903 | 1 |
| D | 0 | 32794 | 1 |
| Mode M9 | |||
|---|---|---|---|
| Quadrant | BADHDUFLAG | Total packets | Discarded packets |
| A | 0 | 9 | 0 |
| B | 0 | 9 | 0 |
| C | 0 | 9 | 0 |
| D | 0 | 9 | 0 |
| Mode SS | |||
|---|---|---|---|
| Quadrant | BADHDUFLAG | Total packets | Discarded packets |
| A | 0 | 138 | 0 |
| B | 0 | 138 | 0 |
| C | 0 | 138 | 0 |
| D | 0 | 138 | 0 |
| Quadrant | Total seconds | Saturated seconds | Saturation percentage |
|---|---|---|---|
| A | 6750 | 54 | 0.800000% |
| B | 6750 | 264 | 3.911111% |
| C | 6751 | 109 | 1.614576% |
| D | 6751 | 1668 | 24.707451% |
Noise dominated data is calculated using 1-second bins in cleaned event files. If a bin has >2000 counts, and if more than 50% of those come from <1% of pixels, then it is considered to be noise-dominated and hence unusable.
| Quadrant | # 1 sec bins | Bins with >0 counts | Bins with >2000 counts | High rate bins dominated by noise | Noise dominated (total time) | Noise dominated (detector-on time) | Marked lightcurve |
|---|---|---|---|---|---|---|---|
| A | 7625 | 6751 | 0 | 0 | 0.00% | 0.00% | 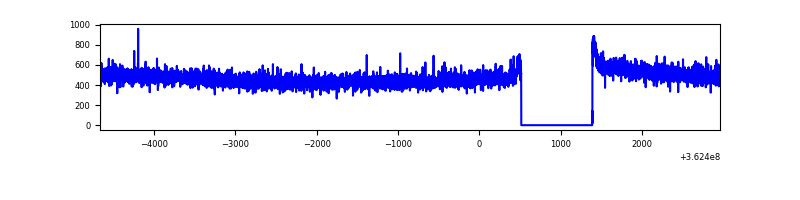 |
| B | 7625 | 6751 | 84 | 84 | 1.10% | 1.24% | 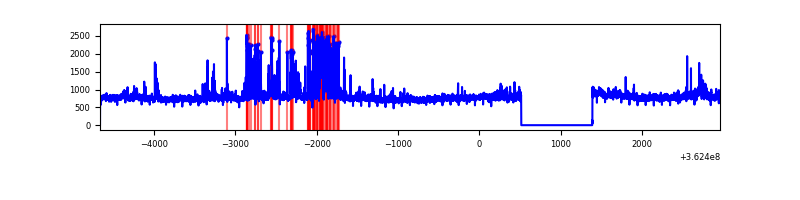 |
| C | 7626 | 6752 | 1 | 1 | 0.01% | 0.01% | 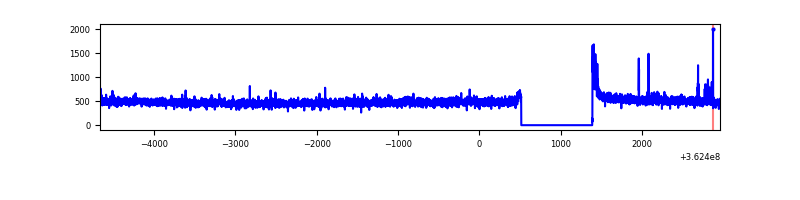 |
| D | 7626 | 6752 | 1536 | 1536 | 20.14% | 22.75% | 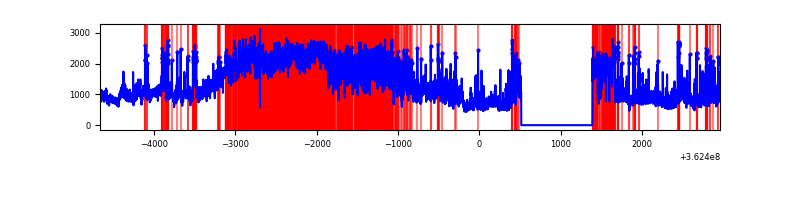 |
Top three noisy pixels from each quadrant. If the there are fewer than three noisy pixels in the level2.evt file, extra rows are filled as -1
| Pixel properties | Quadrant properties | ||||||
|---|---|---|---|---|---|---|---|
| Quadrant | DetID | PixID | Counts | Sigma | Mean | Median | Sigma |
| A | 13 | 254 | 12744 | 71.87 | 821 | 804 | 166.1 |
| A | 3 | 137 | 8178 | 44.38 | 821 | 804 | 166.1 |
| A | 0 | 226 | 7015 | 37.38 | 821 | 804 | 166.1 |
| B | 6 | 159 | 1854555 | 12077.23 | 800 | 779 | 153.5 |
| B | 5 | 172 | 381770 | 2482.13 | 800 | 779 | 153.5 |
| B | 0 | 190 | 106676 | 689.91 | 800 | 779 | 153.5 |
| C | 14 | 238 | 124072 | 682.67 | 777 | 783 | 180.6 |
| C | 1 | 16 | 45535 | 247.8 | 777 | 783 | 180.6 |
| C | 0 | 10 | 37345 | 202.45 | 777 | 783 | 180.6 |
| D | 13 | 174 | 4747925 | 27080.34 | 730 | 709 | 175.3 |
| D | 8 | 195 | 1463646 | 8345.28 | 730 | 709 | 175.3 |
| D | 12 | 218 | 315911 | 1798.06 | 730 | 709 | 175.3 |
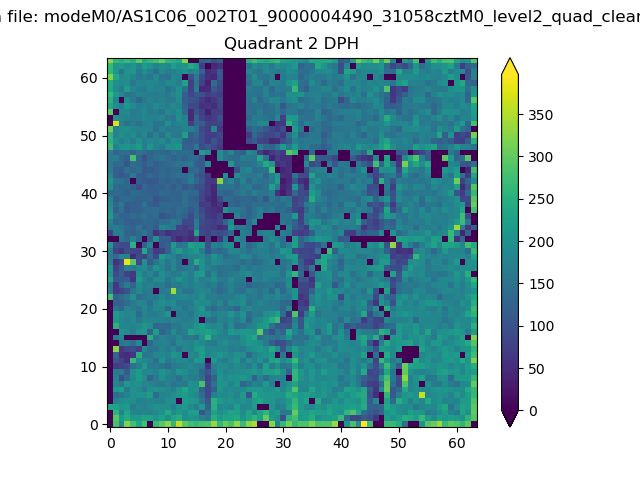
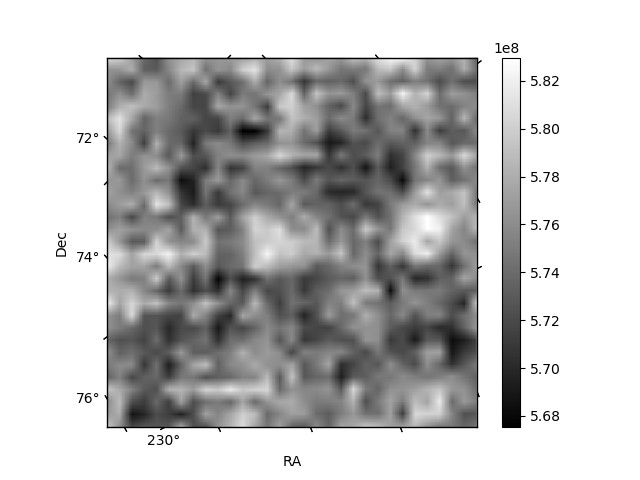
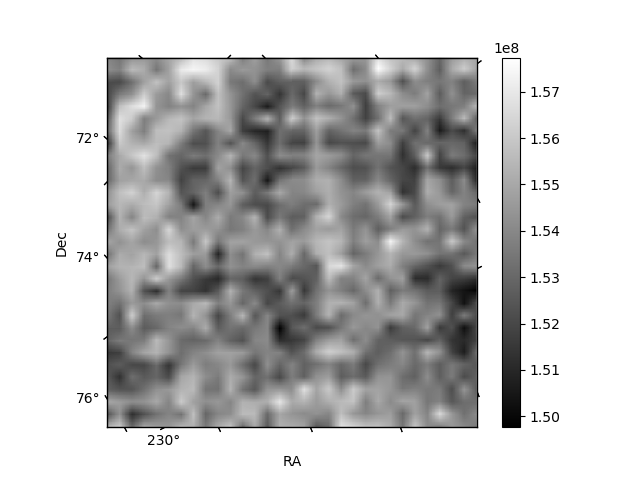
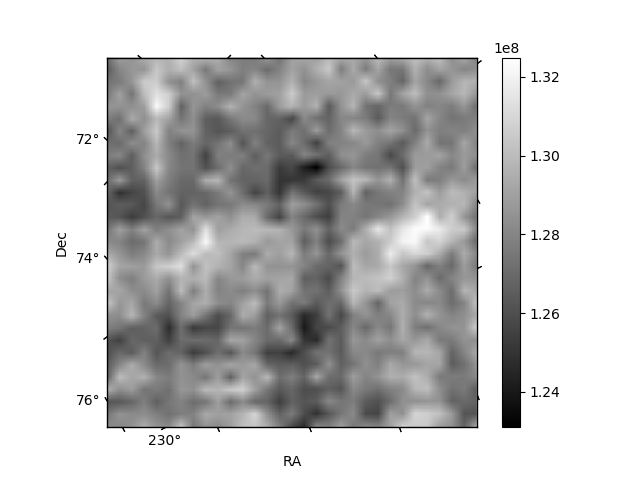
Histogram calculated using DETX and DETY for each event in the final _common_clean file
| Quadrant A | 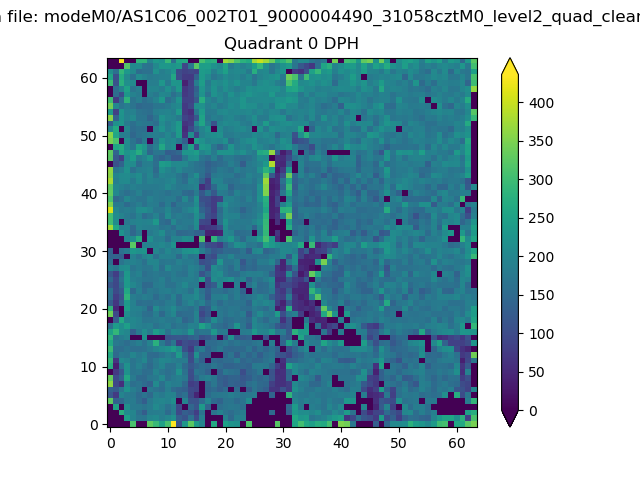 |
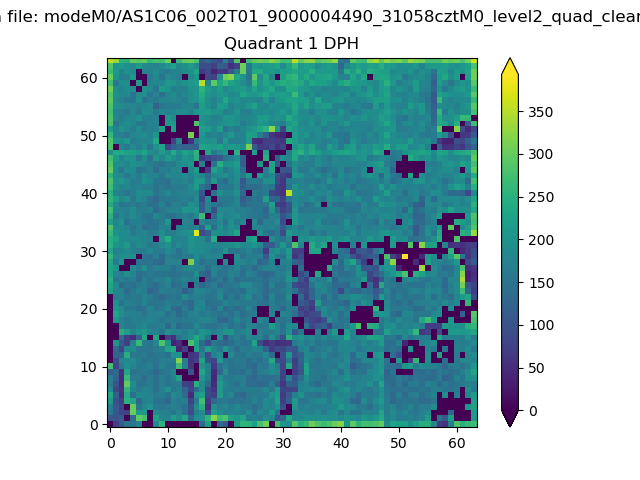 |
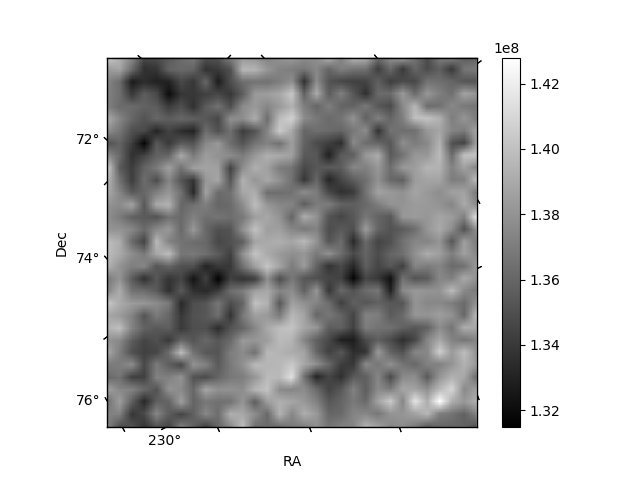
Quadrant B |
|---|---|---|---|
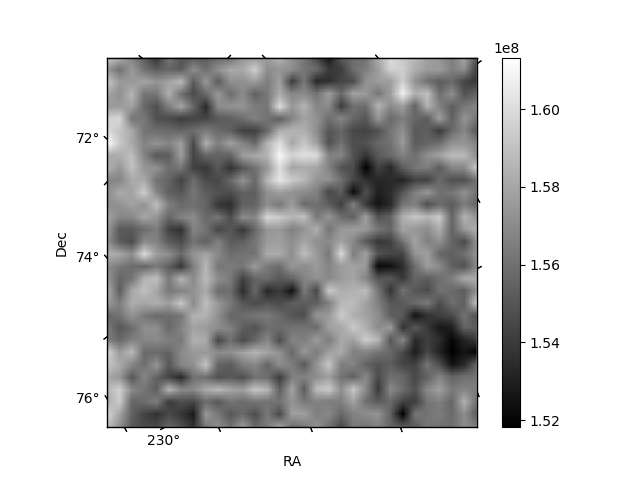
| Quadrant D | 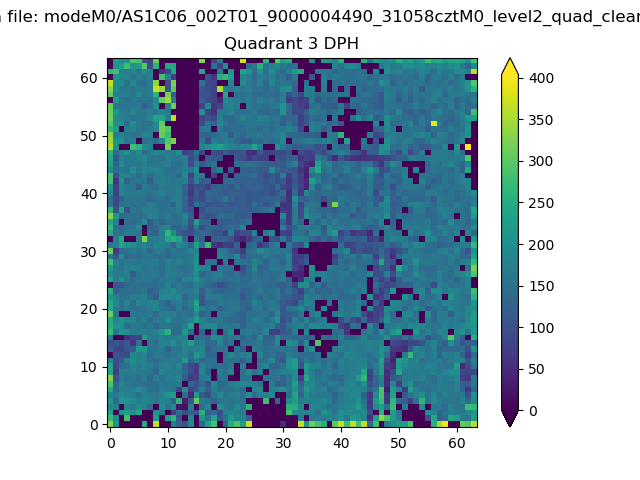 |
 |
Quadrant C |
| Plot type | Count rate plots | Images |
|---|---|---|
| Comparison with Poisson distribution Blue bars denote a histogram of data divided into 1 sec bins. Red curve is a Poisson curve with rate = median count rate of data. |
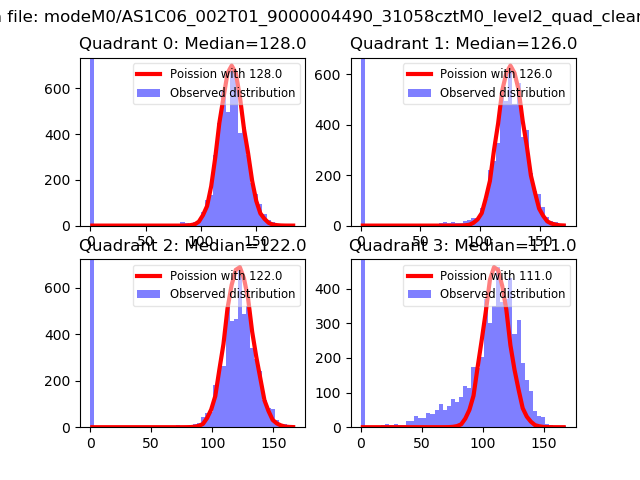 |
 |
| Quadrant-wise count rates Data is divided into 100 sec bins |
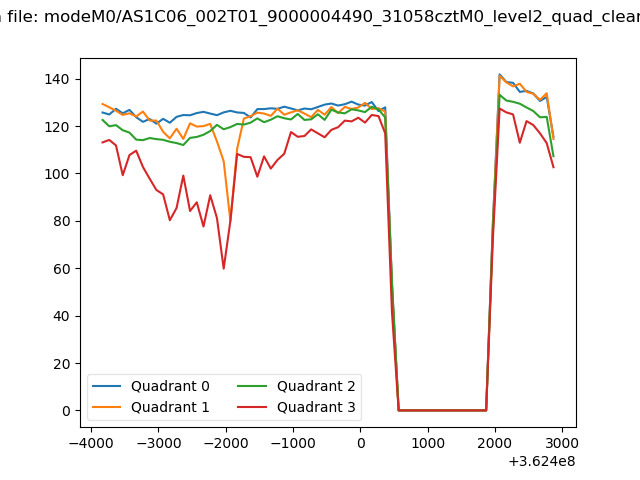 |
|
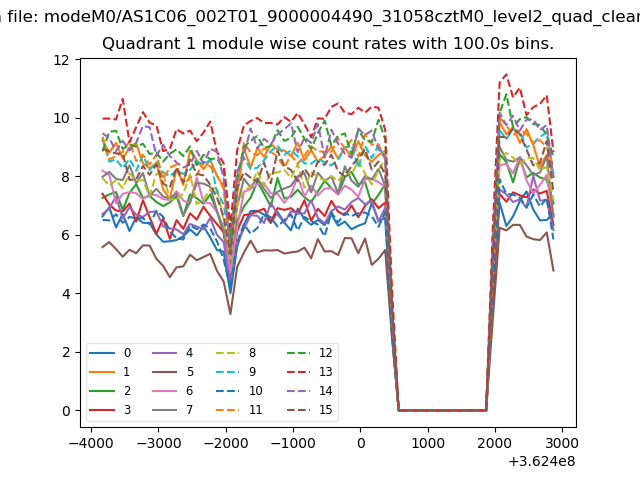
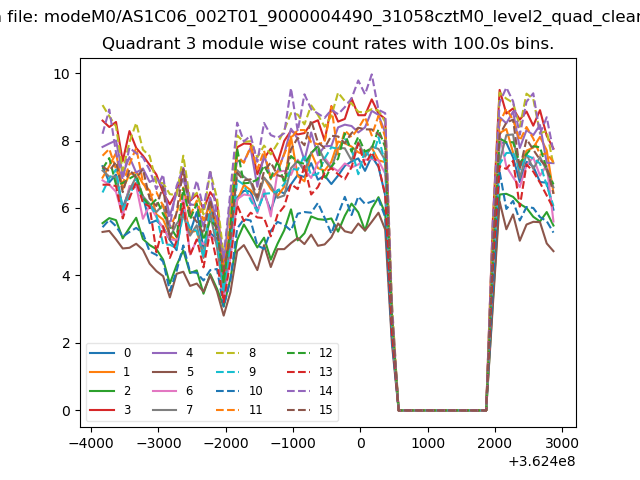
| Module-wise count rates for Quadrant A Data is divided into 100 sec bins |
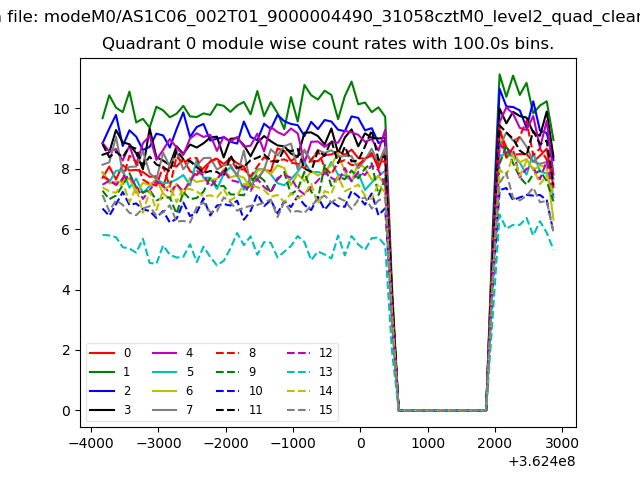 |
 |
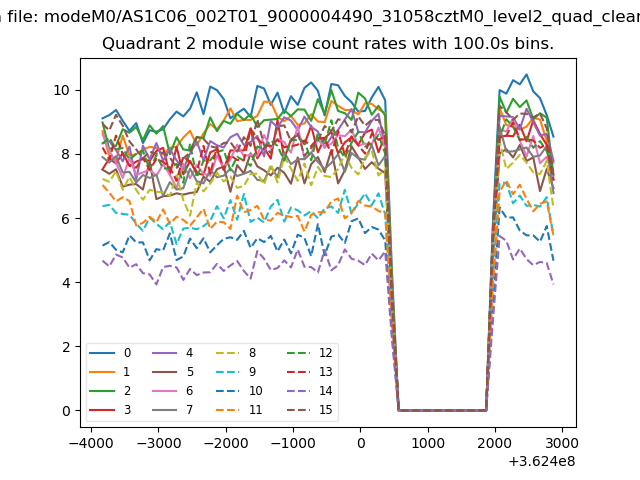
| Module-wise count rates for Quadrant B Data is divided into 100 sec bins |
 |
 |
| Module-wise count rates for Quadrant C Data is divided into 100 sec bins |
 |
 |
| Module-wise count rates for Quadrant D Data is divided into 100 sec bins |
 |
 |
| Parameter | Plot |
|---|---|
| CZT HV Monitor | 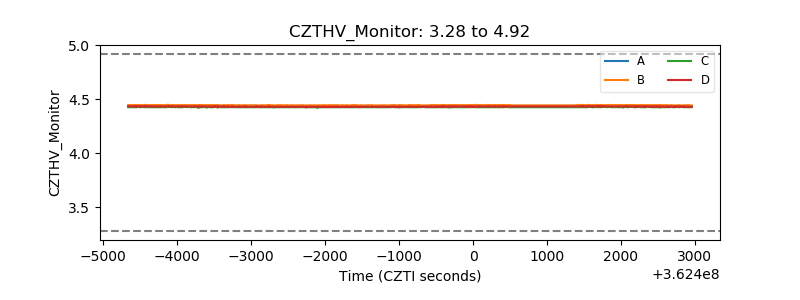 |
| D_VDD | 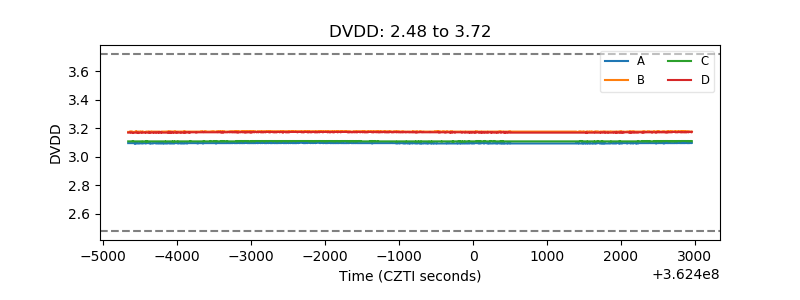 |
| Temperature 1 | 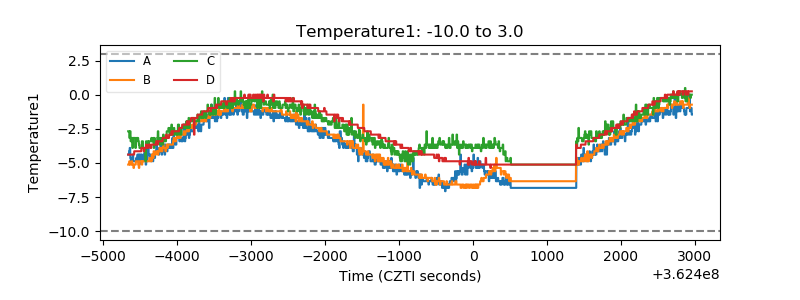 |
| Veto HV Monitor |  |
| Veto LLD | 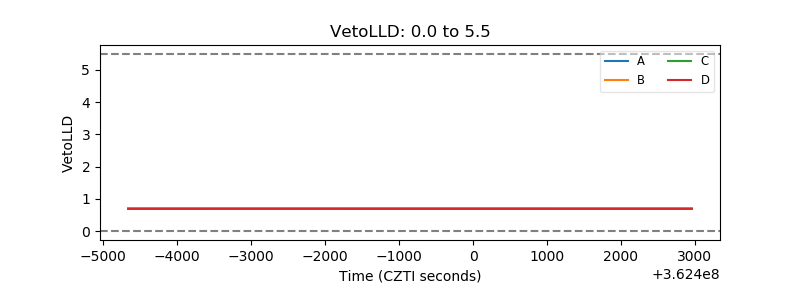 |
| Alpha Counter | 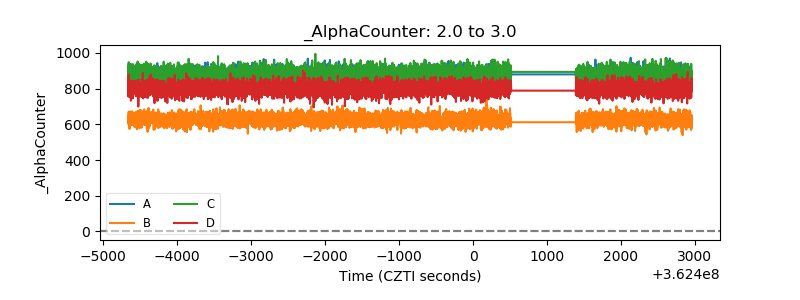 |
| _CPM_Rate | 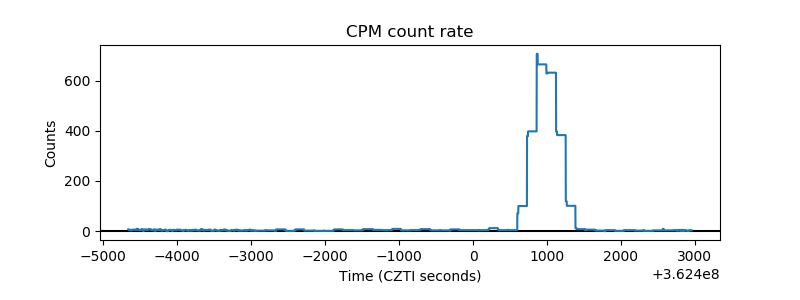 |
| CZT Counter | 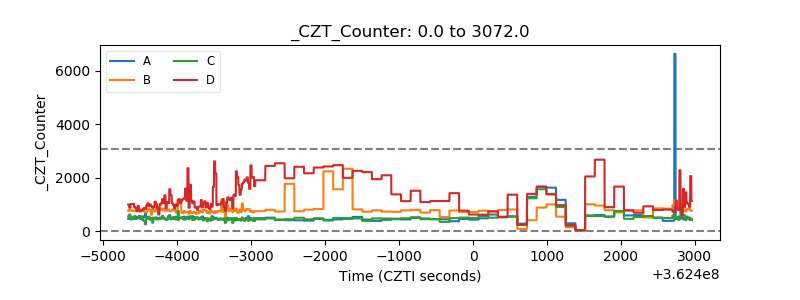 |
| +2.5 Volts monitor |  |
| +5 Volts monitor |  |
| _ROLL_ROT | 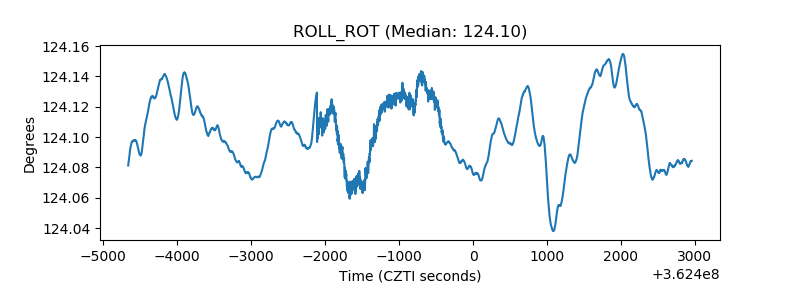 |
| _Roll_DEC |  |
| _Roll_RA | 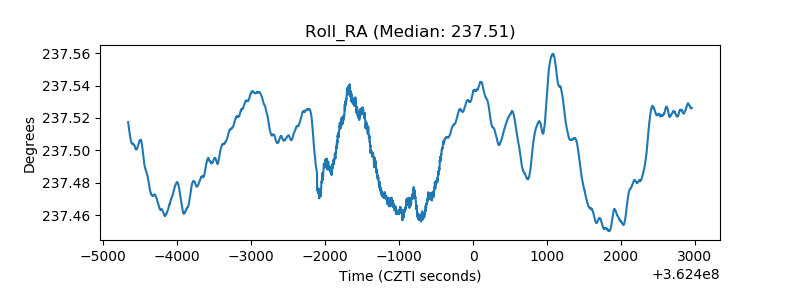 |
| Veto Counter | 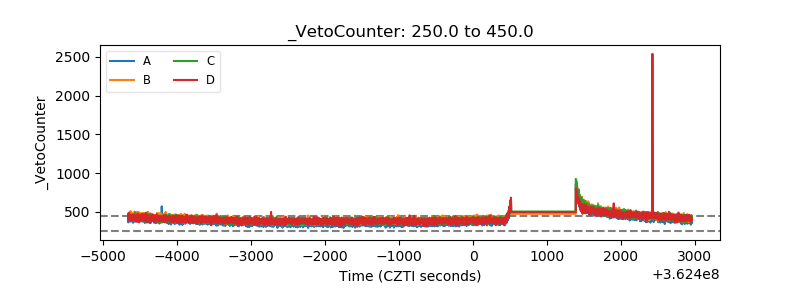 |