| Param | Original file | Final file |
|---|---|---|
| Filename | modeM0/AS1C06_002T01_9000004490_31059cztM0_level2.evt | modeM0/AS1C06_002T01_9000004490_31059cztM0_level2_quad_clean.evt |
| Size (bytes) | 623,275,200 | 112,302,720 |
| Size | 594.4 MB | 107.1 MB |
| Events in quadrant A | 2,850,767 | 786,641 |
| Events in quadrant B | 5,030,728 | 770,951 |
| Events in quadrant C | 3,099,307 | 750,087 |
| Events in quadrant D | 7,492,746 | 676,919 |
| Mode M0 | |||
|---|---|---|---|
| Quadrant | BADHDUFLAG | Total packets | Discarded packets |
| A | 0 | 12440 | 1 |
| B | 0 | 19088 | 3 |
| C | 0 | 12961 | 1 |
| D | 0 | 26540 | 1 |
| Mode M9 | |||
|---|---|---|---|
| Quadrant | BADHDUFLAG | Total packets | Discarded packets |
| A | 0 | 10 | 0 |
| B | 0 | 10 | 0 |
| C | 0 | 10 | 0 |
| D | 0 | 10 | 0 |
| Mode SS | |||
|---|---|---|---|
| Quadrant | BADHDUFLAG | Total packets | Discarded packets |
| A | 0 | 122 | 0 |
| B | 0 | 122 | 0 |
| C | 0 | 122 | 0 |
| D | 0 | 122 | 0 |
| Quadrant | Total seconds | Saturated seconds | Saturation percentage |
|---|---|---|---|
| A | 5958 | 54 | 0.906344% |
| B | 5958 | 151 | 2.534408% |
| C | 5958 | 117 | 1.963746% |
| D | 5958 | 735 | 12.336354% |
Noise dominated data is calculated using 1-second bins in cleaned event files. If a bin has >2000 counts, and if more than 50% of those come from <1% of pixels, then it is considered to be noise-dominated and hence unusable.
| Quadrant | # 1 sec bins | Bins with >0 counts | Bins with >2000 counts | High rate bins dominated by noise | Noise dominated (total time) | Noise dominated (detector-on time) | Marked lightcurve |
|---|---|---|---|---|---|---|---|
| A | 6993 | 5959 | 0 | 0 | 0.00% | 0.00% | 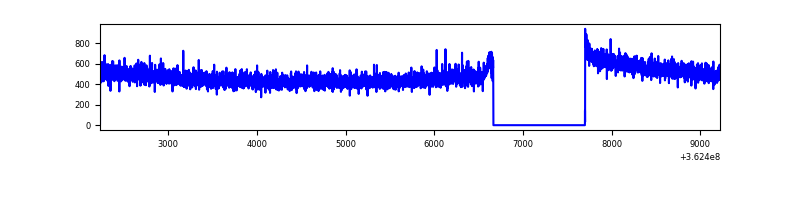 |
| B | 6993 | 5959 | 19 | 19 | 0.27% | 0.32% | 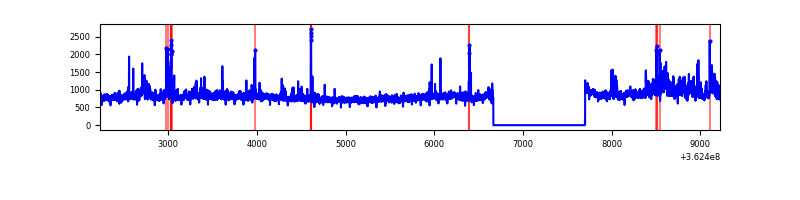 |
| C | 6993 | 5959 | 6 | 6 | 0.09% | 0.10% | 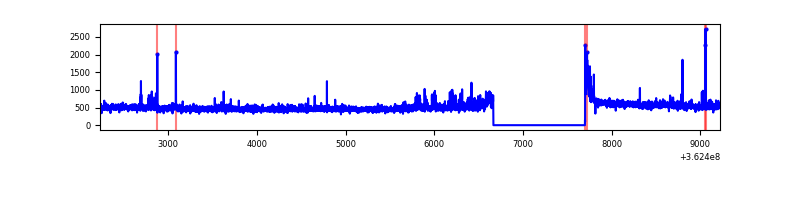 |
| D | 6993 | 5959 | 697 | 697 | 9.97% | 11.70% | 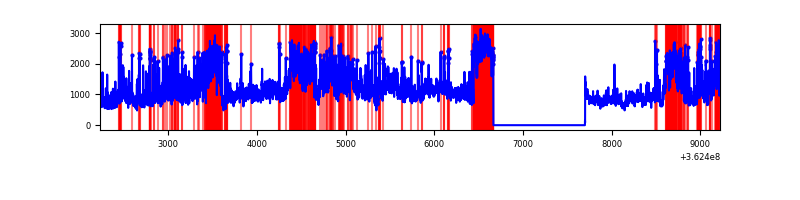 |
Top three noisy pixels from each quadrant. If the there are fewer than three noisy pixels in the level2.evt file, extra rows are filled as -1
| Pixel properties | Quadrant properties | ||||||
|---|---|---|---|---|---|---|---|
| Quadrant | DetID | PixID | Counts | Sigma | Mean | Median | Sigma |
| A | 13 | 254 | 11906 | 75.63 | 737 | 723 | 147.9 |
| A | 3 | 137 | 7004 | 42.48 | 737 | 723 | 147.9 |
| A | 0 | 226 | 6342 | 38.0 | 737 | 723 | 147.9 |
| B | 6 | 159 | 1733760 | 12757.43 | 720 | 702 | 135.8 |
| B | 0 | 183 | 183476 | 1345.44 | 720 | 702 | 135.8 |
| B | 5 | 172 | 67779 | 493.77 | 720 | 702 | 135.8 |
| C | 3 | 233 | 128157 | 774.95 | 701 | 705 | 164.5 |
| C | 14 | 238 | 112781 | 681.46 | 701 | 705 | 164.5 |
| C | 0 | 10 | 58752 | 352.94 | 701 | 705 | 164.5 |
| D | 13 | 174 | 2694504 | 16704.71 | 676 | 659 | 161.3 |
| D | 8 | 195 | 1454587 | 9015.91 | 676 | 659 | 161.3 |
| D | 12 | 1 | 483050 | 2991.34 | 676 | 659 | 161.3 |
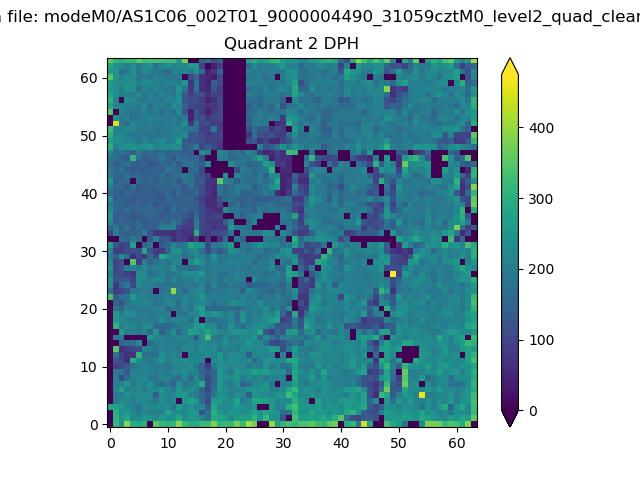
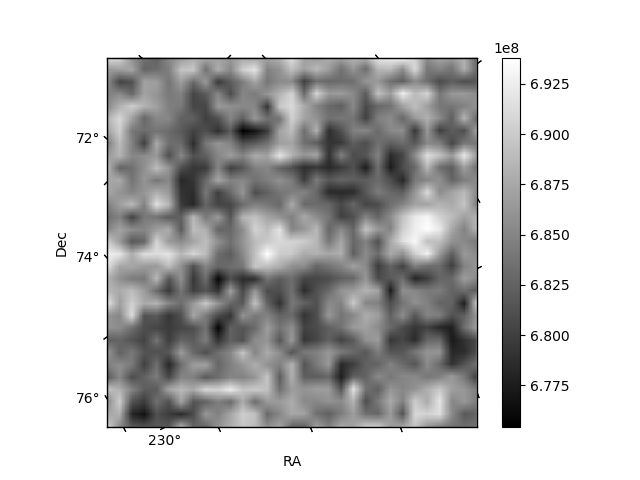
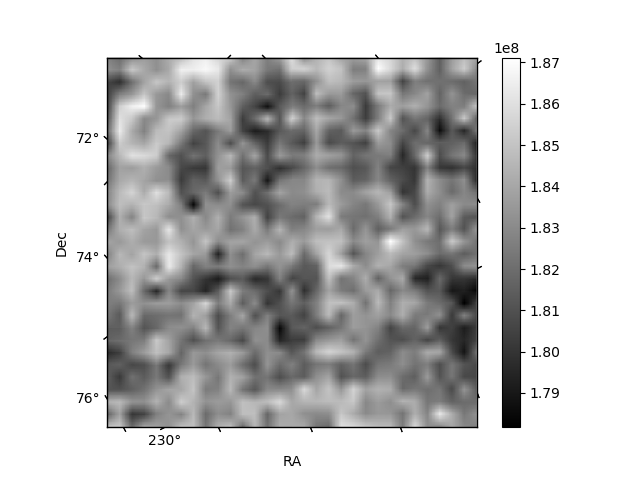
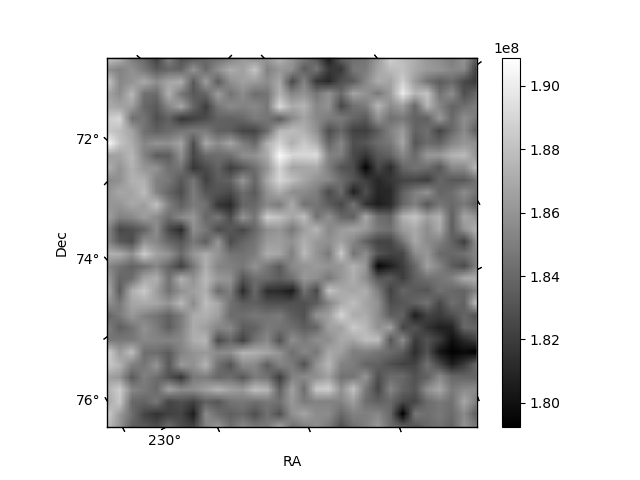
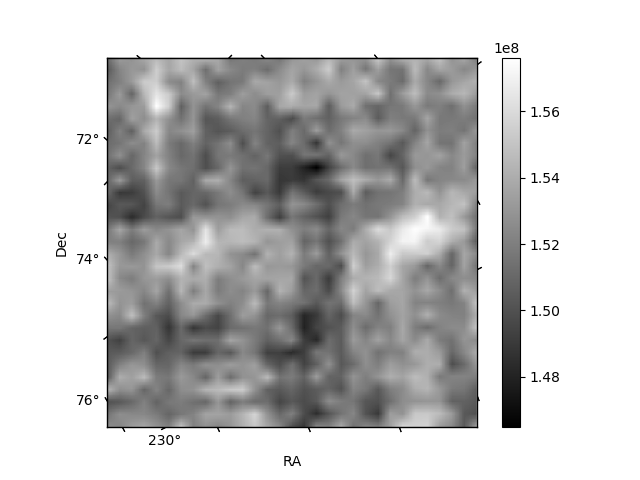
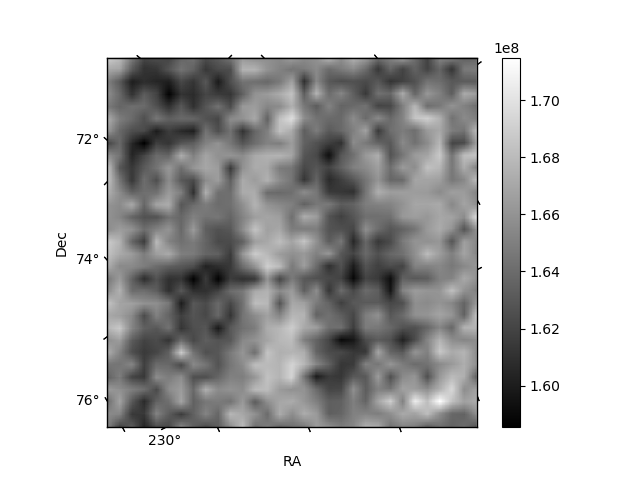
Histogram calculated using DETX and DETY for each event in the final _common_clean file
| Quadrant A | 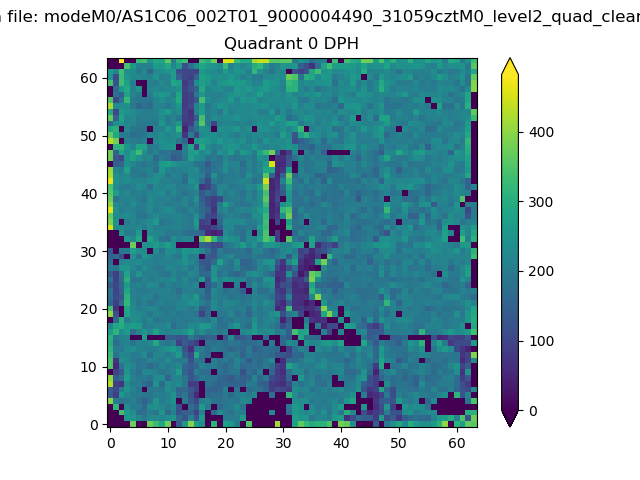 |
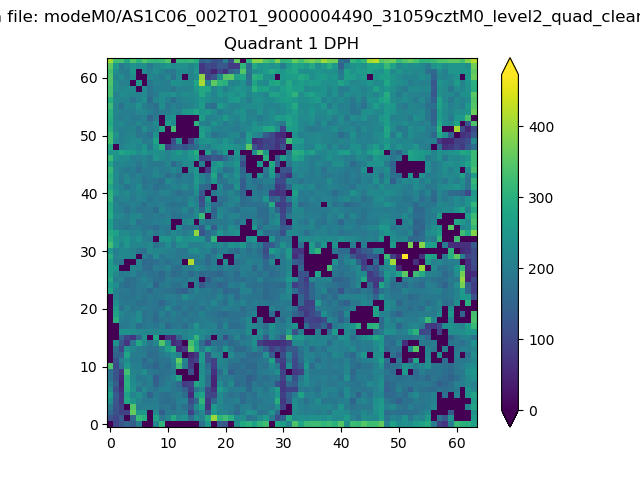 |
Quadrant B |
|---|---|---|---|
| Quadrant D | 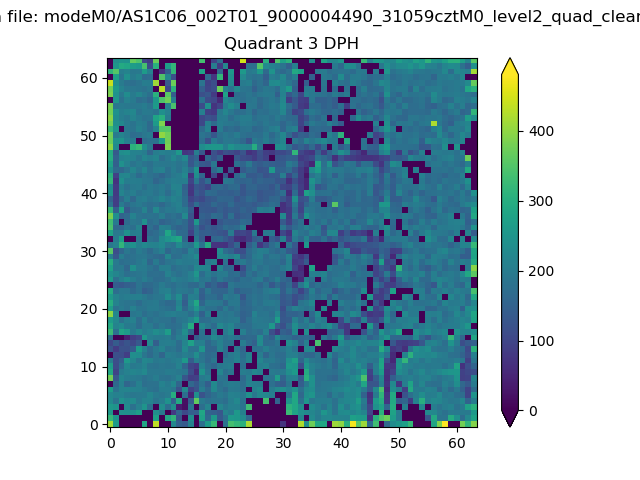 |
 |
Quadrant C |
| Plot type | Count rate plots | Images |
|---|---|---|
| Comparison with Poisson distribution Blue bars denote a histogram of data divided into 1 sec bins. Red curve is a Poisson curve with rate = median count rate of data. |
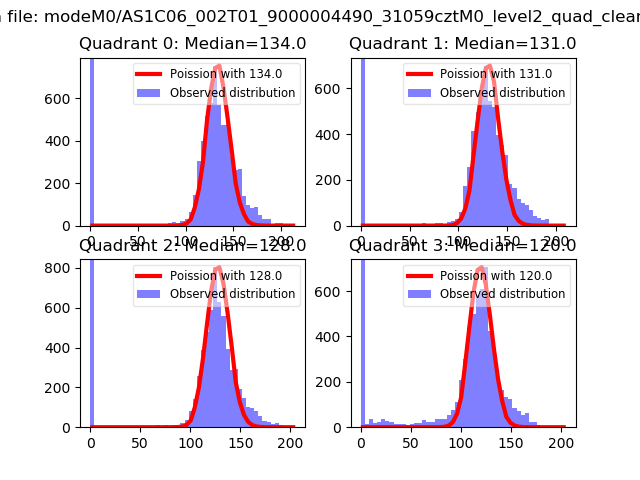 |
 |
| Quadrant-wise count rates Data is divided into 100 sec bins |
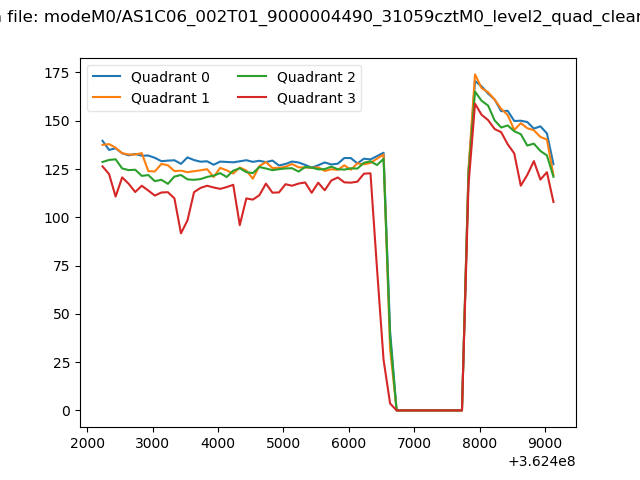 |
|
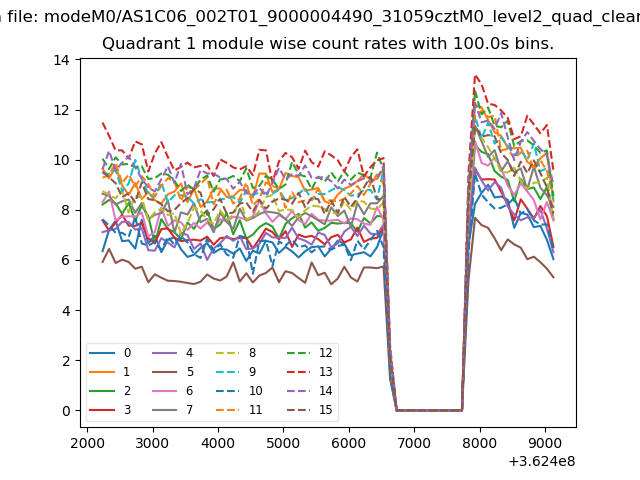
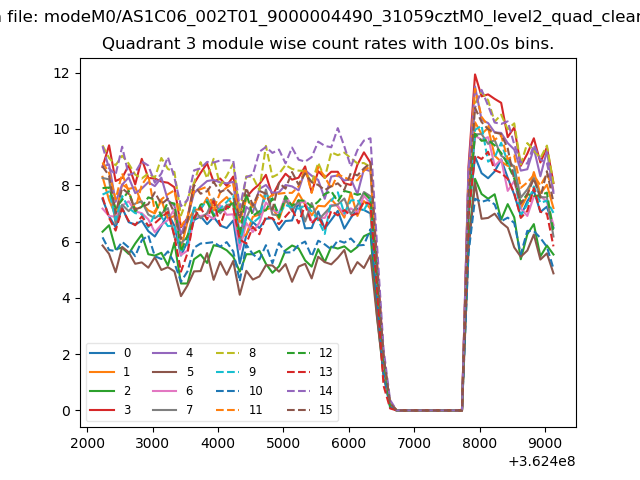
| Module-wise count rates for Quadrant A Data is divided into 100 sec bins |
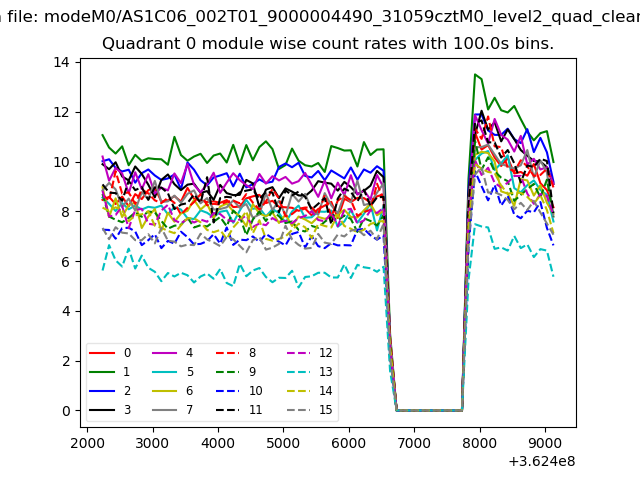 |
 |
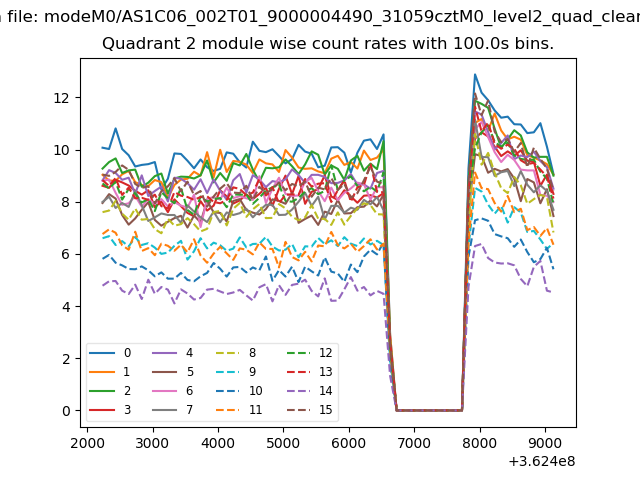
| Module-wise count rates for Quadrant B Data is divided into 100 sec bins |
 |
 |
| Module-wise count rates for Quadrant C Data is divided into 100 sec bins |
 |
 |
| Module-wise count rates for Quadrant D Data is divided into 100 sec bins |
 |
 |
| Parameter | Plot |
|---|---|
| CZT HV Monitor | 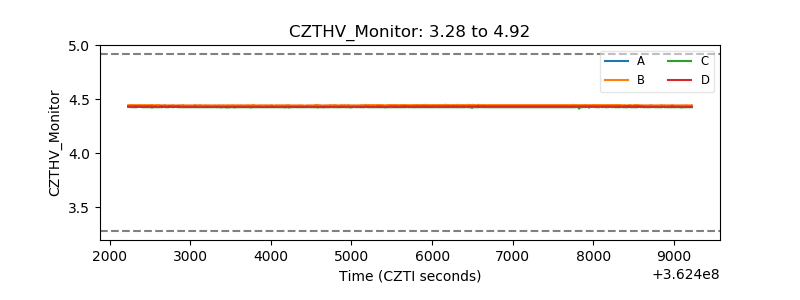 |
| D_VDD | 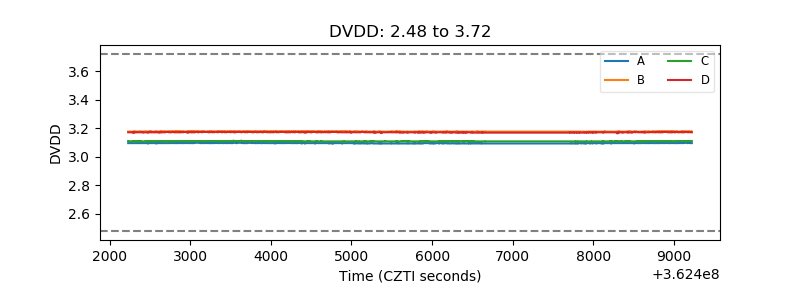 |
| Temperature 1 | 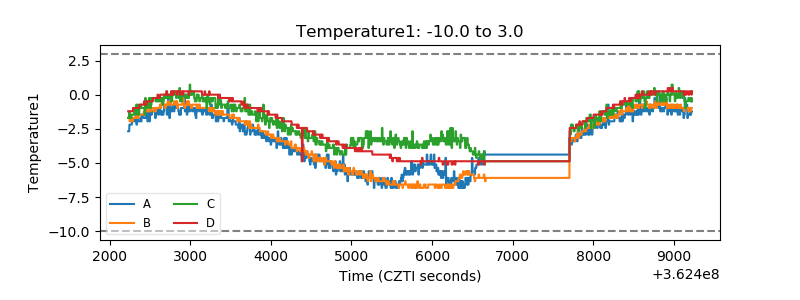 |
| Veto HV Monitor | 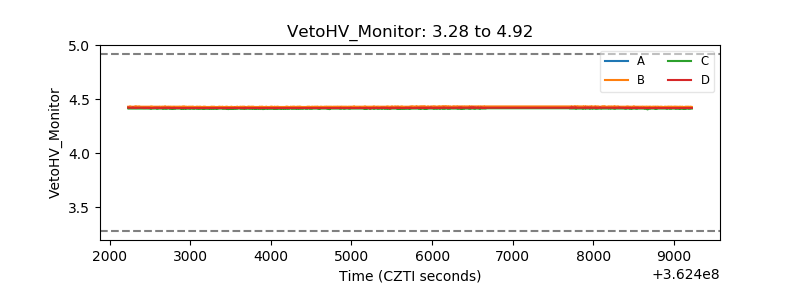 |
| Veto LLD | 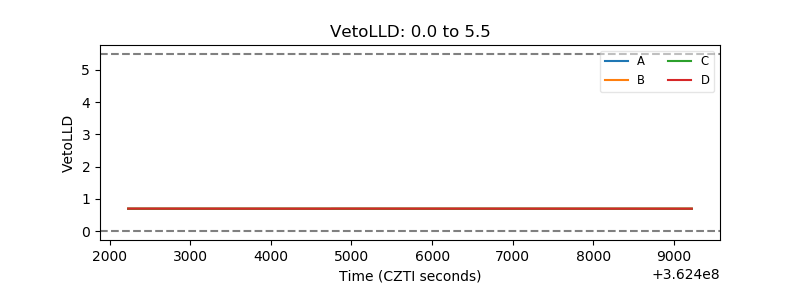 |
| Alpha Counter | 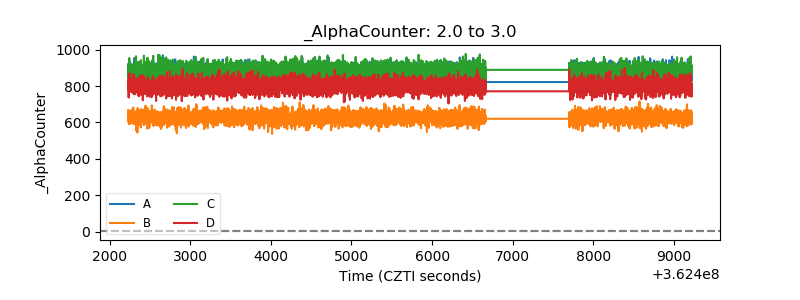 |
| _CPM_Rate | 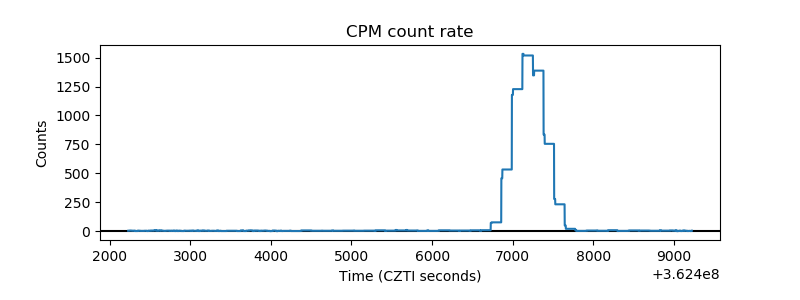 |
| CZT Counter | 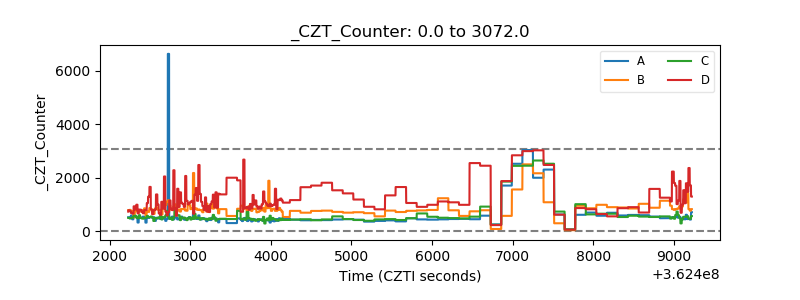 |
| +2.5 Volts monitor |  |
| +5 Volts monitor |  |
| _ROLL_ROT | 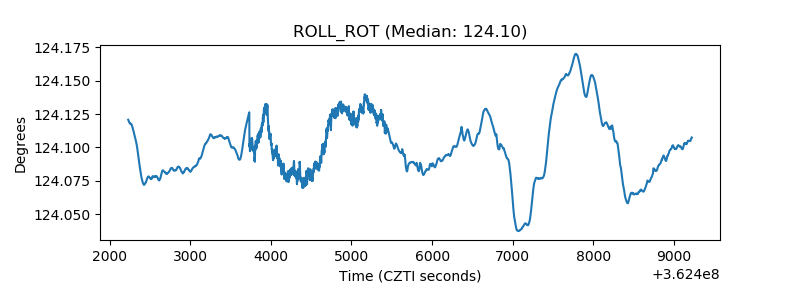 |
| _Roll_DEC | 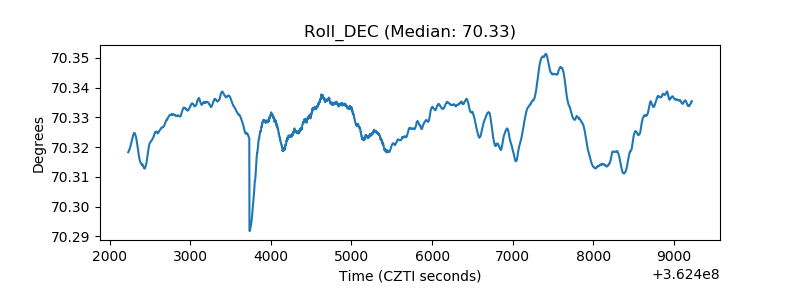 |
| _Roll_RA | 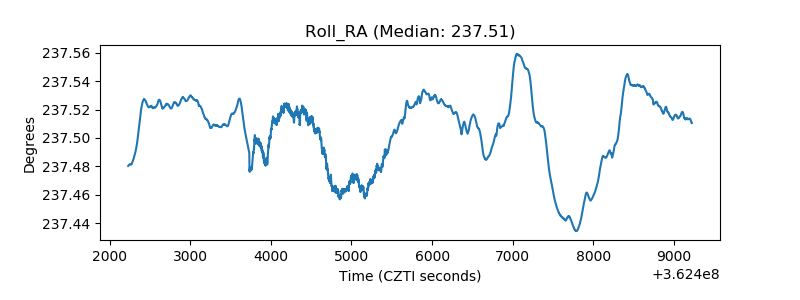 |
| Veto Counter | 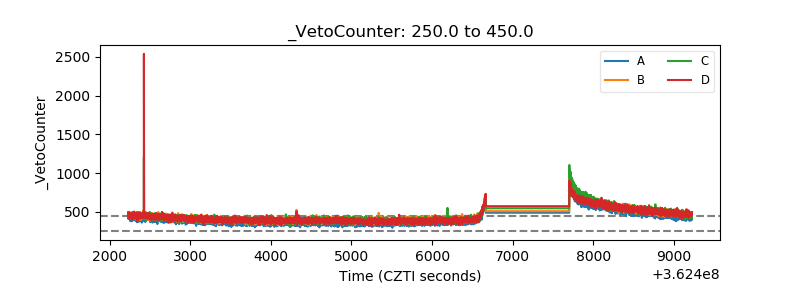 |