| Param | Original file | Final file |
|---|---|---|
| Filename | modeM0/AS1C06_002T01_9000004490_31061cztM0_level2.evt | modeM0/AS1C06_002T01_9000004490_31061cztM0_level2_quad_clean.evt |
| Size (bytes) | 590,175,360 | 122,898,240 |
| Size | 562.8 MB | 117.2 MB |
| Events in quadrant A | 3,026,924 | 855,118 |
| Events in quadrant B | 5,195,410 | 841,252 |
| Events in quadrant C | 3,348,189 | 821,544 |
| Events in quadrant D | 5,891,324 | 779,067 |
| Mode M0 | |||
|---|---|---|---|
| Quadrant | BADHDUFLAG | Total packets | Discarded packets |
| A | 0 | 13029 | 1 |
| B | 0 | 19718 | 1 |
| C | 0 | 13855 | 1 |
| D | 0 | 21920 | 1 |
| Mode M9 | |||
|---|---|---|---|
| Quadrant | BADHDUFLAG | Total packets | Discarded packets |
| A | 0 | 12 | 0 |
| B | 0 | 12 | 0 |
| C | 0 | 12 | 0 |
| D | 0 | 12 | 0 |
| Mode SS | |||
|---|---|---|---|
| Quadrant | BADHDUFLAG | Total packets | Discarded packets |
| A | 0 | 122 | 0 |
| B | 0 | 122 | 0 |
| C | 0 | 122 | 0 |
| D | 0 | 122 | 0 |
| Quadrant | Total seconds | Saturated seconds | Saturation percentage |
|---|---|---|---|
| A | 6098 | 79 | 1.295507% |
| B | 6099 | 140 | 2.295458% |
| C | 6099 | 166 | 2.721758% |
| D | 6099 | 344 | 5.640269% |
Noise dominated data is calculated using 1-second bins in cleaned event files. If a bin has >2000 counts, and if more than 50% of those come from <1% of pixels, then it is considered to be noise-dominated and hence unusable.
| Quadrant | # 1 sec bins | Bins with >0 counts | Bins with >2000 counts | High rate bins dominated by noise | Noise dominated (total time) | Noise dominated (detector-on time) | Marked lightcurve |
|---|---|---|---|---|---|---|---|
| A | 7273 | 6099 | 2 | 2 | 0.03% | 0.03% | 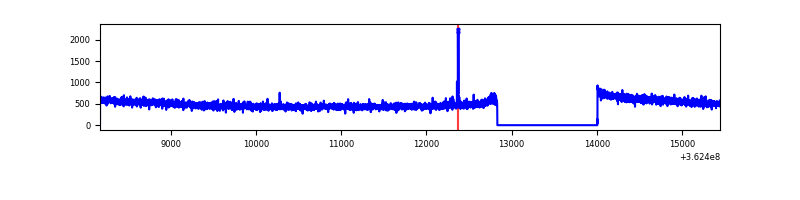 |
| B | 7274 | 6100 | 7 | 7 | 0.10% | 0.11% | 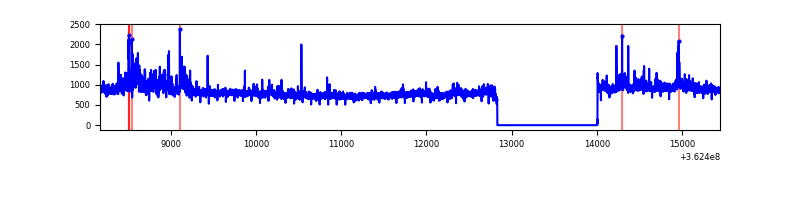 |
| C | 7274 | 6100 | 16 | 16 | 0.22% | 0.26% | 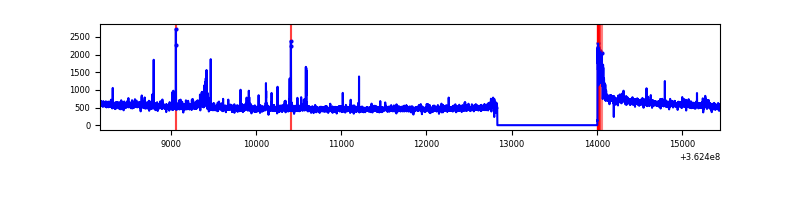 |
| D | 7274 | 6100 | 236 | 236 | 3.24% | 3.87% | 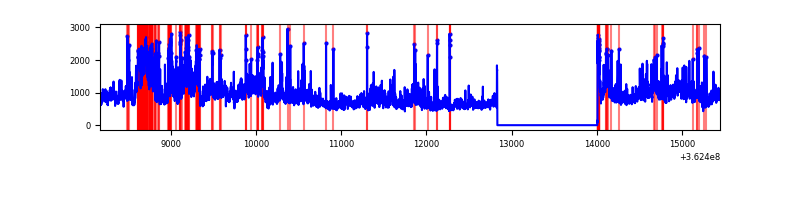 |
Top three noisy pixels from each quadrant. If the there are fewer than three noisy pixels in the level2.evt file, extra rows are filled as -1
| Pixel properties | Quadrant properties | ||||||
|---|---|---|---|---|---|---|---|
| Quadrant | DetID | PixID | Counts | Sigma | Mean | Median | Sigma |
| A | 12 | 96 | 14534 | 89.32 | 780 | 765 | 154.2 |
| A | 13 | 254 | 12845 | 78.36 | 780 | 765 | 154.2 |
| A | 3 | 137 | 7066 | 40.87 | 780 | 765 | 154.2 |
| B | 6 | 159 | 1839523 | 12990.66 | 765 | 747 | 141.5 |
| B | 0 | 183 | 188089 | 1323.54 | 765 | 747 | 141.5 |
| B | 5 | 172 | 41632 | 288.85 | 765 | 747 | 141.5 |
| C | 14 | 238 | 122539 | 710.78 | 748 | 754 | 171.3 |
| C | 0 | 10 | 112288 | 650.95 | 748 | 754 | 171.3 |
| C | 3 | 233 | 100617 | 582.83 | 748 | 754 | 171.3 |
| D | 8 | 195 | 1681910 | 9418.17 | 750 | 731 | 178.5 |
| D | 12 | 1 | 583681 | 3265.76 | 750 | 731 | 178.5 |
| D | 13 | 174 | 317544 | 1774.83 | 750 | 731 | 178.5 |
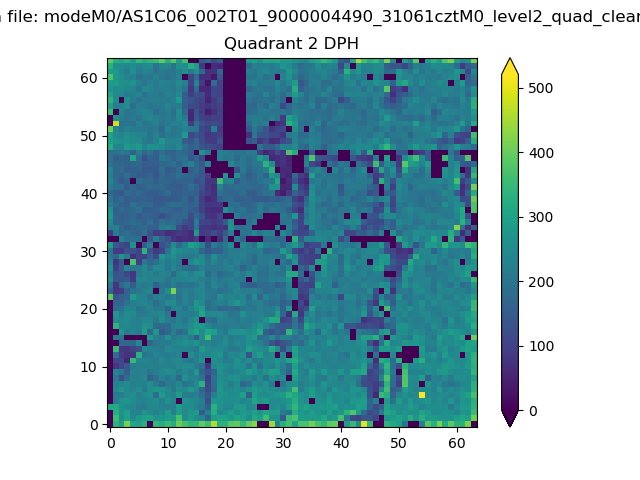
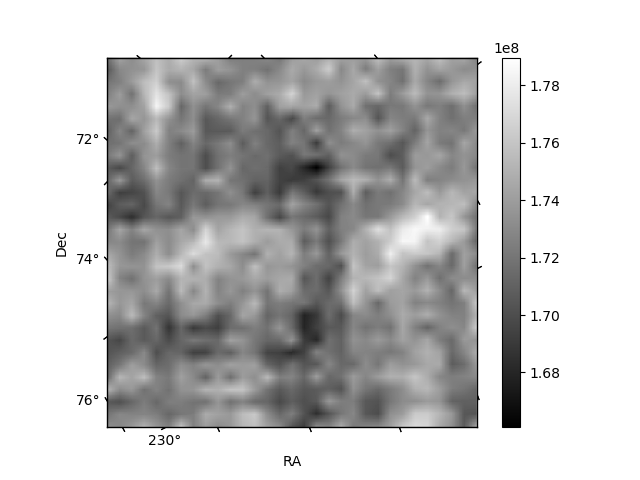
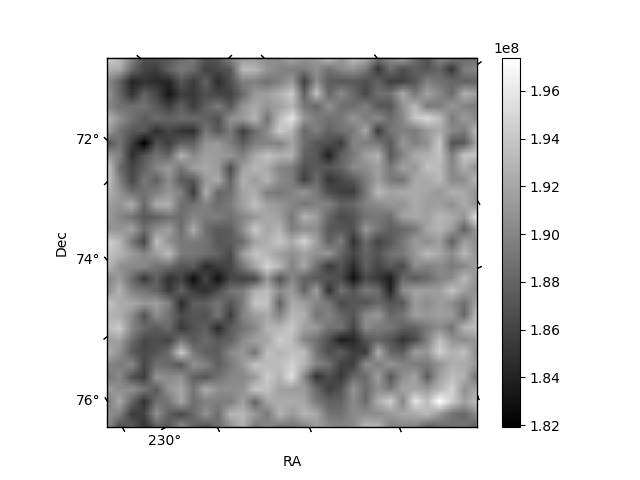
Histogram calculated using DETX and DETY for each event in the final _common_clean file
| Quadrant A | 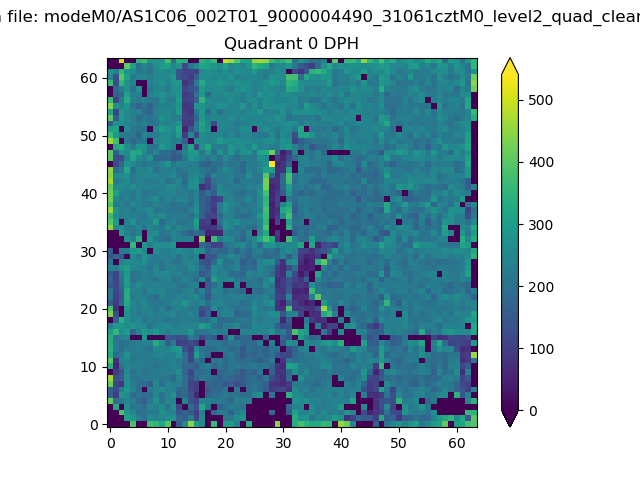 |
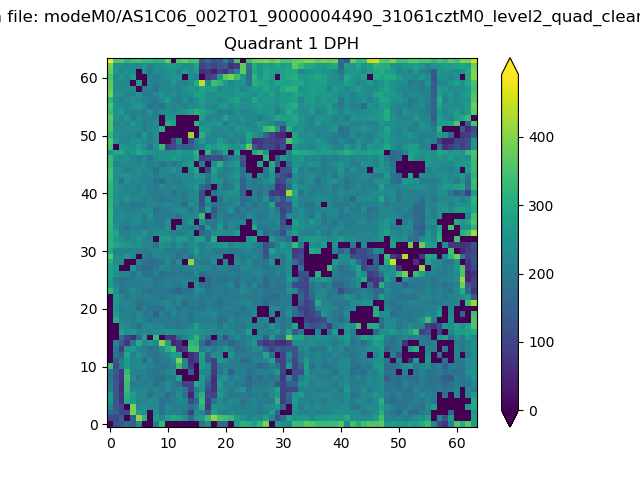 |
Quadrant B |
|---|---|---|---|
| Quadrant D | 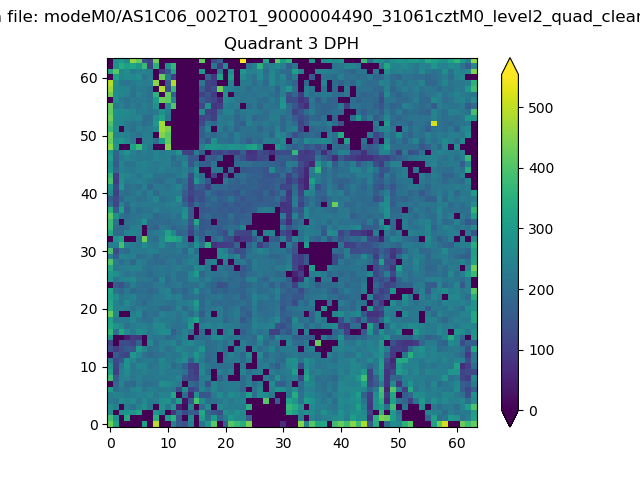 |
 |
Quadrant C |
| Plot type | Count rate plots | Images |
|---|---|---|
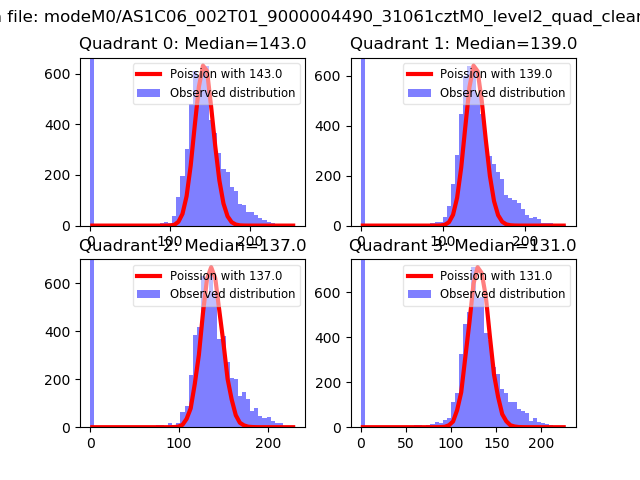
| Comparison with Poisson distribution Blue bars denote a histogram of data divided into 1 sec bins. Red curve is a Poisson curve with rate = median count rate of data. |
 |
 |
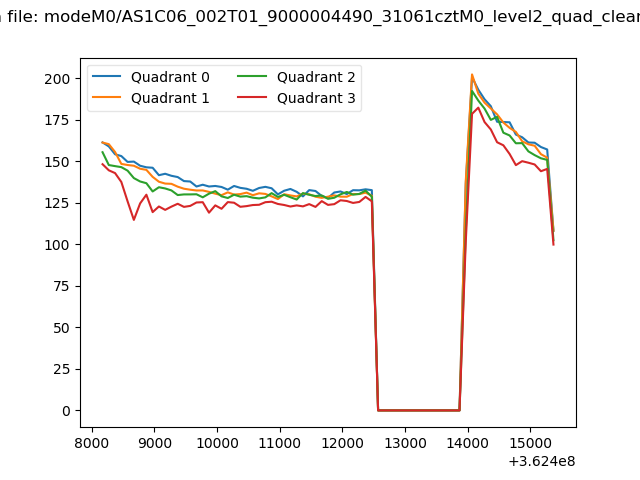
| Quadrant-wise count rates Data is divided into 100 sec bins |
 |
|
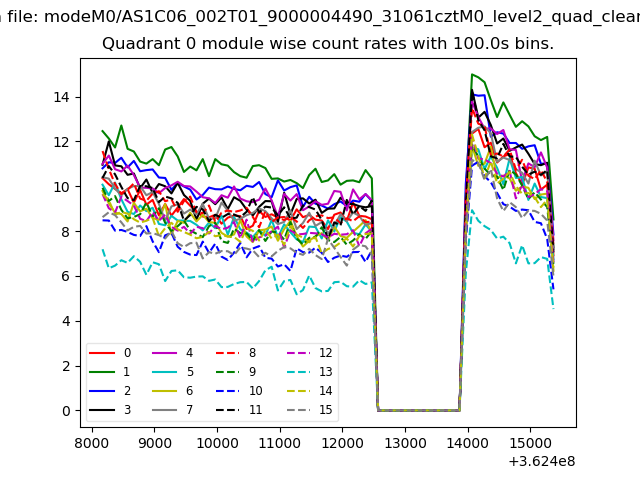
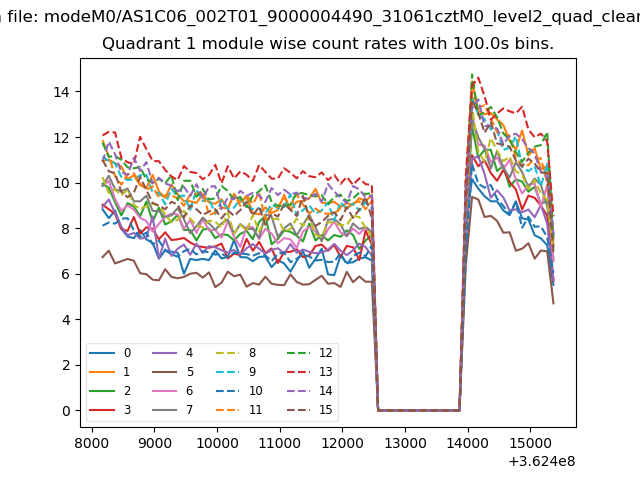
| Module-wise count rates for Quadrant A Data is divided into 100 sec bins |
 |
 |
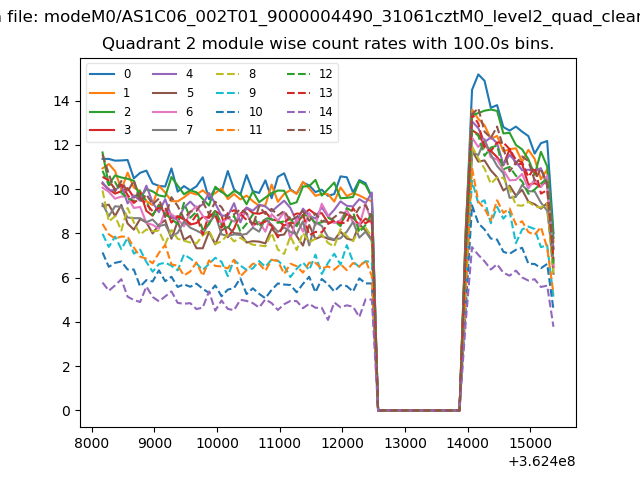
| Module-wise count rates for Quadrant B Data is divided into 100 sec bins |
 |
 |
| Module-wise count rates for Quadrant C Data is divided into 100 sec bins |
 |
 |
| Module-wise count rates for Quadrant D Data is divided into 100 sec bins |
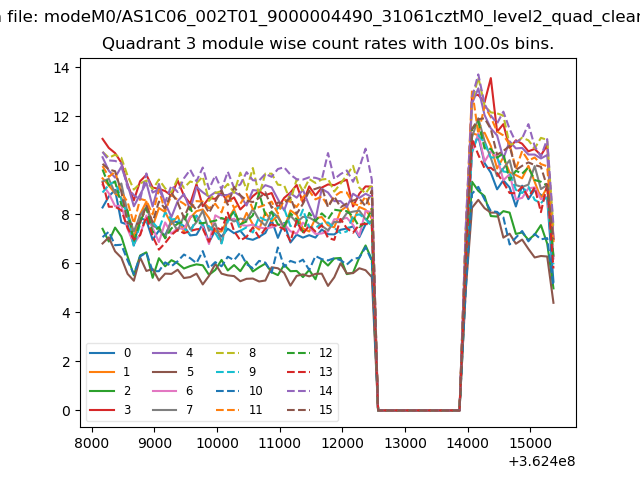 |
 |
| Parameter | Plot |
|---|---|
| CZT HV Monitor | 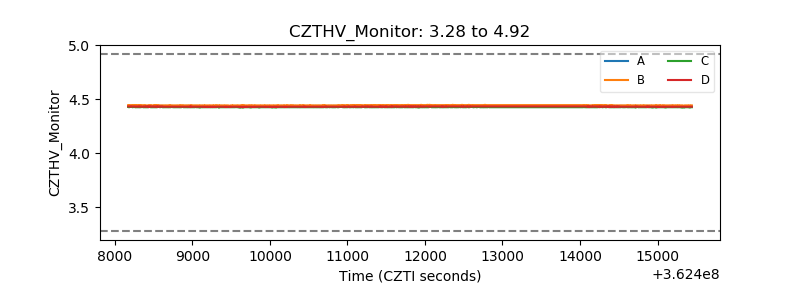 |
| D_VDD | 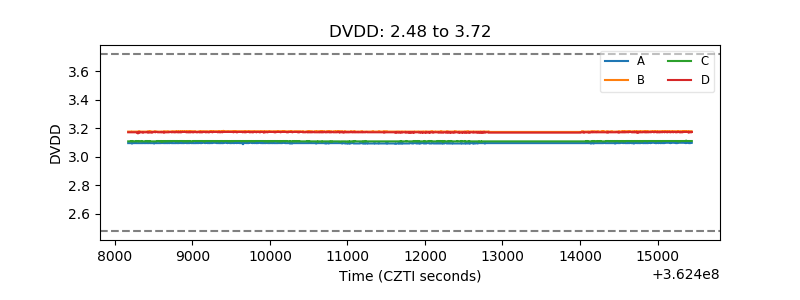 |
| Temperature 1 | 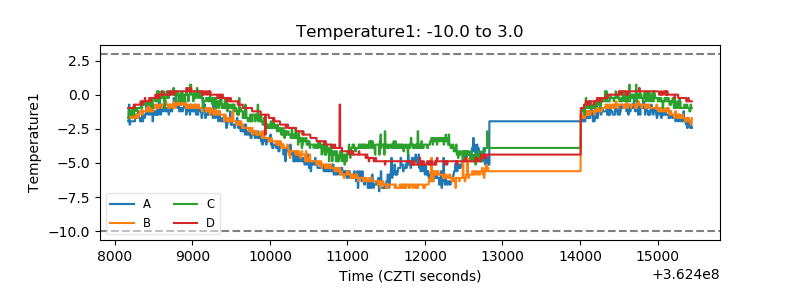 |
| Veto HV Monitor | 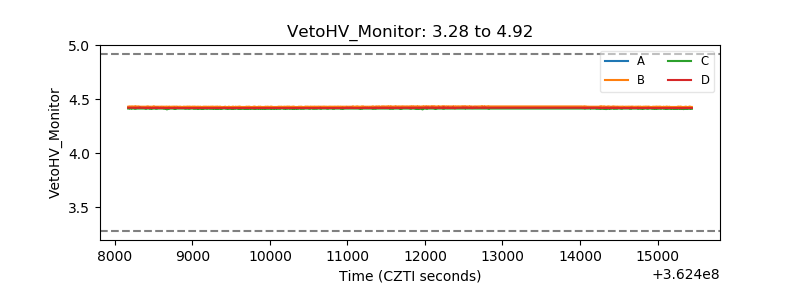 |
| Veto LLD | 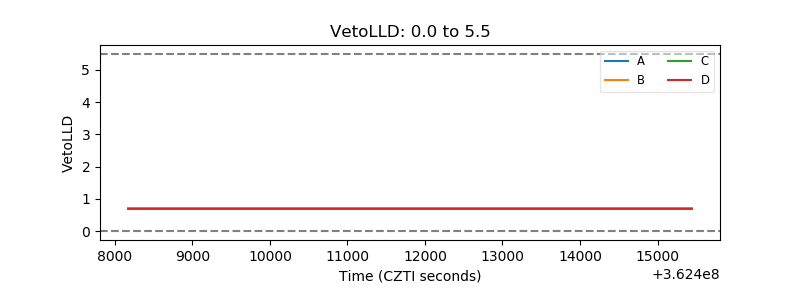 |
| Alpha Counter | 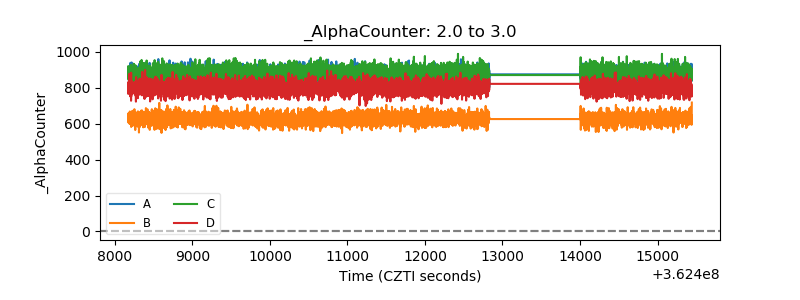 |
| _CPM_Rate | 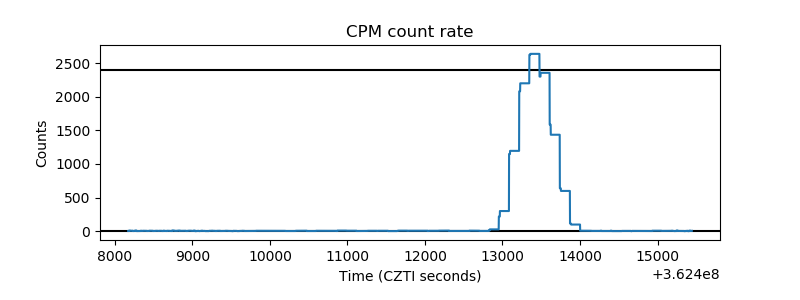 |
| CZT Counter | 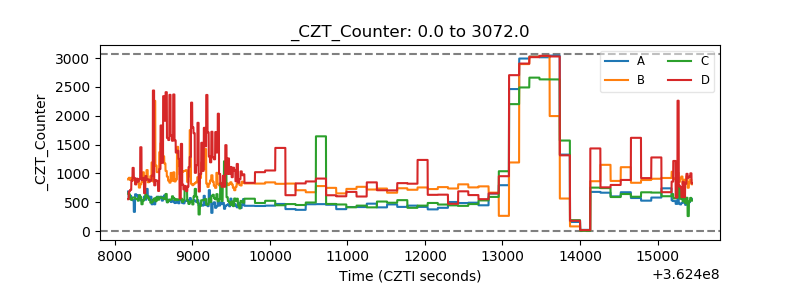 |
| +2.5 Volts monitor |  |
| +5 Volts monitor | 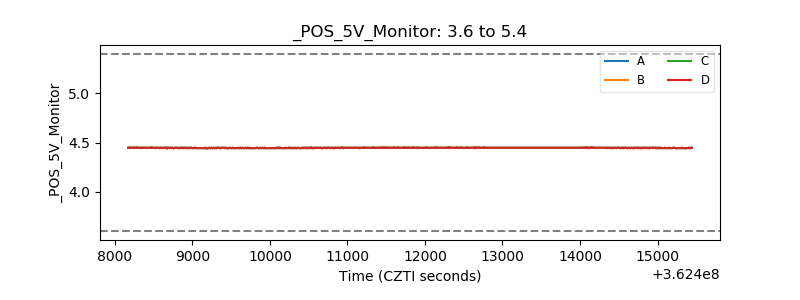 |
| _ROLL_ROT | 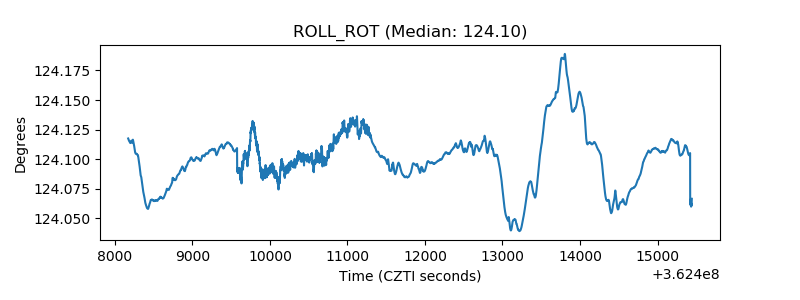 |
| _Roll_DEC | 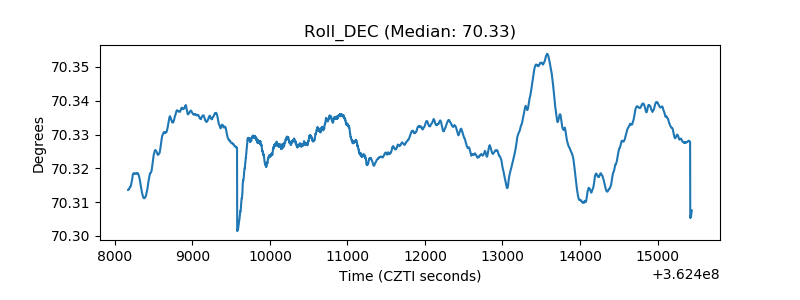 |
| _Roll_RA | 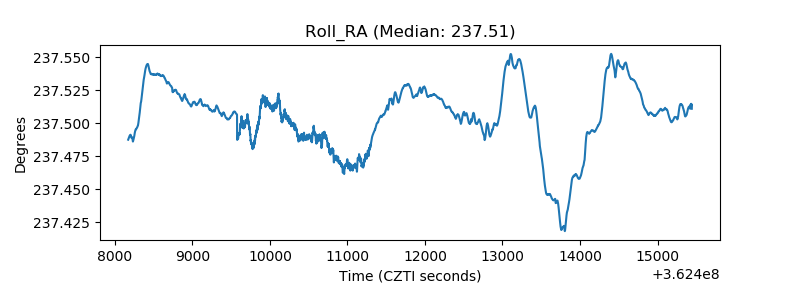 |
| Veto Counter | 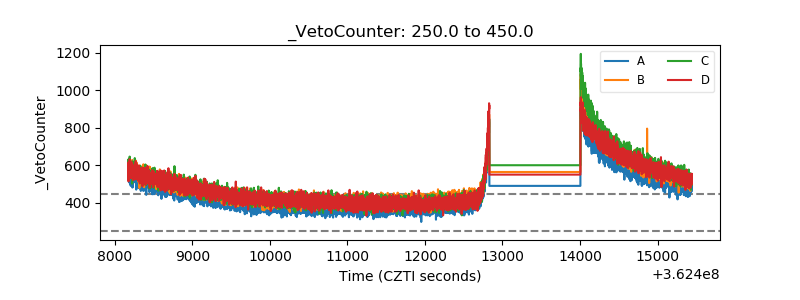 |