| Param | Original file | Final file |
|---|---|---|
| Filename | modeM0/AS1C06_002T01_9000004490_31062cztM0_level2.evt | modeM0/AS1C06_002T01_9000004490_31062cztM0_level2_quad_clean.evt |
| Size (bytes) | 580,510,080 | 123,701,760 |
| Size | 553.6 MB | 118.0 MB |
| Events in quadrant A | 3,099,531 | 856,260 |
| Events in quadrant B | 5,414,593 | 840,649 |
| Events in quadrant C | 3,457,058 | 831,299 |
| Events in quadrant D | 5,202,475 | 797,659 |
| Mode M0 | |||
|---|---|---|---|
| Quadrant | BADHDUFLAG | Total packets | Discarded packets |
| A | 0 | 13224 | 1 |
| B | 0 | 20285 | 1 |
| C | 0 | 14363 | 1 |
| D | 0 | 19832 | 1 |
| Mode M9 | |||
|---|---|---|---|
| Quadrant | BADHDUFLAG | Total packets | Discarded packets |
| A | 0 | 12 | 0 |
| B | 0 | 12 | 0 |
| C | 0 | 12 | 0 |
| D | 0 | 12 | 0 |
| Mode SS | |||
|---|---|---|---|
| Quadrant | BADHDUFLAG | Total packets | Discarded packets |
| A | 0 | 124 | 0 |
| B | 0 | 124 | 0 |
| C | 0 | 124 | 0 |
| D | 0 | 124 | 0 |
| Quadrant | Total seconds | Saturated seconds | Saturation percentage |
|---|---|---|---|
| A | 6019 | 53 | 0.880545% |
| B | 6019 | 148 | 2.458880% |
| C | 6019 | 188 | 3.123442% |
| D | 6019 | 200 | 3.322811% |
Noise dominated data is calculated using 1-second bins in cleaned event files. If a bin has >2000 counts, and if more than 50% of those come from <1% of pixels, then it is considered to be noise-dominated and hence unusable.
| Quadrant | # 1 sec bins | Bins with >0 counts | Bins with >2000 counts | High rate bins dominated by noise | Noise dominated (total time) | Noise dominated (detector-on time) | Marked lightcurve |
|---|---|---|---|---|---|---|---|
| A | 7289 | 6019 | 1 | 1 | 0.01% | 0.02% | 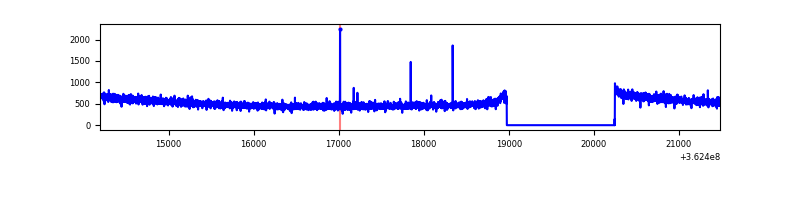 |
| B | 7289 | 6020 | 22 | 22 | 0.30% | 0.37% | 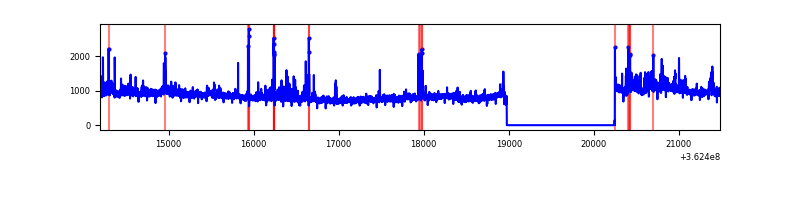 |
| C | 7289 | 6019 | 30 | 30 | 0.41% | 0.50% | 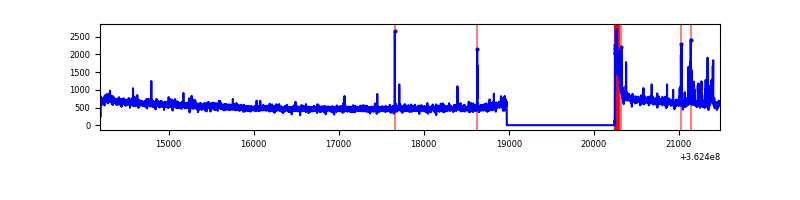 |
| D | 7289 | 6019 | 104 | 104 | 1.43% | 1.73% | 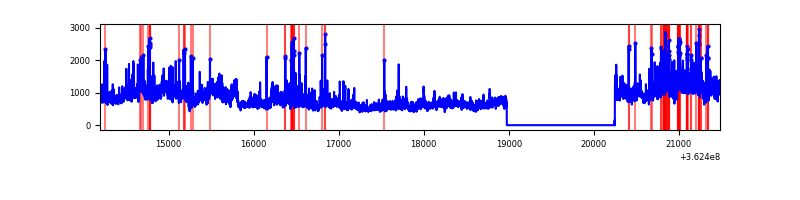 |
Top three noisy pixels from each quadrant. If the there are fewer than three noisy pixels in the level2.evt file, extra rows are filled as -1
| Pixel properties | Quadrant properties | ||||||
|---|---|---|---|---|---|---|---|
| Quadrant | DetID | PixID | Counts | Sigma | Mean | Median | Sigma |
| A | 13 | 254 | 13269 | 79.43 | 800 | 785 | 157.2 |
| A | 3 | 137 | 7154 | 40.52 | 800 | 785 | 157.2 |
| A | 8 | 255 | 7095 | 40.15 | 800 | 785 | 157.2 |
| B | 6 | 159 | 1905349 | 13272.2 | 786 | 766 | 143.5 |
| B | 0 | 183 | 215985 | 1499.77 | 786 | 766 | 143.5 |
| B | 4 | 80 | 60974 | 419.56 | 786 | 766 | 143.5 |
| C | 14 | 238 | 127165 | 713.86 | 775 | 783 | 177.0 |
| C | 0 | 10 | 124749 | 700.21 | 775 | 783 | 177.0 |
| C | 3 | 233 | 97835 | 548.19 | 775 | 783 | 177.0 |
| D | 8 | 195 | 1760471 | 9634.59 | 779 | 760 | 182.6 |
| D | 13 | 249 | 199768 | 1089.59 | 779 | 760 | 182.6 |
| D | 13 | 174 | 75354 | 408.41 | 779 | 760 | 182.6 |
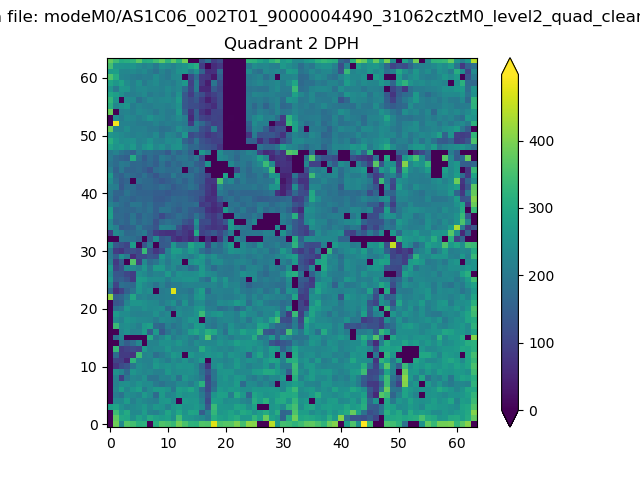
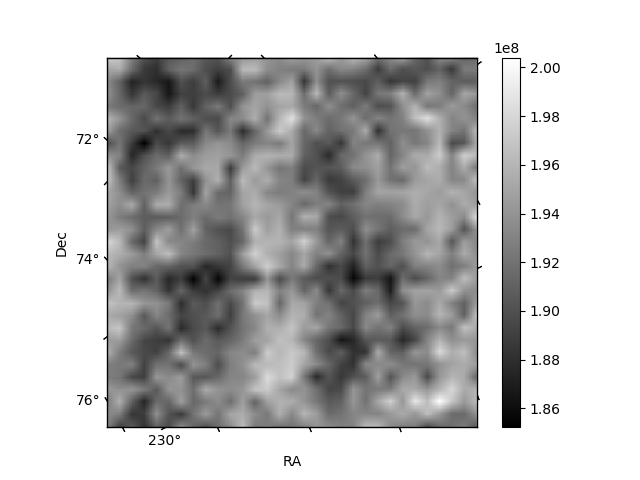
Histogram calculated using DETX and DETY for each event in the final _common_clean file
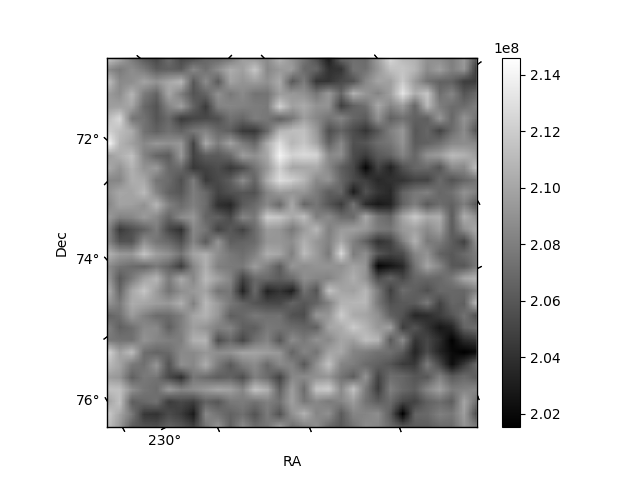
| Quadrant A | 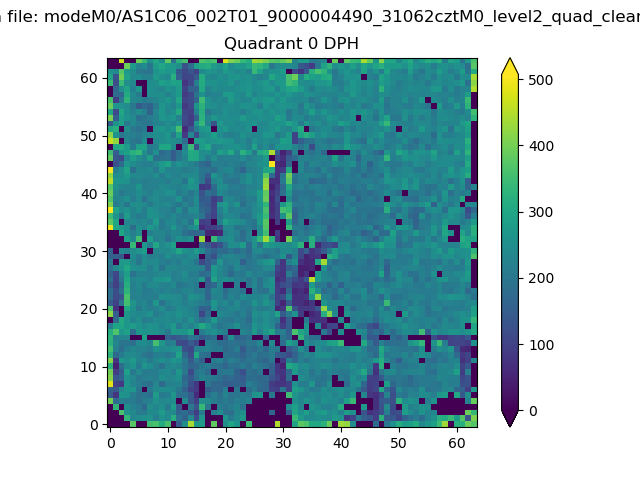 |
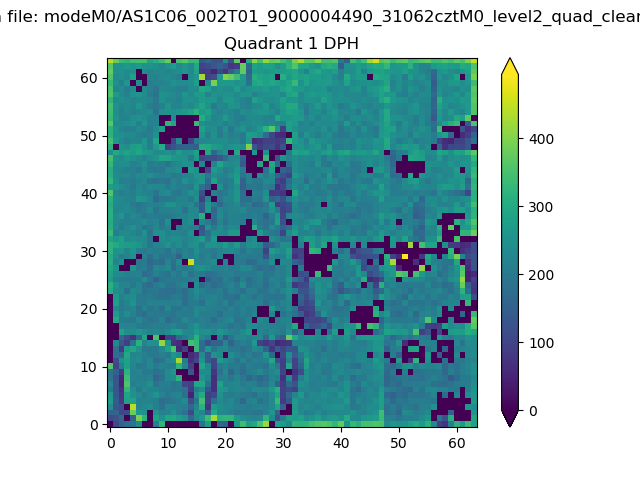 |
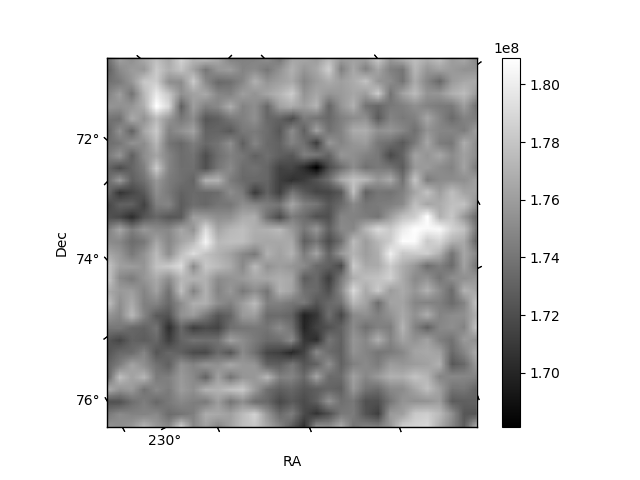
Quadrant B |
|---|---|---|---|
| Quadrant D | 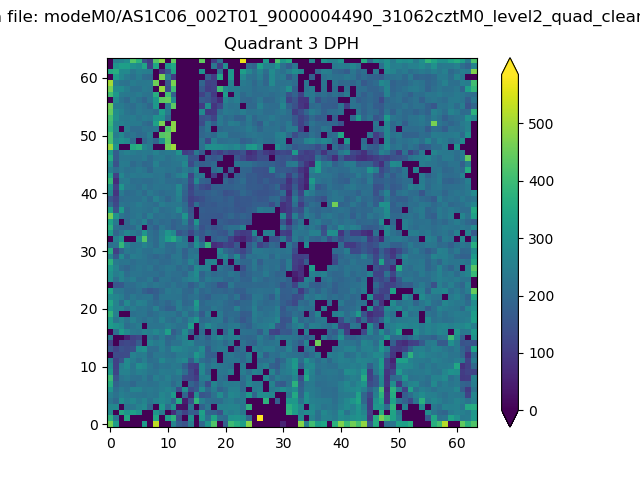 |
 |
Quadrant C |
| Plot type | Count rate plots | Images |
|---|---|---|
| Comparison with Poisson distribution Blue bars denote a histogram of data divided into 1 sec bins. Red curve is a Poisson curve with rate = median count rate of data. |
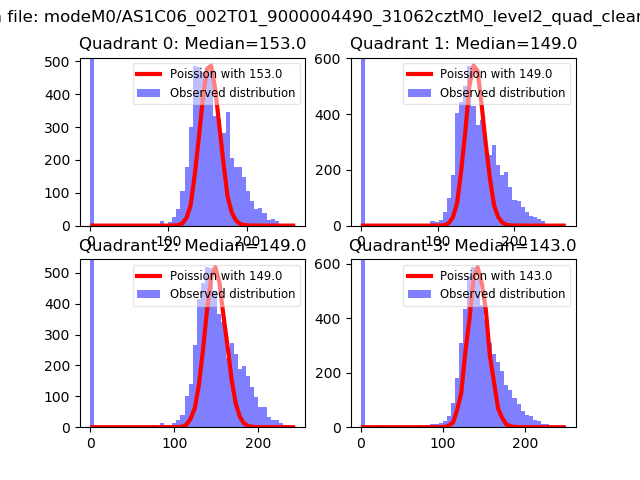 |
 |
| Quadrant-wise count rates Data is divided into 100 sec bins |
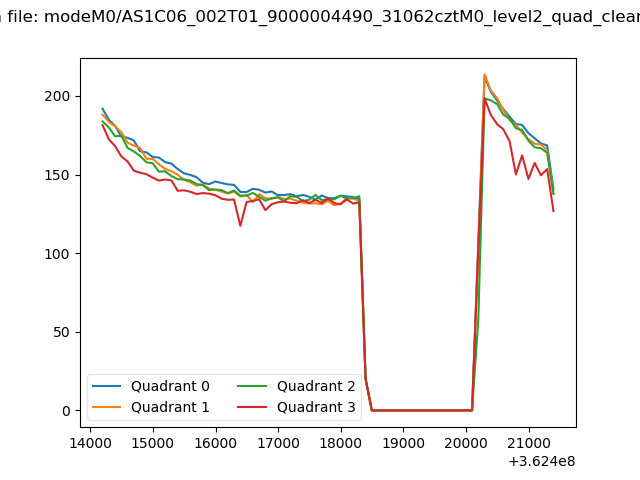 |
|
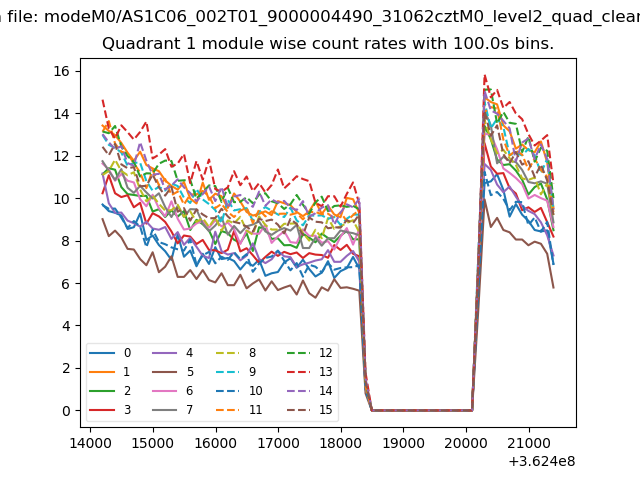
| Module-wise count rates for Quadrant A Data is divided into 100 sec bins |
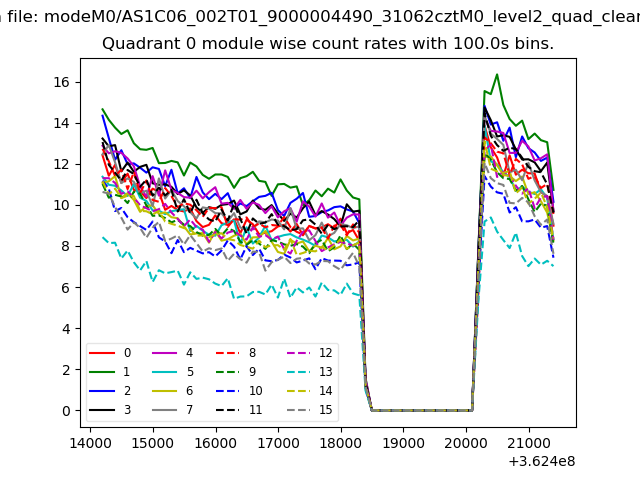 |
 |
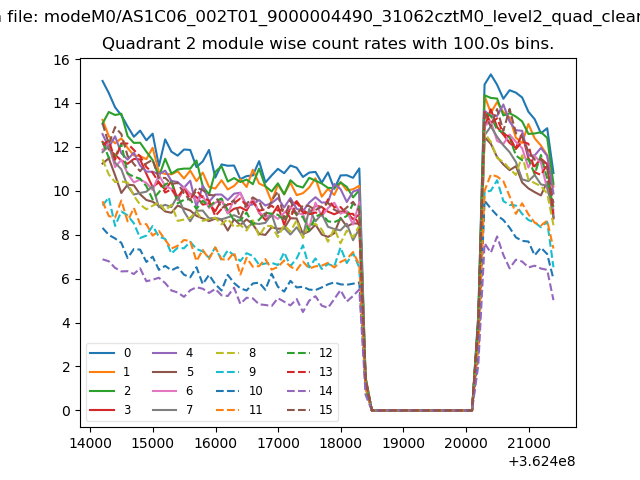
| Module-wise count rates for Quadrant B Data is divided into 100 sec bins |
 |
 |
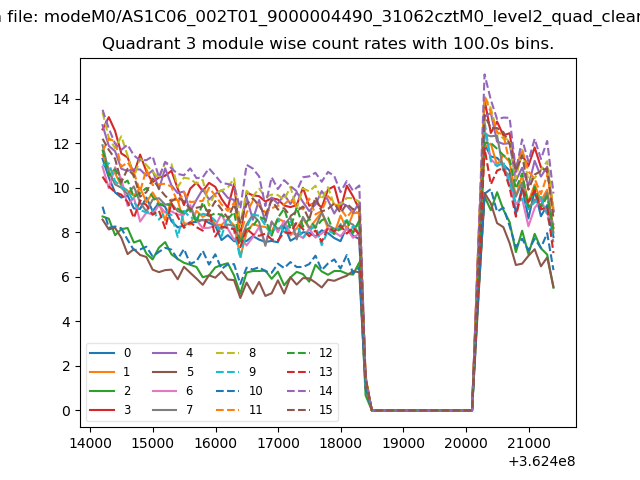
| Module-wise count rates for Quadrant C Data is divided into 100 sec bins |
 |
 |
| Module-wise count rates for Quadrant D Data is divided into 100 sec bins |
 |
 |
| Parameter | Plot |
|---|---|
| CZT HV Monitor | 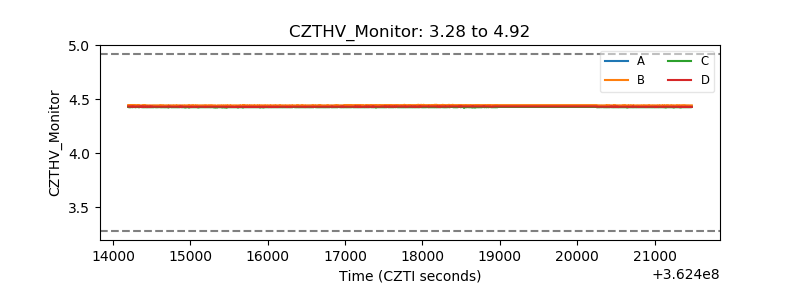 |
| D_VDD | 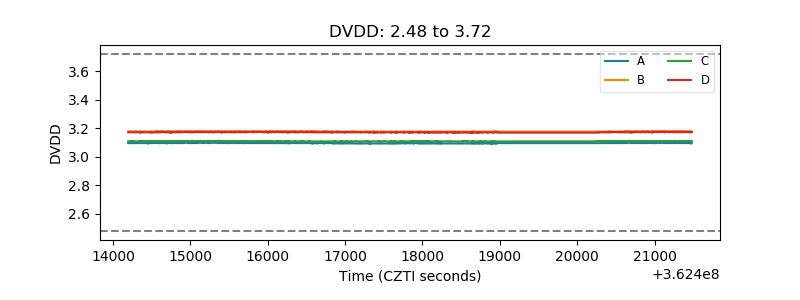 |
| Temperature 1 | 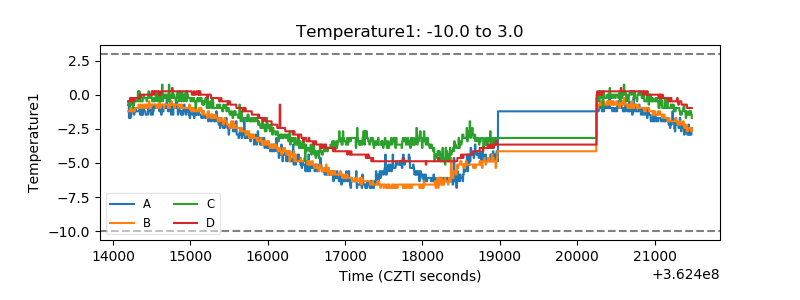 |
| Veto HV Monitor | 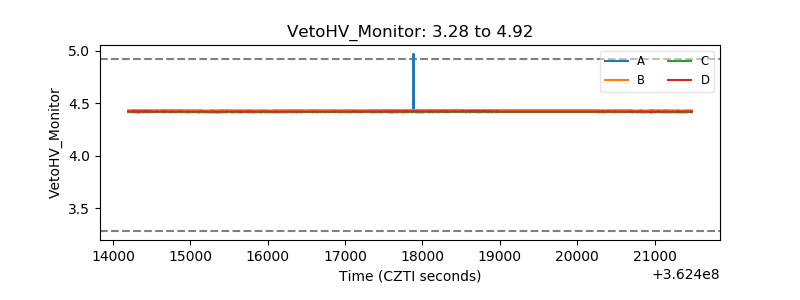 |
| Veto LLD | 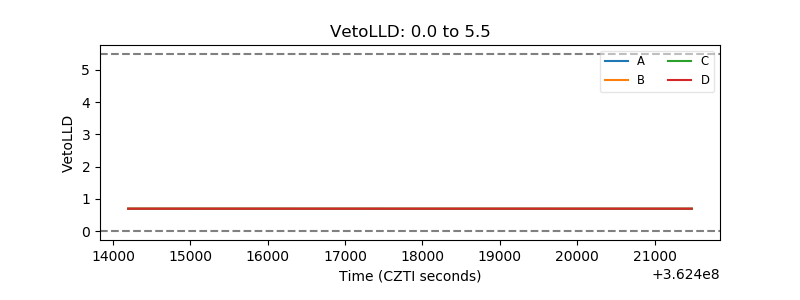 |
| Alpha Counter | 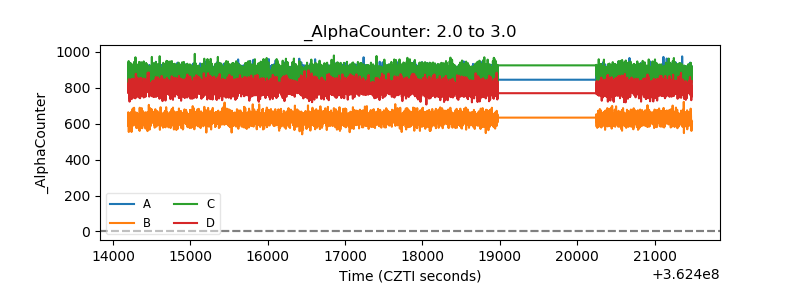 |
| _CPM_Rate | 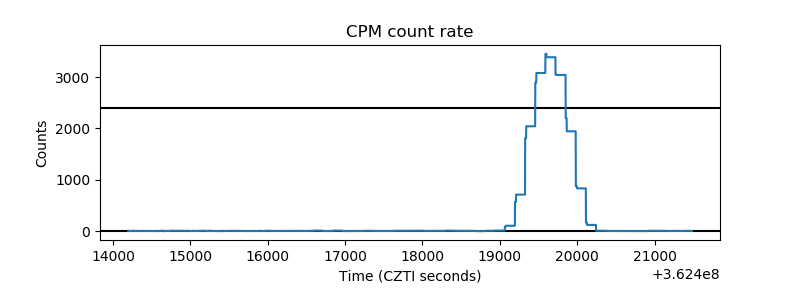 |
| CZT Counter | 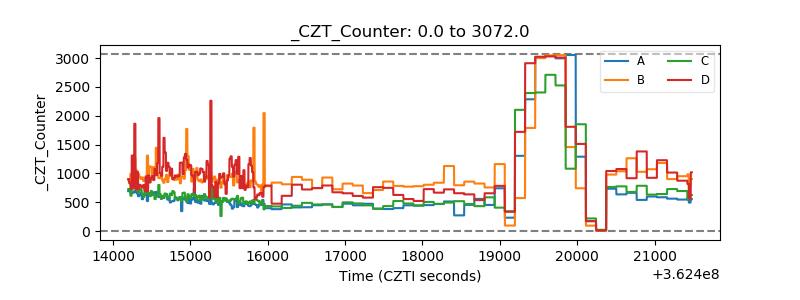 |
| +2.5 Volts monitor |  |
| +5 Volts monitor |  |
| _ROLL_ROT | 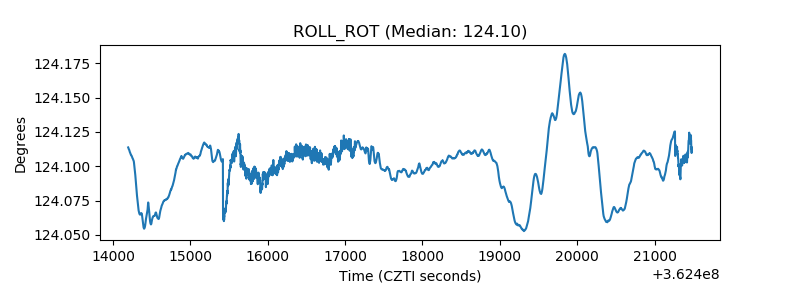 |
| _Roll_DEC | 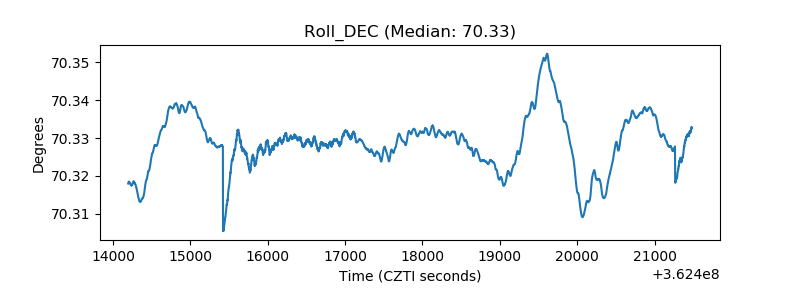 |
| _Roll_RA | 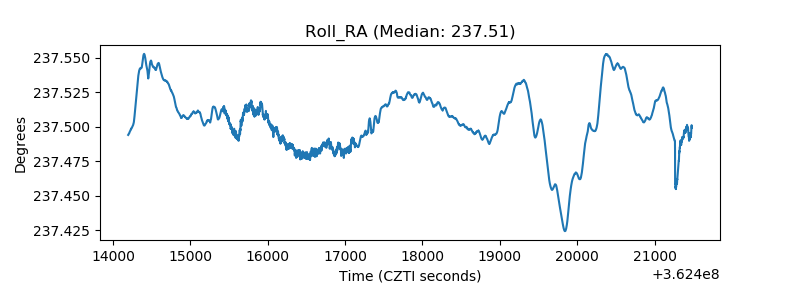 |
| Veto Counter | 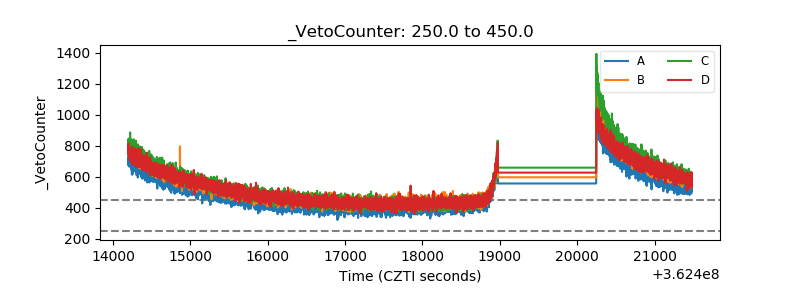 |