| Param | Original file | Final file |
|---|---|---|
| Filename | modeM0/AS1C06_002T01_9000004490_31065cztM0_level2.evt | modeM0/AS1C06_002T01_9000004490_31065cztM0_level2_quad_clean.evt |
| Size (bytes) | 547,462,080 | 112,144,320 |
| Size | 522.1 MB | 106.9 MB |
| Events in quadrant A | 3,018,280 | 751,870 |
| Events in quadrant B | 5,333,068 | 751,654 |
| Events in quadrant C | 3,419,135 | 747,291 |
| Events in quadrant D | 4,386,734 | 709,845 |
| Mode M0 | |||
|---|---|---|---|
| Quadrant | BADHDUFLAG | Total packets | Discarded packets |
| A | 0 | 13039 | 1 |
| B | 0 | 20228 | 2 |
| C | 0 | 14049 | 1 |
| D | 0 | 17340 | 1 |
| Mode M9 | |||
|---|---|---|---|
| Quadrant | BADHDUFLAG | Total packets | Discarded packets |
| A | 0 | 13 | 0 |
| B | 0 | 13 | 0 |
| C | 0 | 13 | 0 |
| D | 0 | 13 | 0 |
| Mode SS | |||
|---|---|---|---|
| Quadrant | BADHDUFLAG | Total packets | Discarded packets |
| A | 0 | 126 | 0 |
| B | 0 | 126 | 0 |
| C | 0 | 126 | 0 |
| D | 0 | 126 | 0 |
| Quadrant | Total seconds | Saturated seconds | Saturation percentage |
|---|---|---|---|
| A | 6247 | 12 | 0.192092% |
| B | 6247 | 129 | 2.064991% |
| C | 6247 | 147 | 2.353130% |
| D | 6247 | 131 | 2.097007% |
Noise dominated data is calculated using 1-second bins in cleaned event files. If a bin has >2000 counts, and if more than 50% of those come from <1% of pixels, then it is considered to be noise-dominated and hence unusable.
| Quadrant | # 1 sec bins | Bins with >0 counts | Bins with >2000 counts | High rate bins dominated by noise | Noise dominated (total time) | Noise dominated (detector-on time) | Marked lightcurve |
|---|---|---|---|---|---|---|---|
| A | 7517 | 6248 | 0 | 0 | 0.00% | 0.00% |  |
| B | 7517 | 6248 | 21 | 21 | 0.28% | 0.34% |  |
| C | 7517 | 6248 | 26 | 26 | 0.35% | 0.42% | 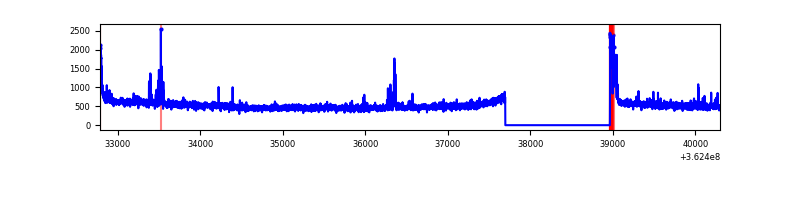 |
| D | 7517 | 6248 | 90 | 90 | 1.20% | 1.44% | 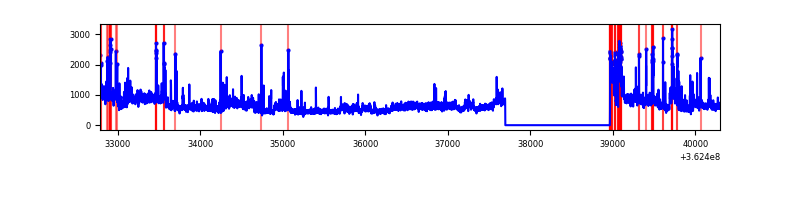 |
Top three noisy pixels from each quadrant. If the there are fewer than three noisy pixels in the level2.evt file, extra rows are filled as -1
| Pixel properties | Quadrant properties | ||||||
|---|---|---|---|---|---|---|---|
| Quadrant | DetID | PixID | Counts | Sigma | Mean | Median | Sigma |
| A | 13 | 254 | 13212 | 81.27 | 778 | 765 | 153.2 |
| A | 15 | 174 | 12805 | 78.61 | 778 | 765 | 153.2 |
| A | 3 | 137 | 7201 | 42.02 | 778 | 765 | 153.2 |
| B | 6 | 159 | 1926009 | 13472.9 | 779 | 760 | 142.9 |
| B | 0 | 183 | 179155 | 1248.41 | 779 | 760 | 142.9 |
| B | 4 | 67 | 34290 | 234.64 | 779 | 760 | 142.9 |
| C | 0 | 10 | 168706 | 938.76 | 768 | 774 | 178.9 |
| C | 14 | 238 | 124851 | 693.6 | 768 | 774 | 178.9 |
| C | 3 | 233 | 107251 | 595.22 | 768 | 774 | 178.9 |
| D | 8 | 195 | 998014 | 5539.25 | 758 | 738 | 180.0 |
| D | 13 | 249 | 262157 | 1452.02 | 758 | 738 | 180.0 |
| D | 13 | 174 | 77990 | 429.08 | 758 | 738 | 180.0 |
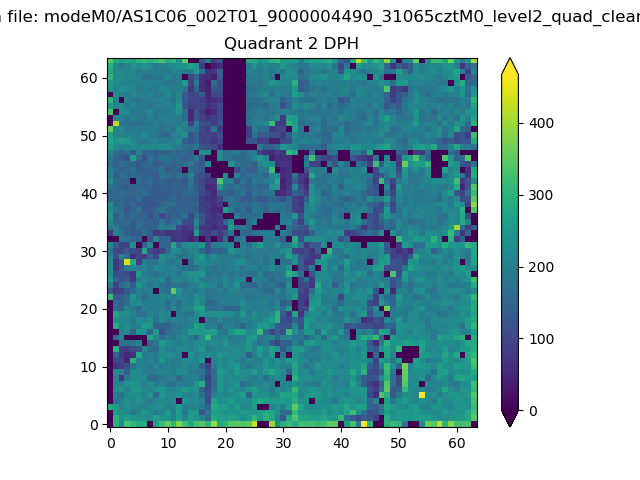
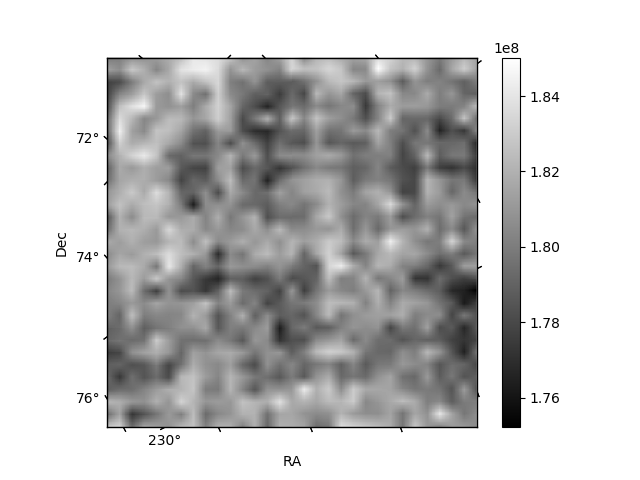
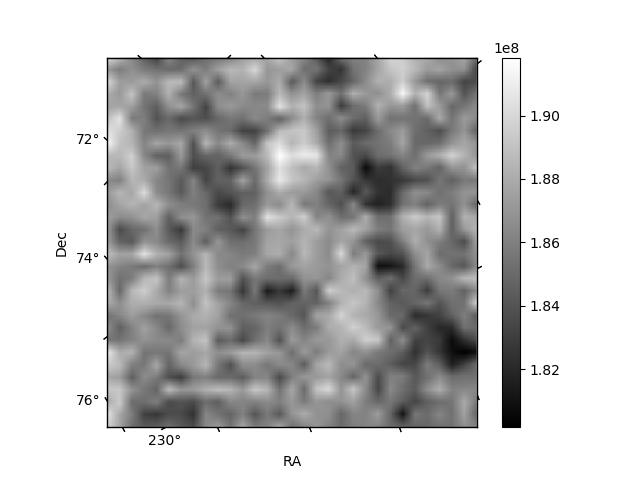
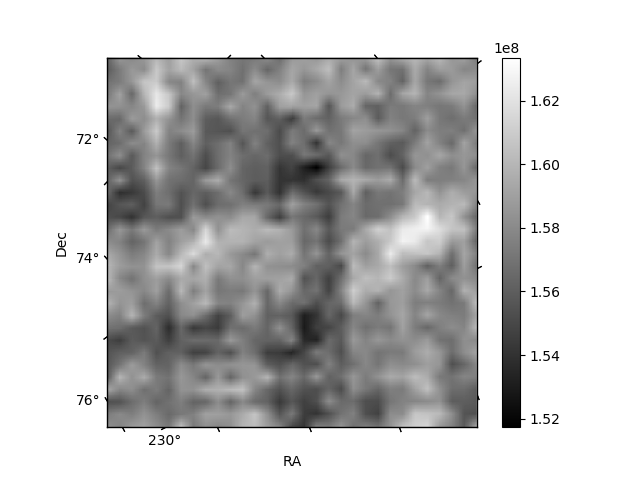
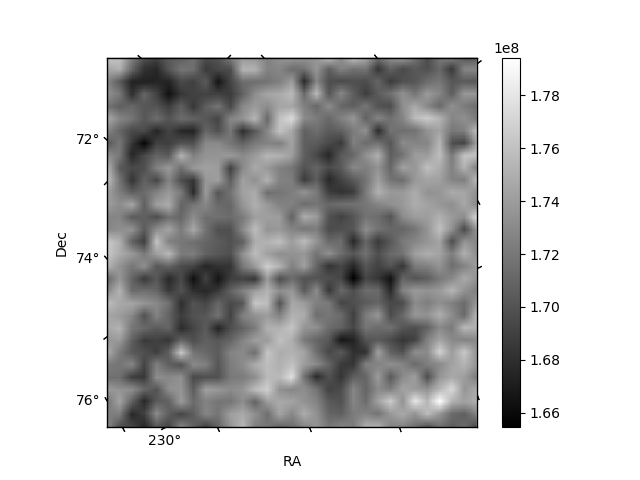
Histogram calculated using DETX and DETY for each event in the final _common_clean file
| Quadrant A | 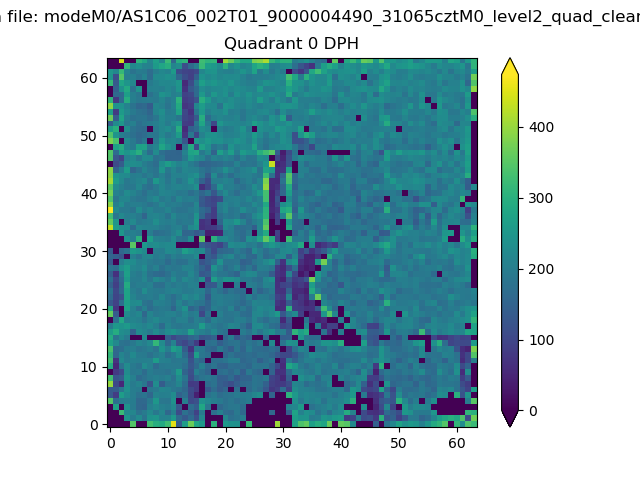 |
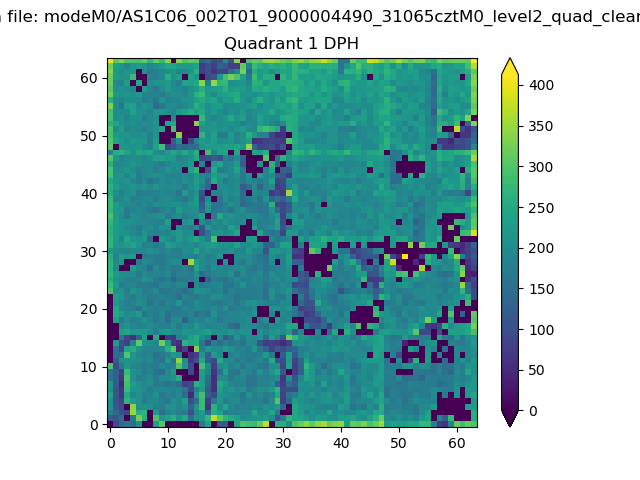 |
Quadrant B |
|---|---|---|---|
| Quadrant D | 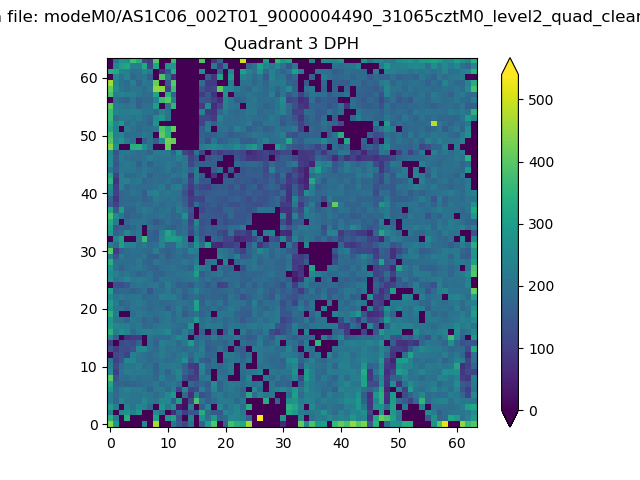 |
 |
Quadrant C |
| Plot type | Count rate plots | Images |
|---|---|---|
| Comparison with Poisson distribution Blue bars denote a histogram of data divided into 1 sec bins. Red curve is a Poisson curve with rate = median count rate of data. |
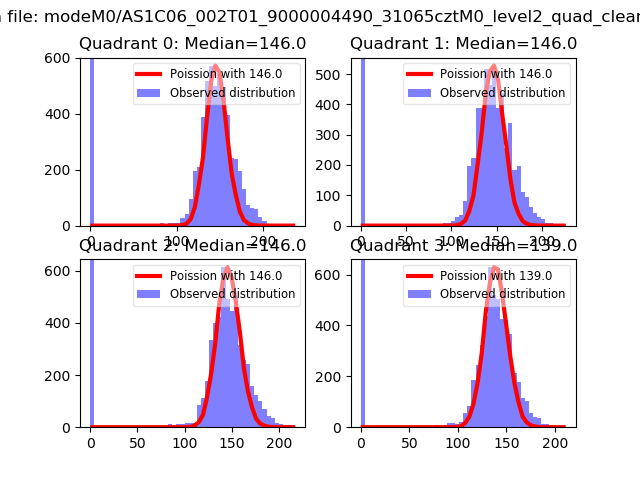 |
 |
| Quadrant-wise count rates Data is divided into 100 sec bins |
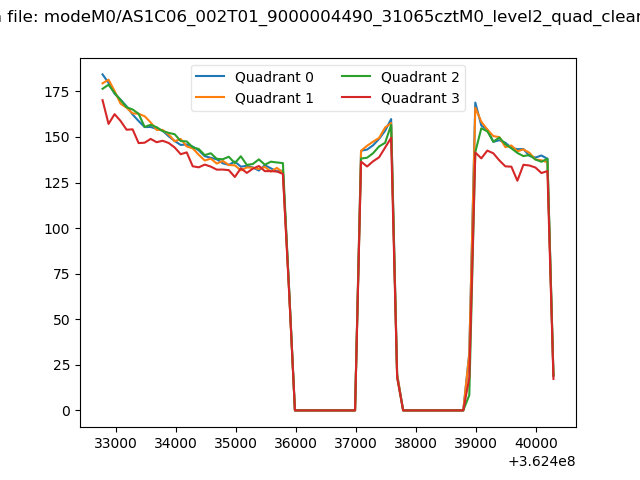 |
|
| Module-wise count rates for Quadrant A Data is divided into 100 sec bins |
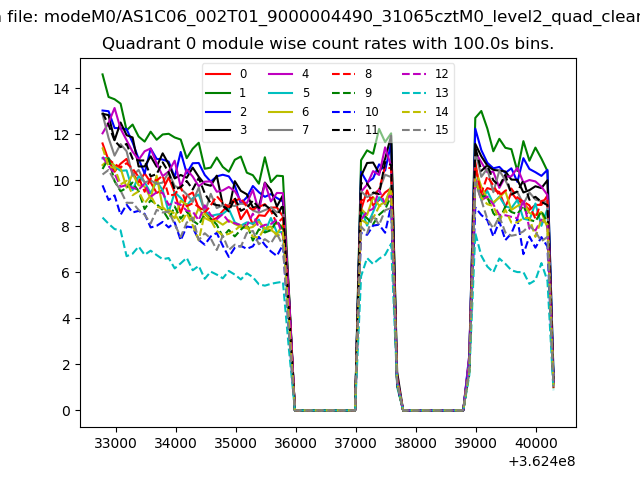 |
 |
| Module-wise count rates for Quadrant B Data is divided into 100 sec bins |
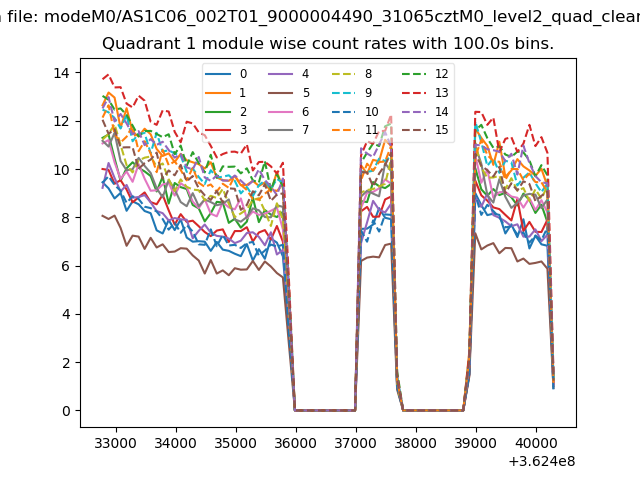 |
 |
| Module-wise count rates for Quadrant C Data is divided into 100 sec bins |
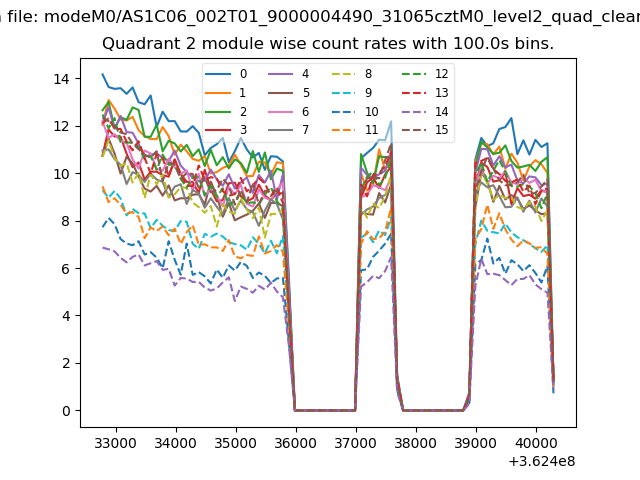 |
 |
| Module-wise count rates for Quadrant D Data is divided into 100 sec bins |
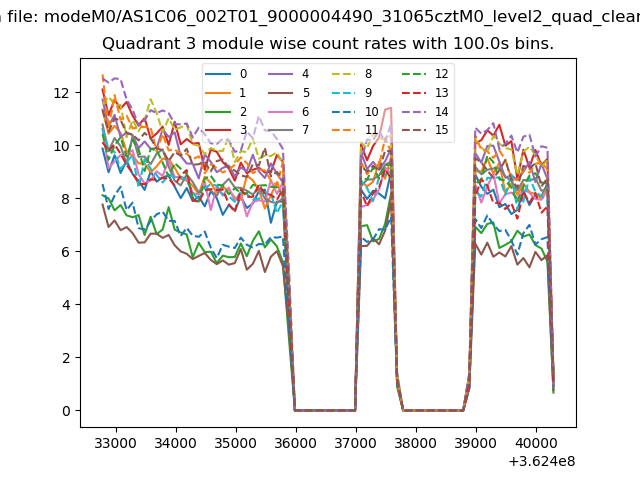 |
 |
| Parameter | Plot |
|---|---|
| CZT HV Monitor | 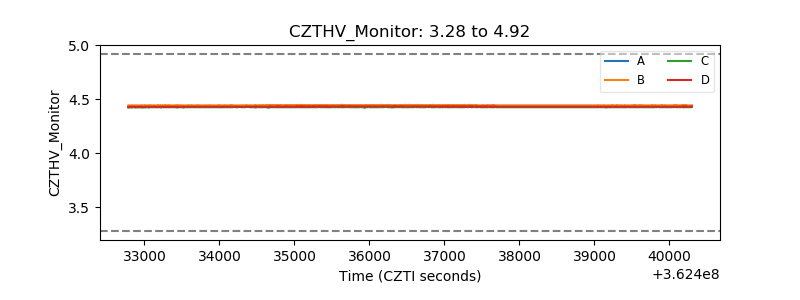 |
| D_VDD | 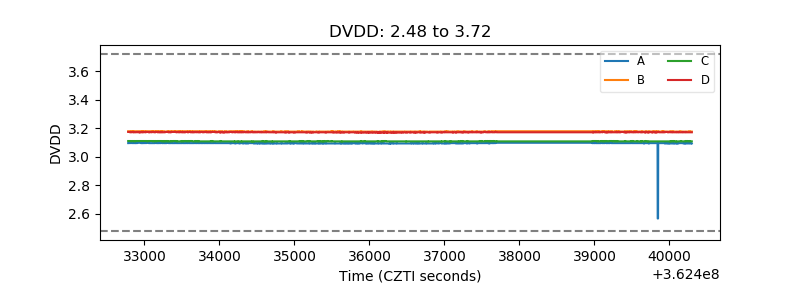 |
| Temperature 1 |  |
| Veto HV Monitor |  |
| Veto LLD | 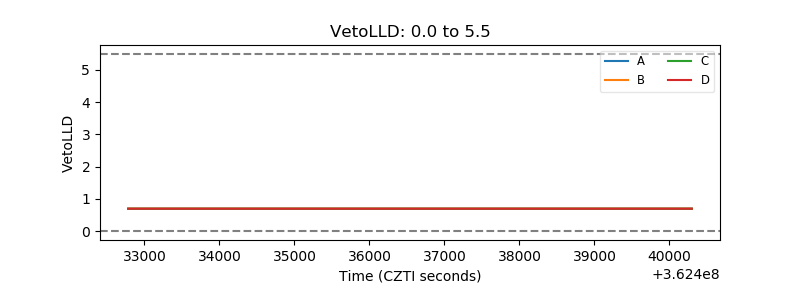 |
| Alpha Counter | 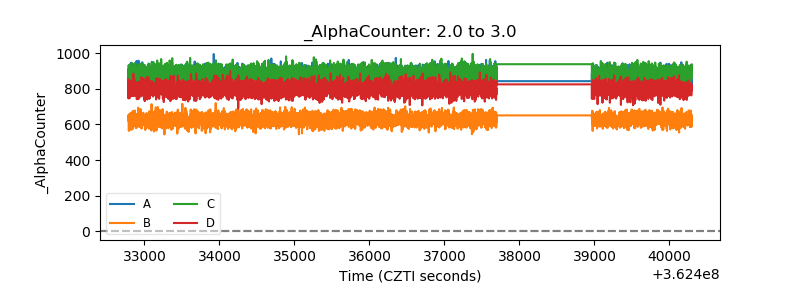 |
| _CPM_Rate | 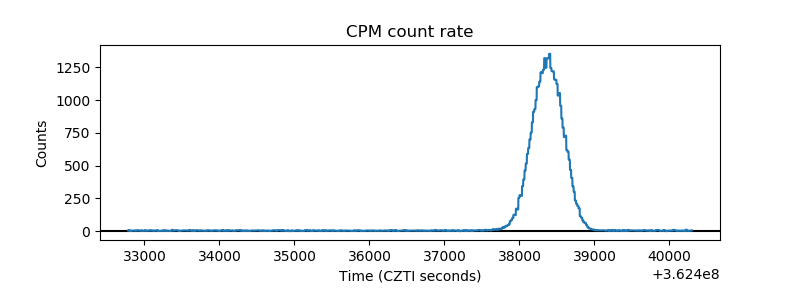 |
| CZT Counter | 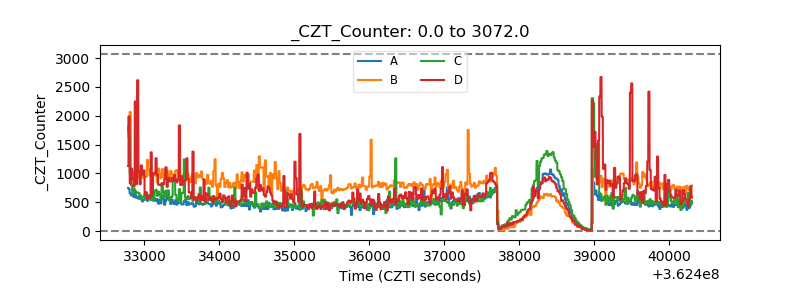 |
| +2.5 Volts monitor |  |
| +5 Volts monitor |  |
| _ROLL_ROT | 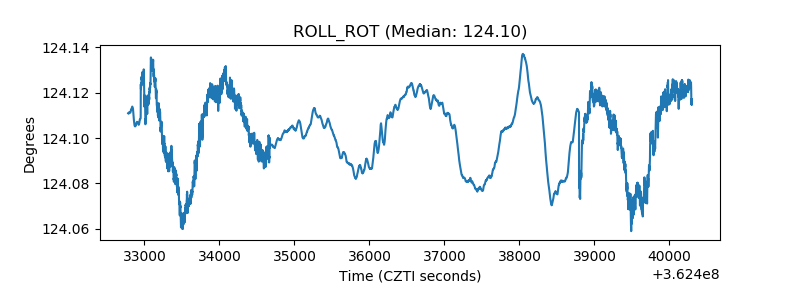 |
| _Roll_DEC | 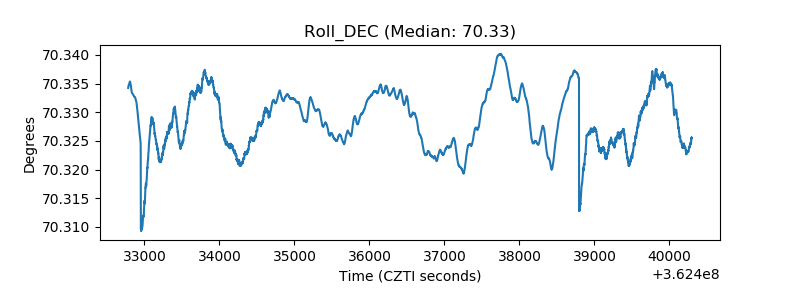 |
| _Roll_RA | 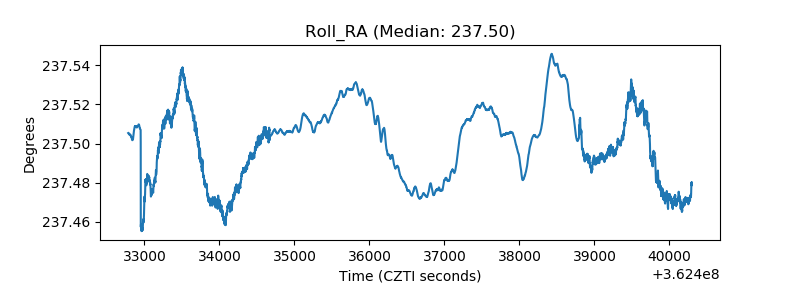 |
| Veto Counter | 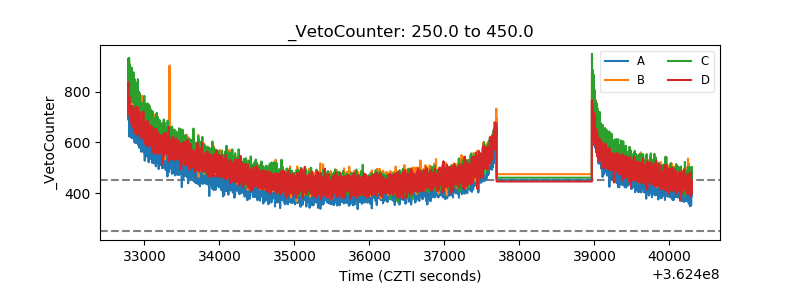 |