| Param | Original file | Final file |
|---|---|---|
| Filename | modeM0/AS1C06_002T01_9000004490_31066cztM0_level2.evt | modeM0/AS1C06_002T01_9000004490_31066cztM0_level2_quad_clean.evt |
| Size (bytes) | 547,053,120 | 112,040,640 |
| Size | 521.7 MB | 106.9 MB |
| Events in quadrant A | 3,070,979 | 750,459 |
| Events in quadrant B | 5,303,915 | 748,043 |
| Events in quadrant C | 3,438,144 | 730,395 |
| Events in quadrant D | 4,307,944 | 704,670 |
| Mode M0 | |||
|---|---|---|---|
| Quadrant | BADHDUFLAG | Total packets | Discarded packets |
| A | 0 | 13547 | 2 |
| B | 0 | 20439 | 2 |
| C | 0 | 14419 | 2 |
| D | 0 | 17141 | 2 |
| Mode M9 | |||
|---|---|---|---|
| Quadrant | BADHDUFLAG | Total packets | Discarded packets |
| A | 0 | 19 | 0 |
| B | 0 | 20 | 0 |
| C | 0 | 20 | 0 |
| D | 0 | 20 | 0 |
| Mode SS | |||
|---|---|---|---|
| Quadrant | BADHDUFLAG | Total packets | Discarded packets |
| A | 0 | 134 | 0 |
| B | 0 | 134 | 0 |
| C | 0 | 134 | 0 |
| D | 0 | 134 | 0 |
| Quadrant | Total seconds | Saturated seconds | Saturation percentage |
|---|---|---|---|
| A | 6589 | 22 | 0.333890% |
| B | 6589 | 126 | 1.912278% |
| C | 6589 | 193 | 2.929124% |
| D | 6589 | 154 | 2.337229% |
Noise dominated data is calculated using 1-second bins in cleaned event files. If a bin has >2000 counts, and if more than 50% of those come from <1% of pixels, then it is considered to be noise-dominated and hence unusable.
| Quadrant | # 1 sec bins | Bins with >0 counts | Bins with >2000 counts | High rate bins dominated by noise | Noise dominated (total time) | Noise dominated (detector-on time) | Marked lightcurve |
|---|---|---|---|---|---|---|---|
| A | 7534 | 6590 | 0 | 0 | 0.00% | 0.00% | 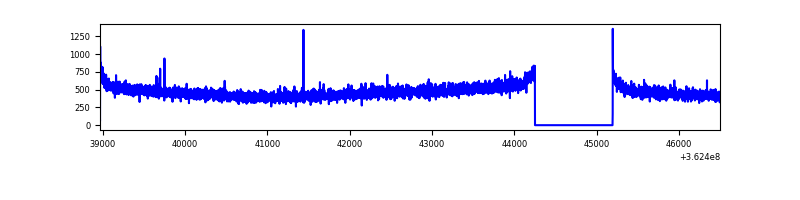 |
| B | 7534 | 6590 | 8 | 8 | 0.11% | 0.12% |  |
| C | 7534 | 6590 | 49 | 49 | 0.65% | 0.74% | 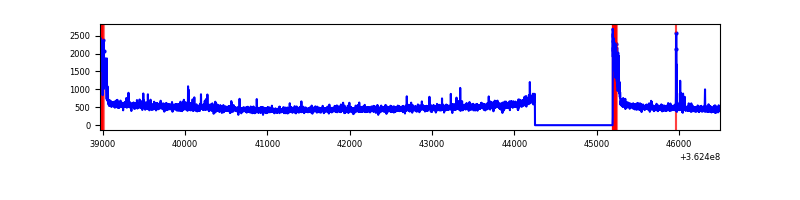 |
| D | 7534 | 6590 | 89 | 89 | 1.18% | 1.35% | 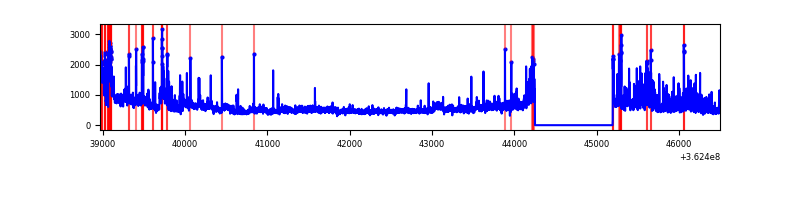 |
Top three noisy pixels from each quadrant. If the there are fewer than three noisy pixels in the level2.evt file, extra rows are filled as -1
| Pixel properties | Quadrant properties | ||||||
|---|---|---|---|---|---|---|---|
| Quadrant | DetID | PixID | Counts | Sigma | Mean | Median | Sigma |
| A | 13 | 254 | 12625 | 74.93 | 793 | 777 | 158.1 |
| A | 3 | 137 | 7683 | 43.68 | 793 | 777 | 158.1 |
| A | 0 | 226 | 6763 | 37.86 | 793 | 777 | 158.1 |
| B | 6 | 159 | 1949101 | 13236.68 | 792 | 772 | 147.2 |
| B | 0 | 183 | 57541 | 385.68 | 792 | 772 | 147.2 |
| B | 5 | 172 | 55394 | 371.09 | 792 | 772 | 147.2 |
| C | 0 | 10 | 269741 | 1515.12 | 769 | 774 | 177.5 |
| C | 14 | 238 | 124341 | 696.07 | 769 | 774 | 177.5 |
| C | 4 | 175 | 17853 | 96.21 | 769 | 774 | 177.5 |
| D | 8 | 195 | 812048 | 4499.0 | 766 | 747 | 180.3 |
| D | 13 | 249 | 355787 | 1968.84 | 766 | 747 | 180.3 |
| D | 13 | 174 | 120942 | 666.53 | 766 | 747 | 180.3 |
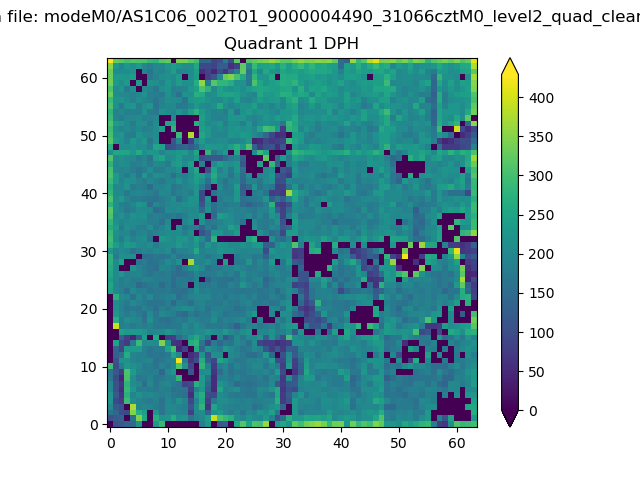
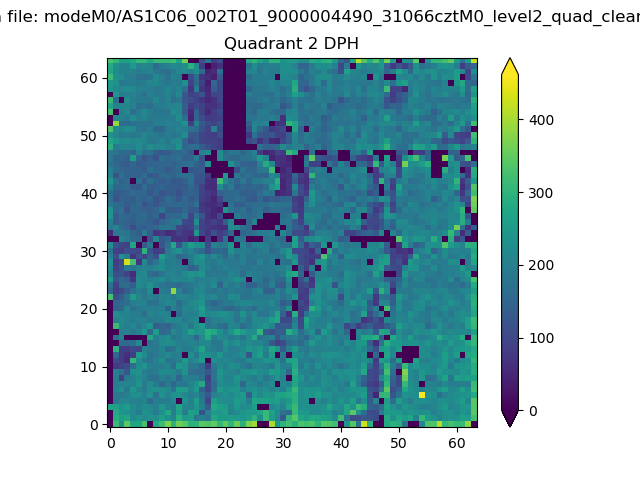
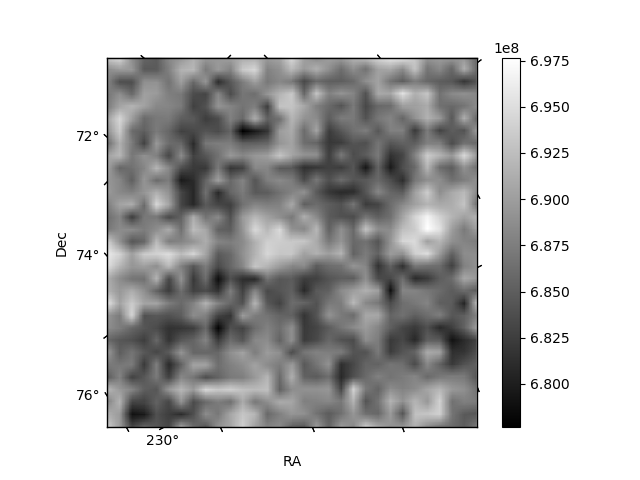
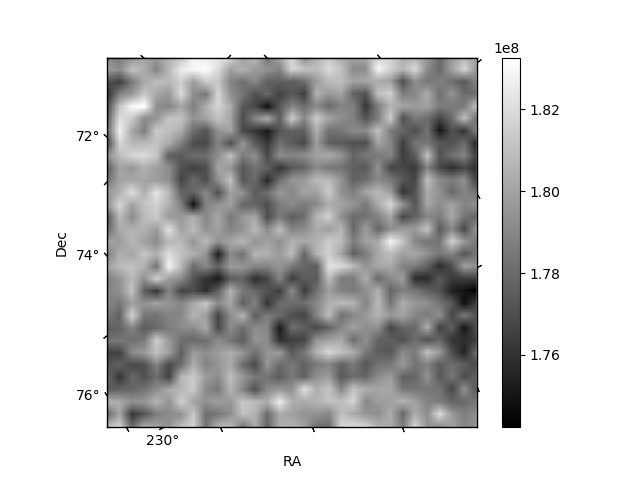
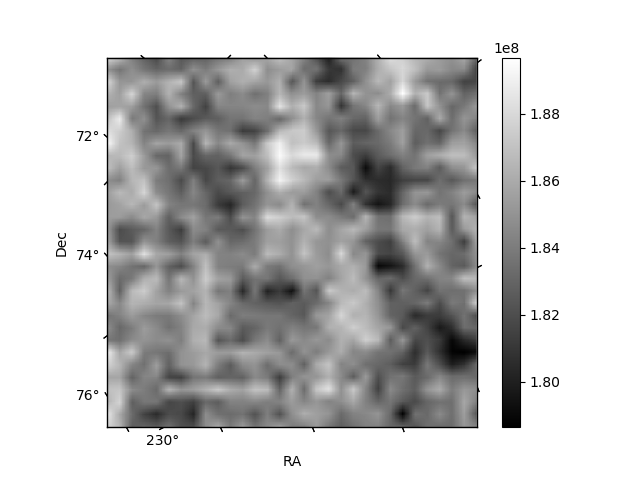
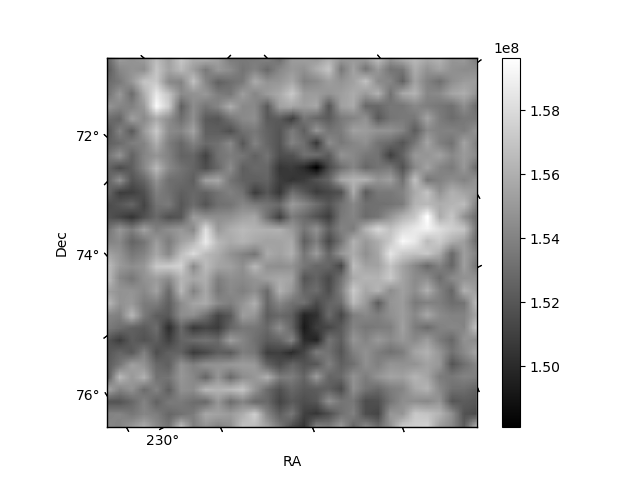
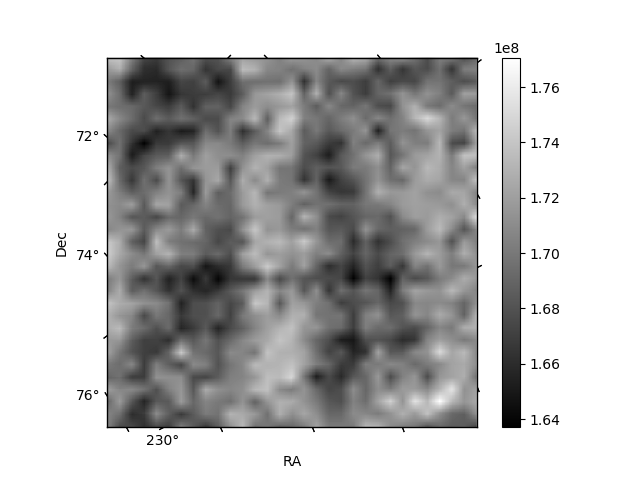
Histogram calculated using DETX and DETY for each event in the final _common_clean file
| Quadrant A | 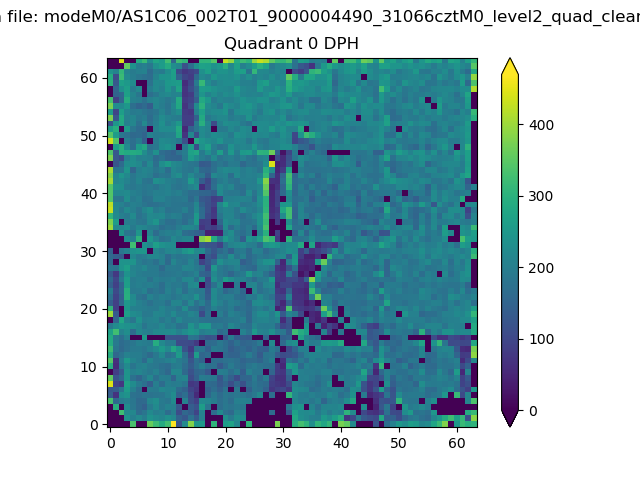 |
 |
Quadrant B |
|---|---|---|---|
| Quadrant D | 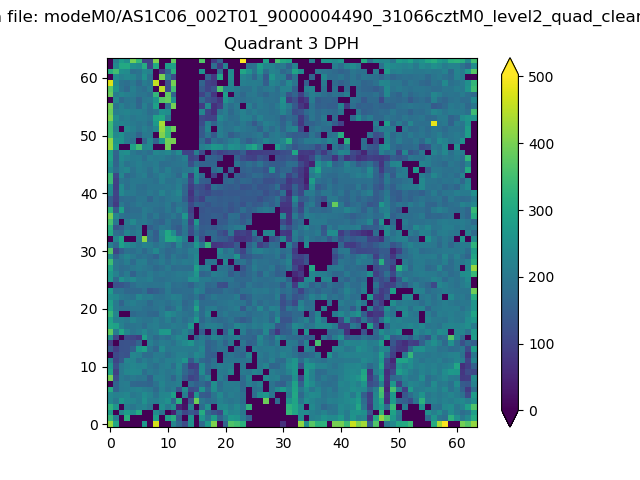 |
 |
Quadrant C |
| Plot type | Count rate plots | Images |
|---|---|---|
| Comparison with Poisson distribution Blue bars denote a histogram of data divided into 1 sec bins. Red curve is a Poisson curve with rate = median count rate of data. |
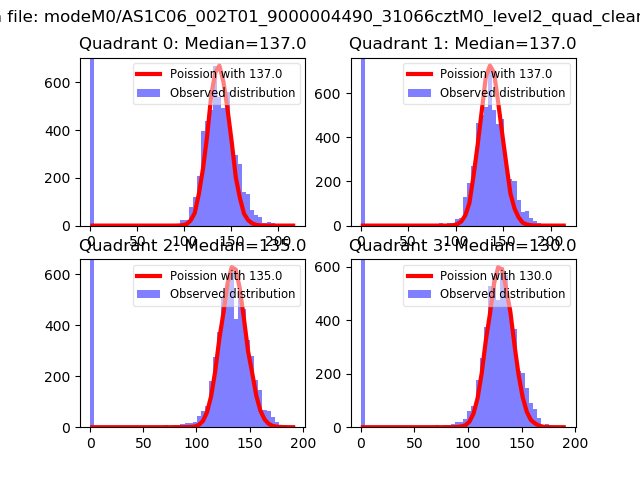 |
 |
| Quadrant-wise count rates Data is divided into 100 sec bins |
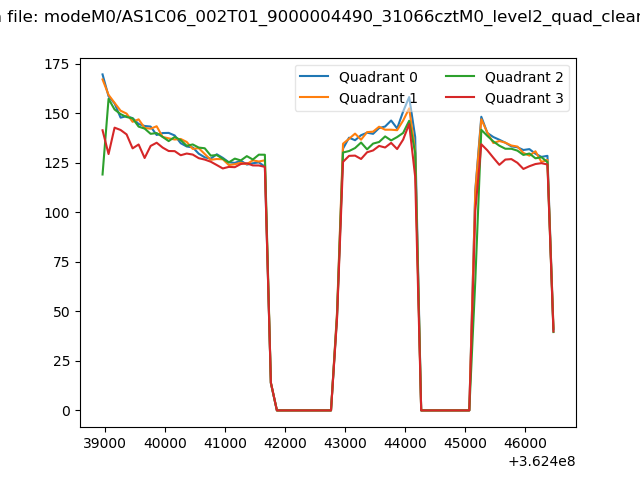 |
|
| Module-wise count rates for Quadrant A Data is divided into 100 sec bins |
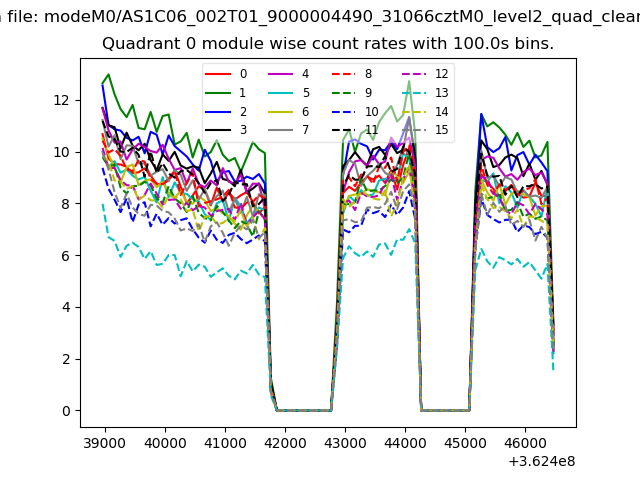 |
 |
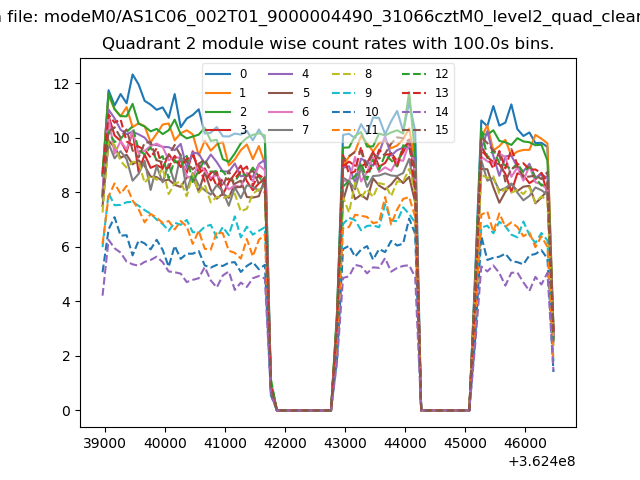
| Module-wise count rates for Quadrant B Data is divided into 100 sec bins |
 |
 |
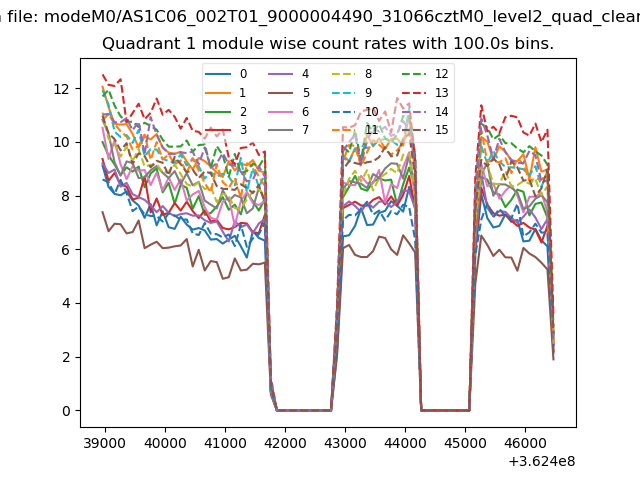
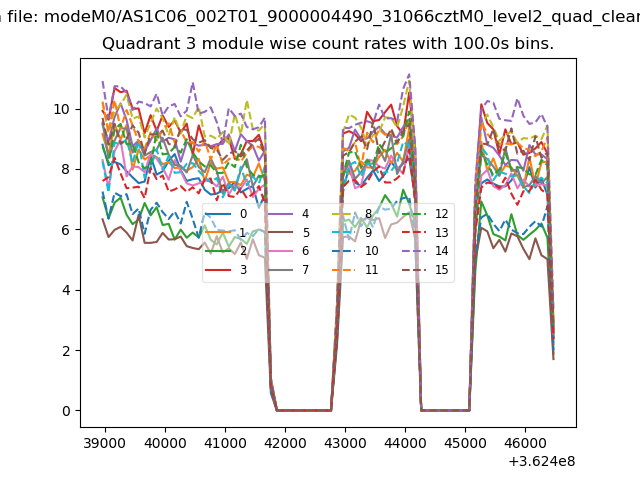
| Module-wise count rates for Quadrant C Data is divided into 100 sec bins |
 |
 |
| Module-wise count rates for Quadrant D Data is divided into 100 sec bins |
 |
 |
| Parameter | Plot |
|---|---|
| CZT HV Monitor | 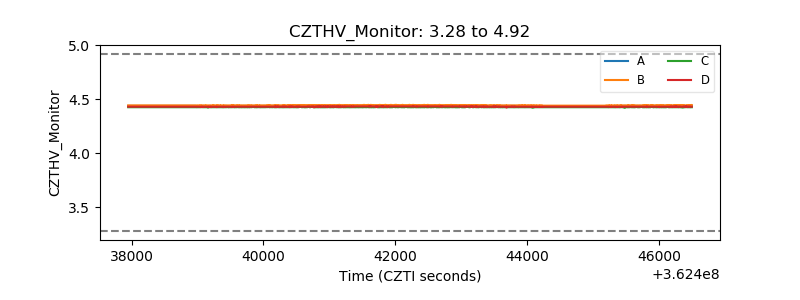 |
| D_VDD | 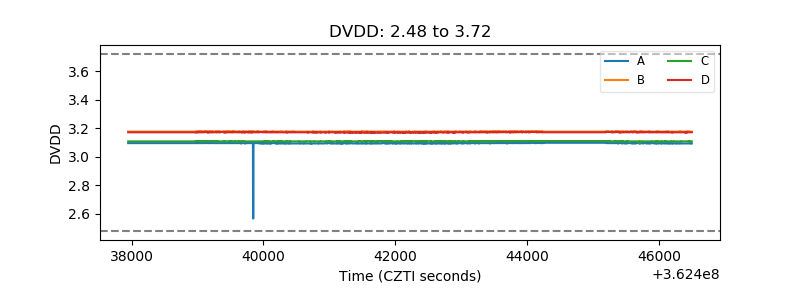 |
| Temperature 1 | 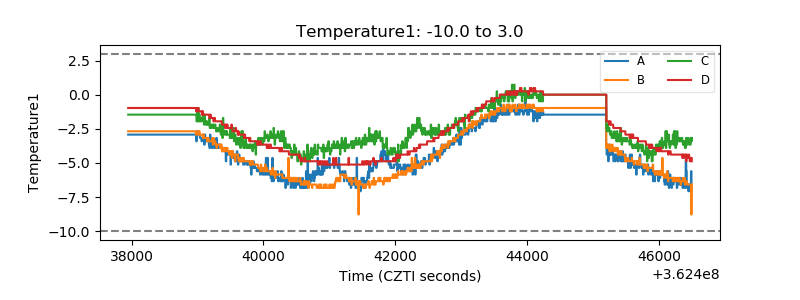 |
| Veto HV Monitor | 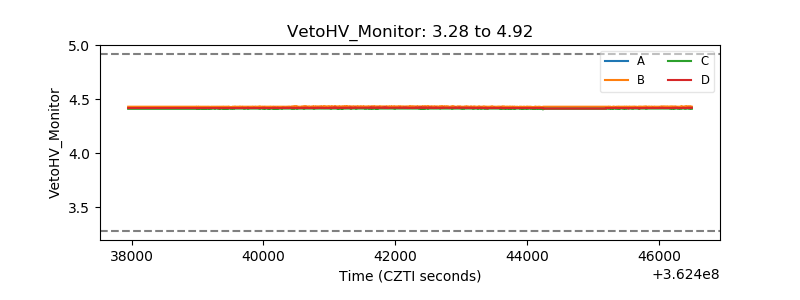 |
| Veto LLD | 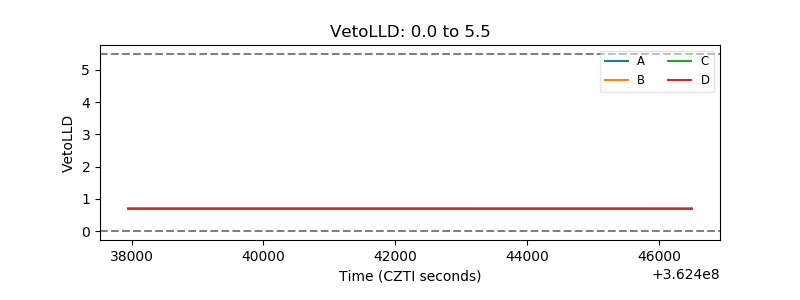 |
| Alpha Counter | 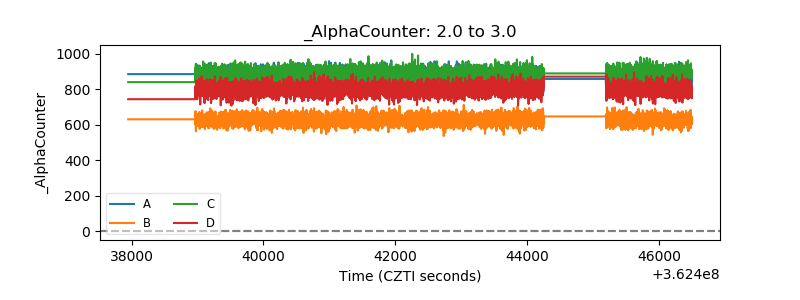 |
| _CPM_Rate | 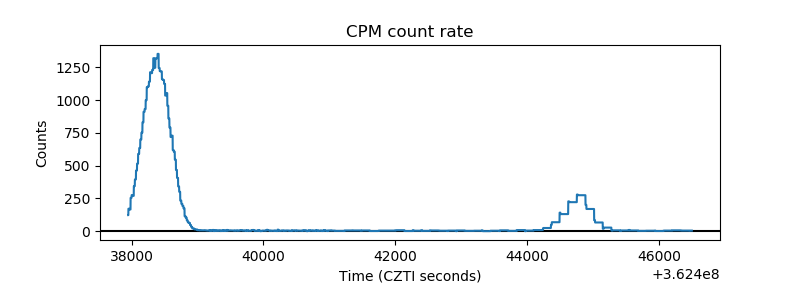 |
| CZT Counter | 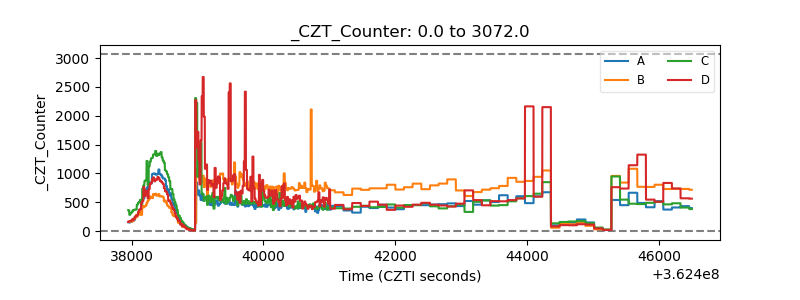 |
| +2.5 Volts monitor | 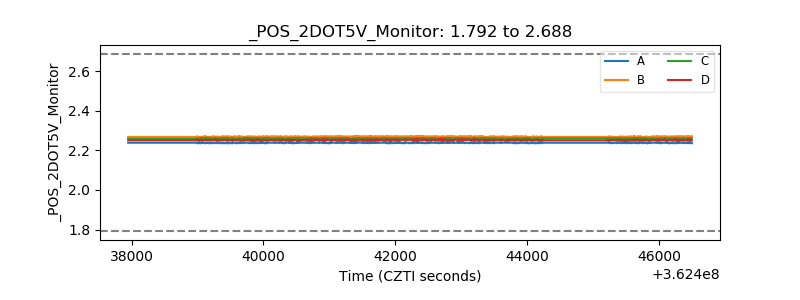 |
| +5 Volts monitor | 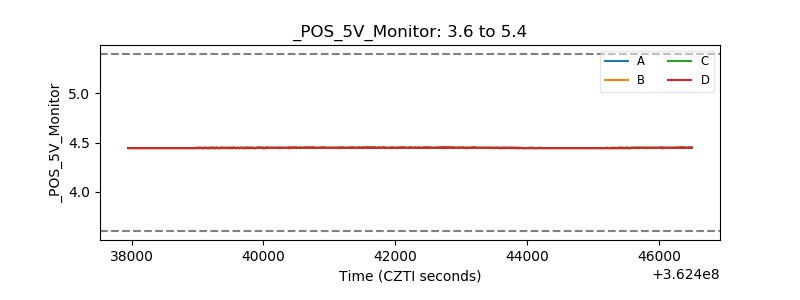 |
| _ROLL_ROT | 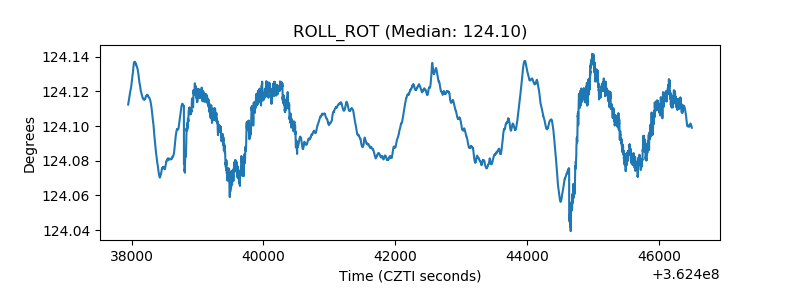 |
| _Roll_DEC | 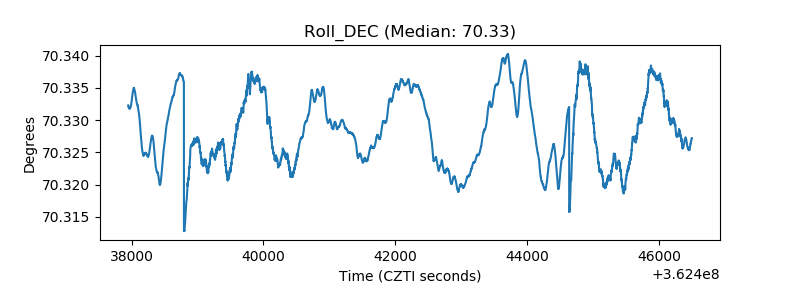 |
| _Roll_RA | 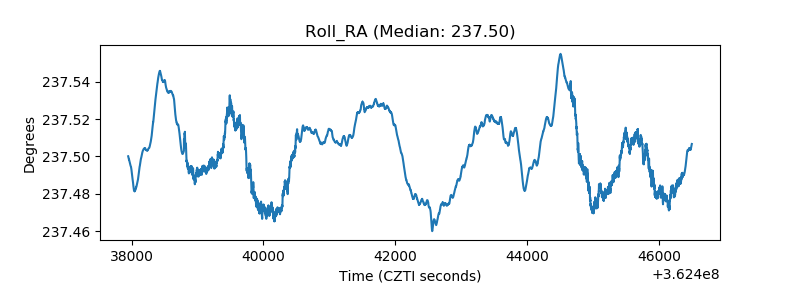 |
| Veto Counter | 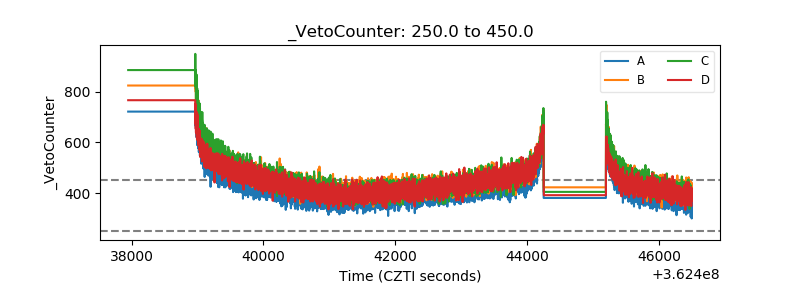 |