| Param | Original file | Final file |
|---|---|---|
| Filename | modeM0/AS1C06_002T01_9000004490_31067cztM0_level2.evt | modeM0/AS1C06_002T01_9000004490_31067cztM0_level2_quad_clean.evt |
| Size (bytes) | 596,367,360 | 122,685,120 |
| Size | 568.7 MB | 117.0 MB |
| Events in quadrant A | 3,384,201 | 822,192 |
| Events in quadrant B | 5,841,599 | 811,394 |
| Events in quadrant C | 3,729,077 | 799,042 |
| Events in quadrant D | 4,607,594 | 770,681 |
| Mode M0 | |||
|---|---|---|---|
| Quadrant | BADHDUFLAG | Total packets | Discarded packets |
| A | 0 | 15135 | 2 |
| B | 0 | 22859 | 3 |
| C | 0 | 15905 | 2 |
| D | 0 | 18732 | 2 |
| Mode M9 | |||
|---|---|---|---|
| Quadrant | BADHDUFLAG | Total packets | Discarded packets |
| A | 0 | 14 | 0 |
| B | 0 | 14 | 0 |
| C | 0 | 14 | 0 |
| D | 0 | 14 | 0 |
| Mode SS | |||
|---|---|---|---|
| Quadrant | BADHDUFLAG | Total packets | Discarded packets |
| A | 0 | 152 | 0 |
| B | 0 | 152 | 0 |
| C | 0 | 152 | 0 |
| D | 0 | 152 | 0 |
| Quadrant | Total seconds | Saturated seconds | Saturation percentage |
|---|---|---|---|
| A | 7359 | 23 | 0.312542% |
| B | 7359 | 194 | 2.636228% |
| C | 7359 | 186 | 2.527517% |
| D | 7359 | 195 | 2.649817% |
Noise dominated data is calculated using 1-second bins in cleaned event files. If a bin has >2000 counts, and if more than 50% of those come from <1% of pixels, then it is considered to be noise-dominated and hence unusable.
| Quadrant | # 1 sec bins | Bins with >0 counts | Bins with >2000 counts | High rate bins dominated by noise | Noise dominated (total time) | Noise dominated (detector-on time) | Marked lightcurve |
|---|---|---|---|---|---|---|---|
| A | 8834 | 7361 | 0 | 0 | 0.00% | 0.00% |  |
| B | 8834 | 7361 | 37 | 37 | 0.42% | 0.50% | 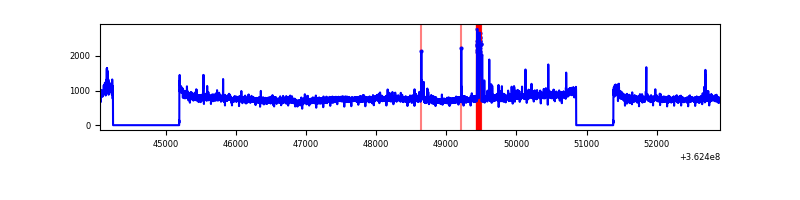 |
| C | 8834 | 7361 | 31 | 31 | 0.35% | 0.42% | 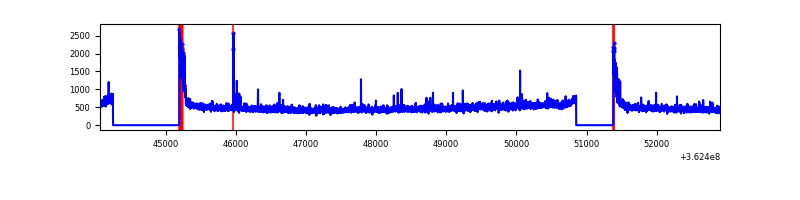 |
| D | 8834 | 7361 | 98 | 98 | 1.11% | 1.33% | 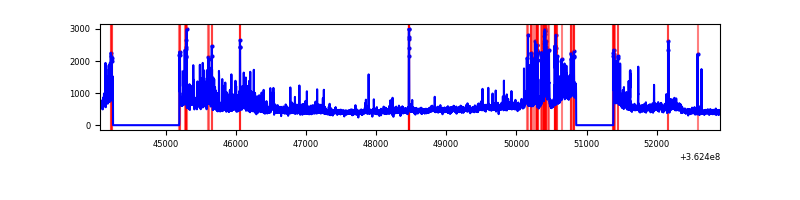 |
Top three noisy pixels from each quadrant. If the there are fewer than three noisy pixels in the level2.evt file, extra rows are filled as -1
| Pixel properties | Quadrant properties | ||||||
|---|---|---|---|---|---|---|---|
| Quadrant | DetID | PixID | Counts | Sigma | Mean | Median | Sigma |
| A | 13 | 254 | 13517 | 72.32 | 876 | 855 | 175.1 |
| A | 3 | 137 | 8795 | 45.35 | 876 | 855 | 175.1 |
| A | 0 | 226 | 7263 | 36.6 | 876 | 855 | 175.1 |
| B | 6 | 159 | 2165905 | 13294.63 | 870 | 848 | 162.9 |
| B | 5 | 172 | 137186 | 837.19 | 870 | 848 | 162.9 |
| B | 0 | 190 | 26081 | 154.94 | 870 | 848 | 162.9 |
| C | 0 | 10 | 224783 | 1119.3 | 851 | 855 | 200.1 |
| C | 14 | 238 | 134622 | 668.63 | 851 | 855 | 200.1 |
| C | 2 | 114 | 17836 | 84.88 | 851 | 855 | 200.1 |
| D | 8 | 195 | 715893 | 3586.19 | 846 | 825 | 199.4 |
| D | 13 | 249 | 431752 | 2161.17 | 846 | 825 | 199.4 |
| D | 13 | 174 | 92621 | 460.37 | 846 | 825 | 199.4 |
Histogram calculated using DETX and DETY for each event in the final _common_clean file
| Quadrant A | 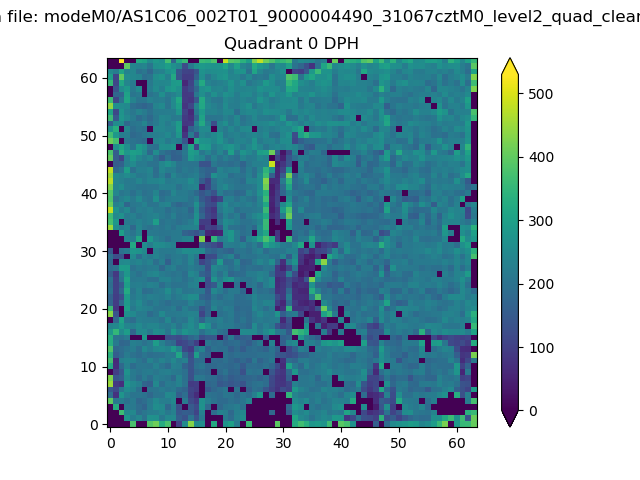 |
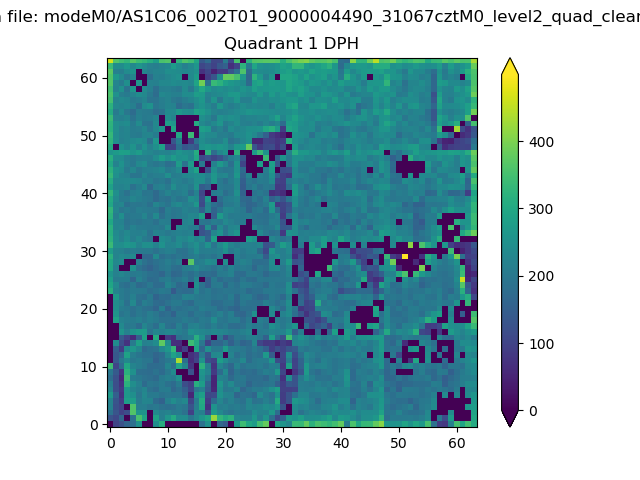 |
Quadrant B |
|---|---|---|---|
| Quadrant D | 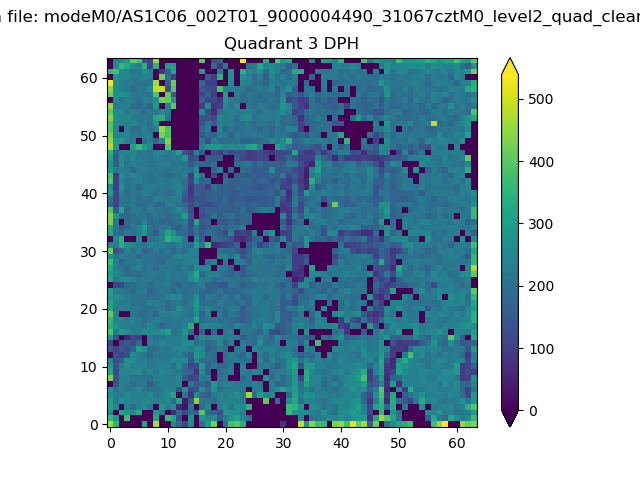 |
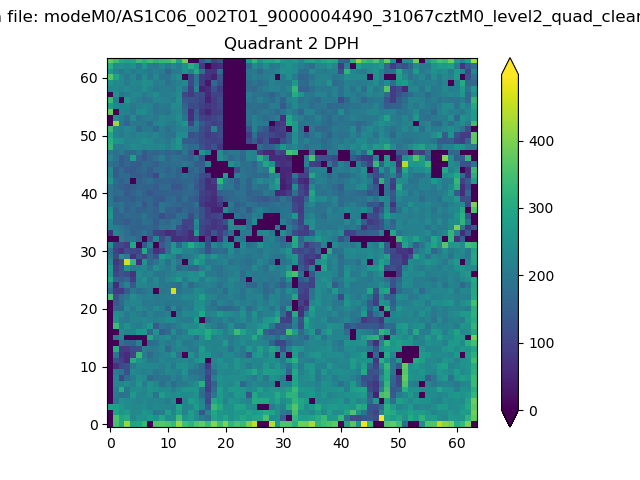 |
Quadrant C |
| Plot type | Count rate plots | Images |
|---|---|---|
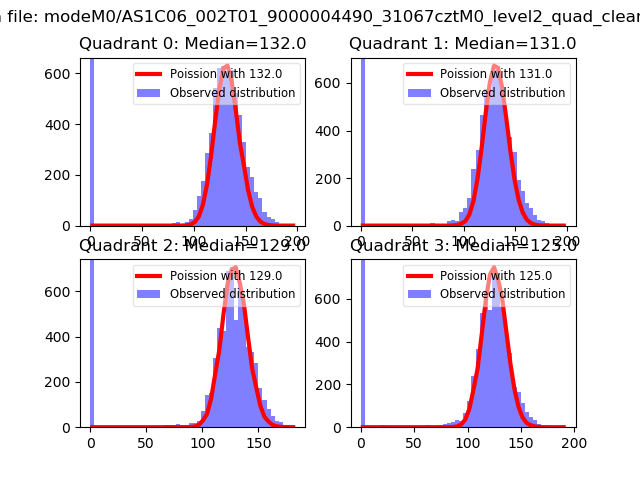
| Comparison with Poisson distribution Blue bars denote a histogram of data divided into 1 sec bins. Red curve is a Poisson curve with rate = median count rate of data. |
 |
 |
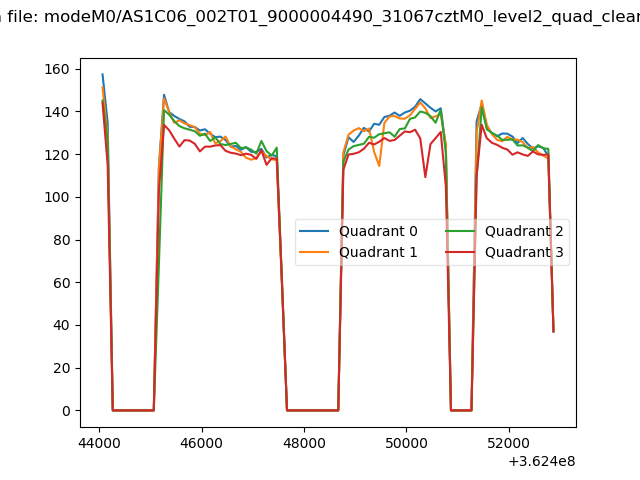
| Quadrant-wise count rates Data is divided into 100 sec bins |
 |
|
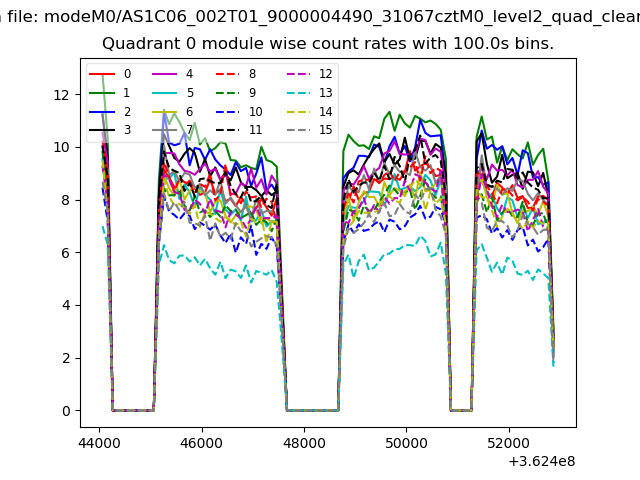
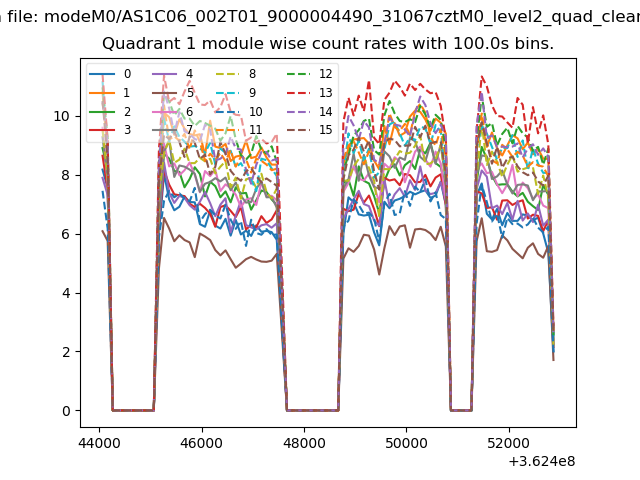
| Module-wise count rates for Quadrant A Data is divided into 100 sec bins |
 |
 |
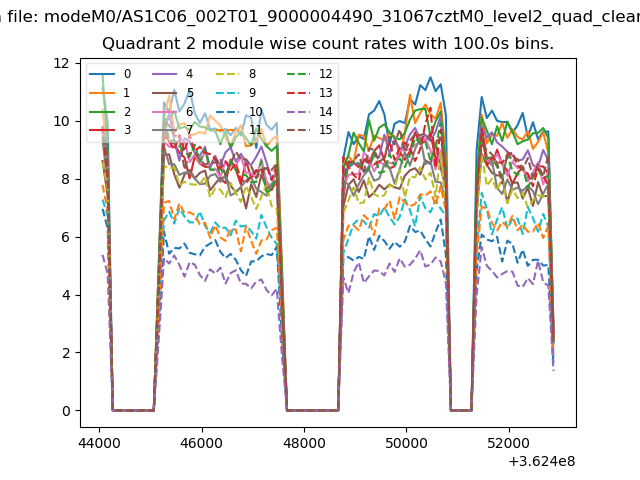
| Module-wise count rates for Quadrant B Data is divided into 100 sec bins |
 |
 |
| Module-wise count rates for Quadrant C Data is divided into 100 sec bins |
 |
 |
| Module-wise count rates for Quadrant D Data is divided into 100 sec bins |
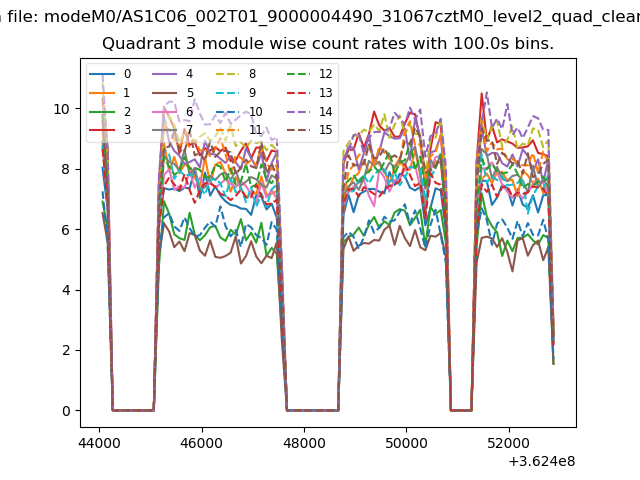 |
 |
| Parameter | Plot |
|---|---|
| CZT HV Monitor | 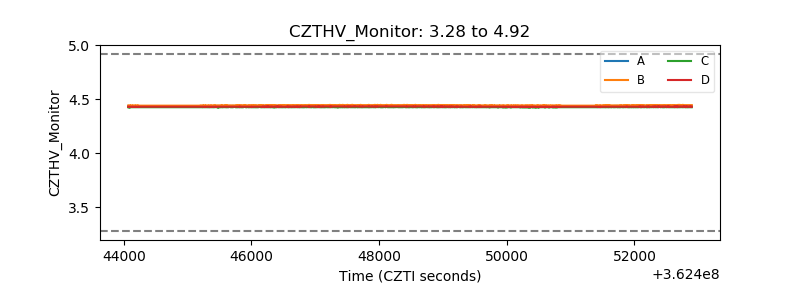 |
| D_VDD | 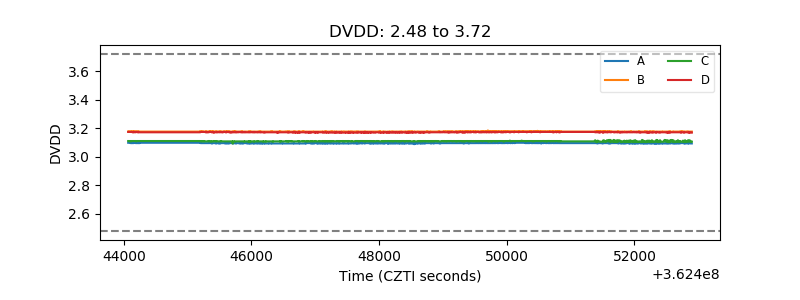 |
| Temperature 1 | 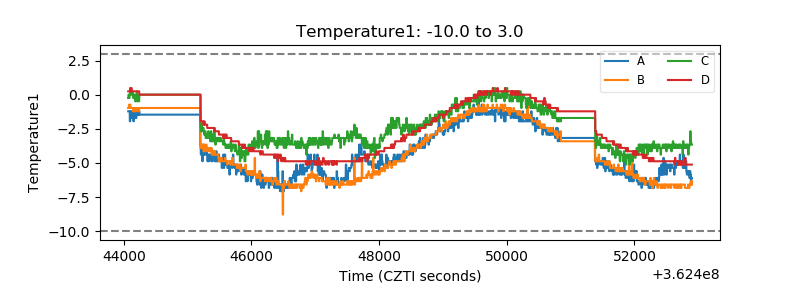 |
| Veto HV Monitor |  |
| Veto LLD | 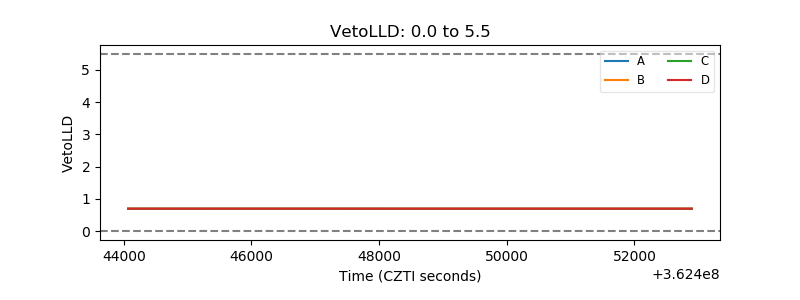 |
| Alpha Counter | 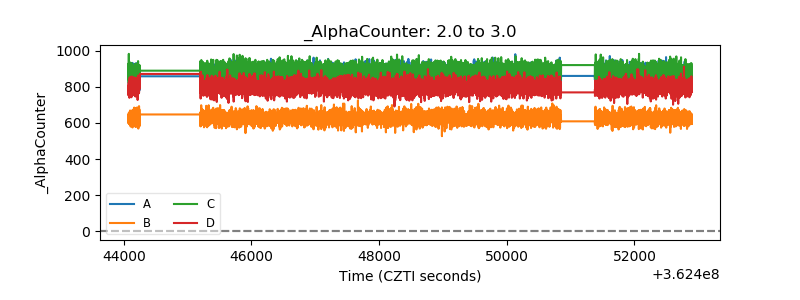 |
| _CPM_Rate | 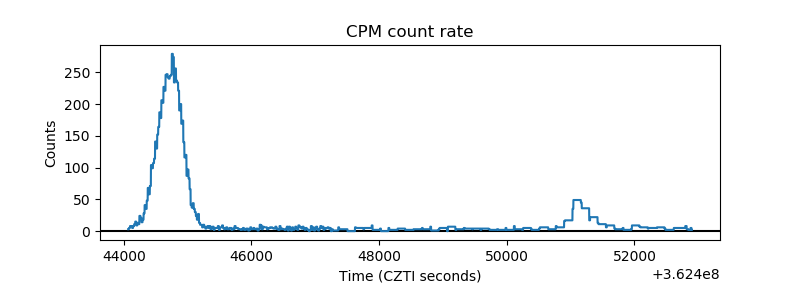 |
| CZT Counter | 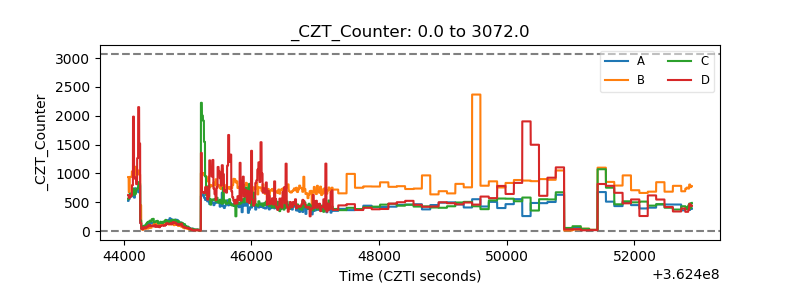 |
| +2.5 Volts monitor |  |
| +5 Volts monitor |  |
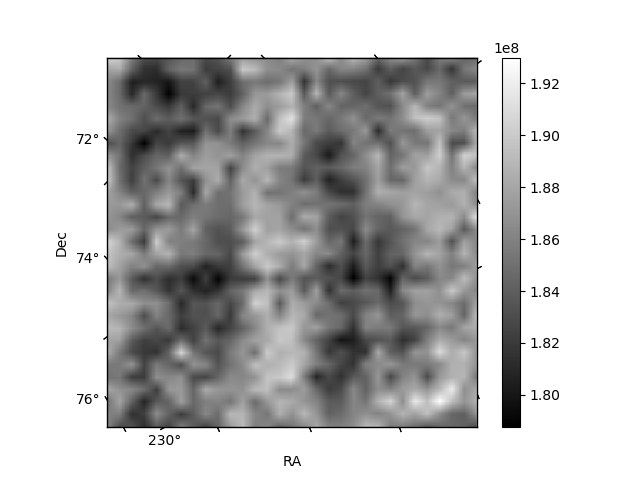
| _ROLL_ROT | 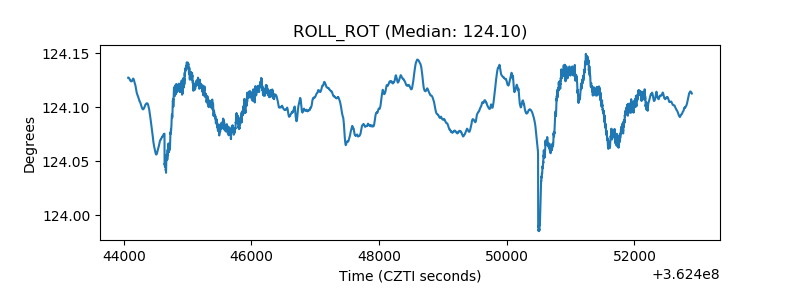 |
| _Roll_DEC | 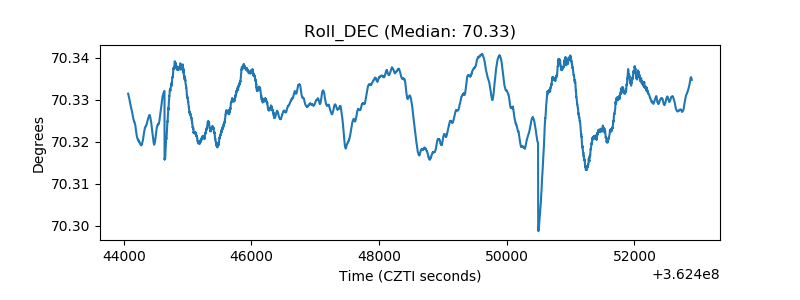 |
| _Roll_RA | 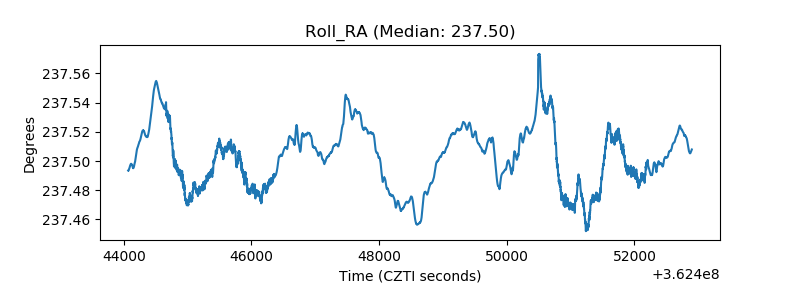 |
| Veto Counter | 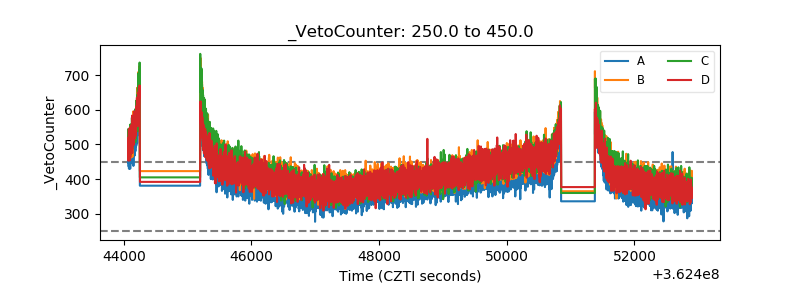 |