| Param | Original file | Final file |
|---|---|---|
| Filename | modeM0/AS1C06_002T01_9000004490_31068cztM0_level2.evt | modeM0/AS1C06_002T01_9000004490_31068cztM0_level2_quad_clean.evt |
| Size (bytes) | 679,121,280 | 138,579,840 |
| Size | 647.7 MB | 132.2 MB |
| Events in quadrant A | 3,840,114 | 930,324 |
| Events in quadrant B | 6,482,356 | 920,891 |
| Events in quadrant C | 4,091,909 | 908,944 |
| Events in quadrant D | 5,592,620 | 861,882 |
| Mode M0 | |||
|---|---|---|---|
| Quadrant | BADHDUFLAG | Total packets | Discarded packets |
| A | 0 | 17085 | 2 |
| B | 0 | 25315 | 2 |
| C | 0 | 17603 | 2 |
| D | 0 | 22305 | 2 |
| Mode M9 | |||
|---|---|---|---|
| Quadrant | BADHDUFLAG | Total packets | Discarded packets |
| A | 0 | 7 | 0 |
| B | 0 | 7 | 0 |
| C | 0 | 7 | 0 |
| D | 0 | 7 | 0 |
| Mode SS | |||
|---|---|---|---|
| Quadrant | BADHDUFLAG | Total packets | Discarded packets |
| A | 0 | 170 | 0 |
| B | 0 | 170 | 0 |
| C | 0 | 170 | 0 |
| D | 0 | 170 | 0 |
| Quadrant | Total seconds | Saturated seconds | Saturation percentage |
|---|---|---|---|
| A | 8284 | 72 | 0.869145% |
| B | 8284 | 249 | 3.005794% |
| C | 8285 | 203 | 2.450211% |
| D | 8285 | 405 | 4.888352% |
Noise dominated data is calculated using 1-second bins in cleaned event files. If a bin has >2000 counts, and if more than 50% of those come from <1% of pixels, then it is considered to be noise-dominated and hence unusable.
| Quadrant | # 1 sec bins | Bins with >0 counts | Bins with >2000 counts | High rate bins dominated by noise | Noise dominated (total time) | Noise dominated (detector-on time) | Marked lightcurve |
|---|---|---|---|---|---|---|---|
| A | 8934 | 8288 | 0 | 0 | 0.00% | 0.00% | 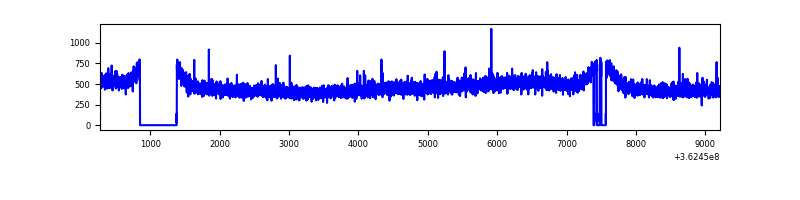 |
| B | 8934 | 8288 | 4 | 4 | 0.04% | 0.05% | 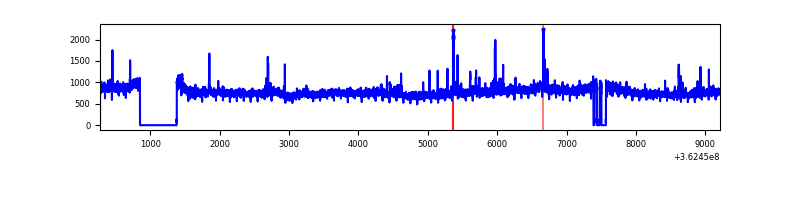 |
| C | 8935 | 8289 | 6 | 6 | 0.07% | 0.07% | 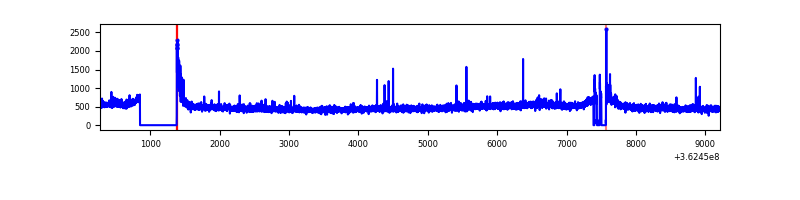 |
| D | 8935 | 8289 | 266 | 266 | 2.98% | 3.21% | 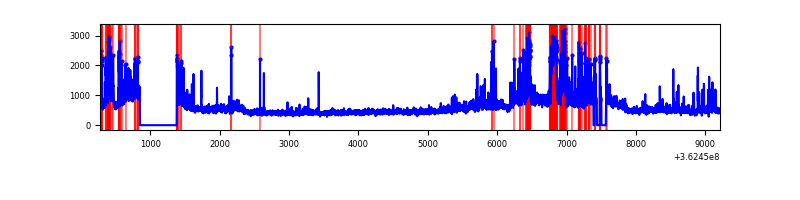 |
Top three noisy pixels from each quadrant. If the there are fewer than three noisy pixels in the level2.evt file, extra rows are filled as -1
| Pixel properties | Quadrant properties | ||||||
|---|---|---|---|---|---|---|---|
| Quadrant | DetID | PixID | Counts | Sigma | Mean | Median | Sigma |
| A | 13 | 254 | 15439 | 72.73 | 994 | 971 | 198.9 |
| A | 3 | 137 | 10035 | 45.56 | 994 | 971 | 198.9 |
| A | 0 | 226 | 8203 | 36.35 | 994 | 971 | 198.9 |
| B | 6 | 159 | 2431230 | 13086.75 | 988 | 962 | 185.7 |
| B | 5 | 172 | 47750 | 251.95 | 988 | 962 | 185.7 |
| B | 0 | 190 | 28039 | 145.81 | 988 | 962 | 185.7 |
| C | 14 | 238 | 153275 | 671.79 | 964 | 967 | 226.7 |
| C | 0 | 10 | 126692 | 554.54 | 964 | 967 | 226.7 |
| C | 2 | 114 | 19706 | 82.65 | 964 | 967 | 226.7 |
| D | 8 | 195 | 872307 | 3860.77 | 946 | 920 | 225.7 |
| D | 13 | 249 | 863929 | 3823.65 | 946 | 920 | 225.7 |
| D | 13 | 174 | 95228 | 417.84 | 946 | 920 | 225.7 |
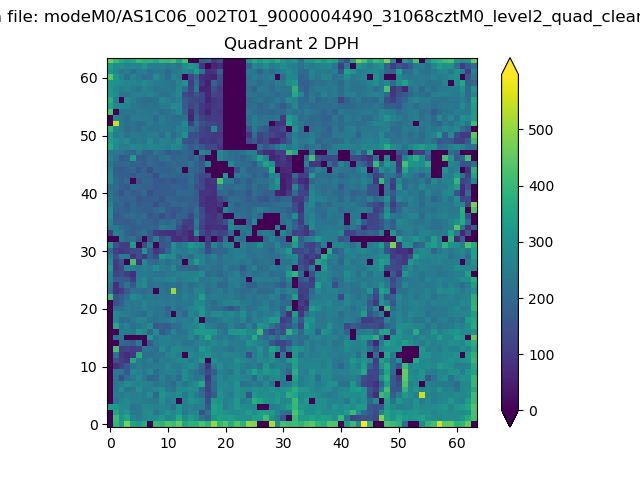
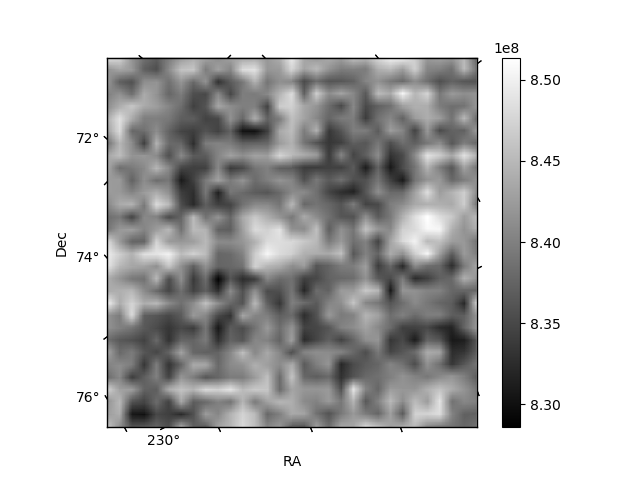
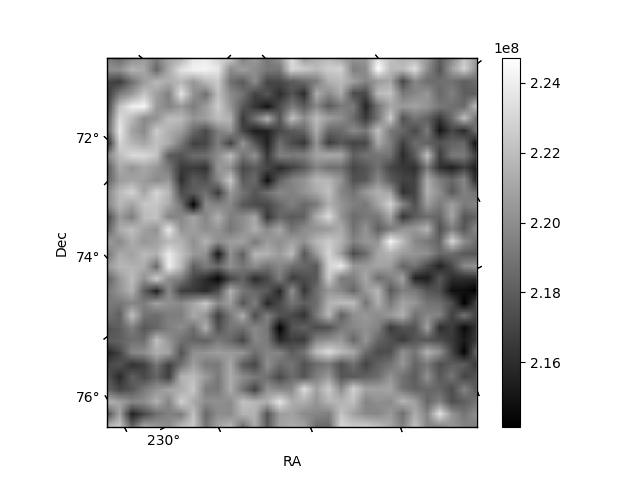
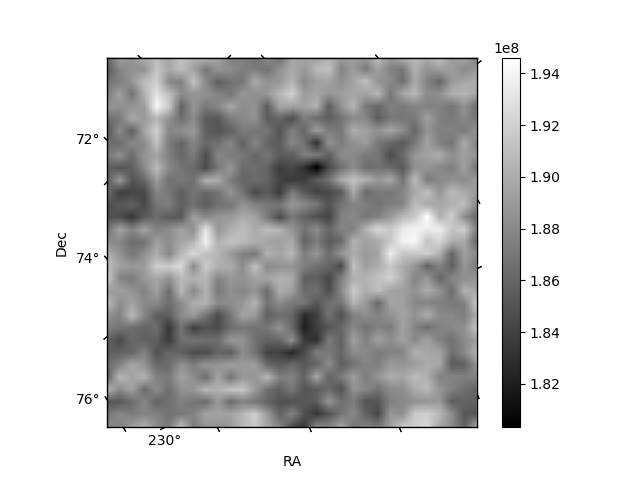
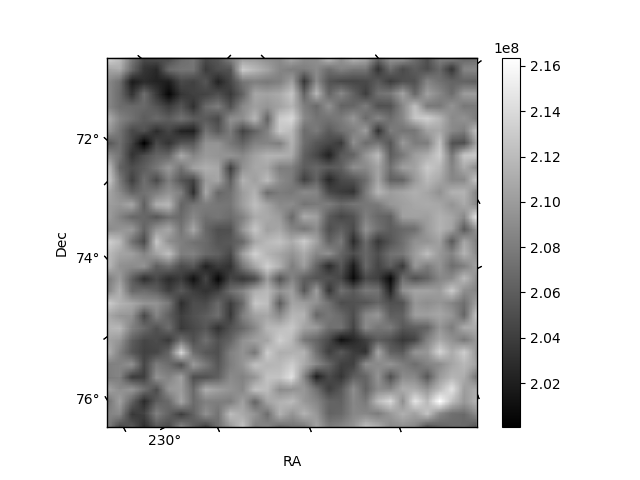
Histogram calculated using DETX and DETY for each event in the final _common_clean file
| Quadrant A | 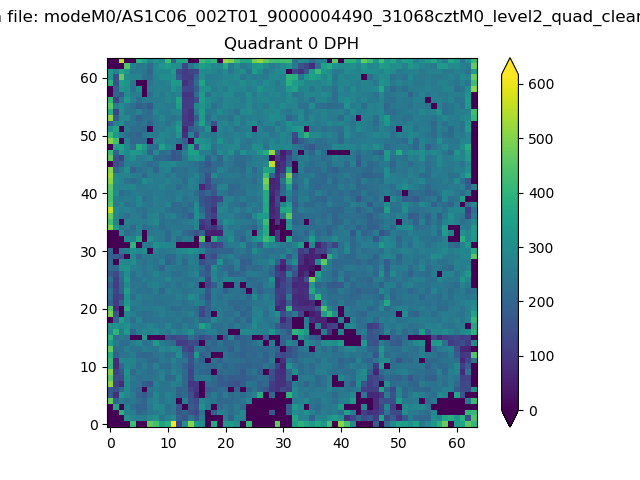 |
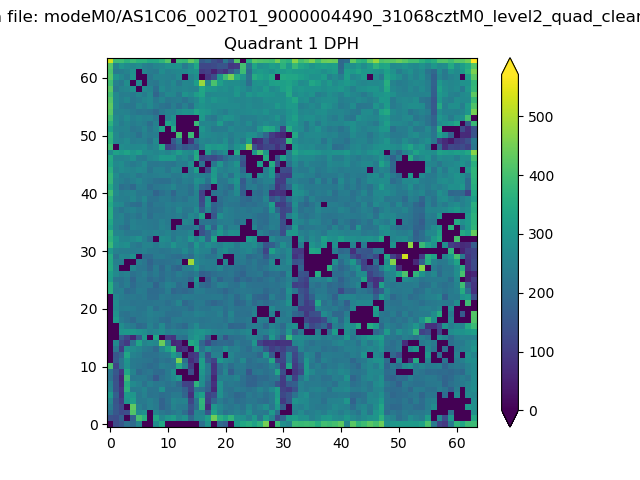 |
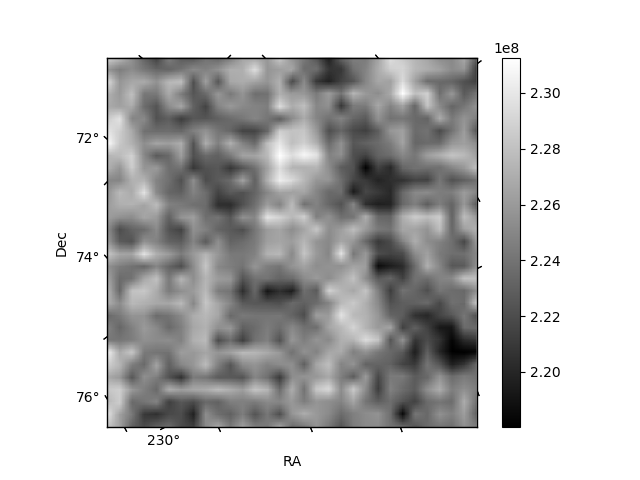
Quadrant B |
|---|---|---|---|
| Quadrant D | 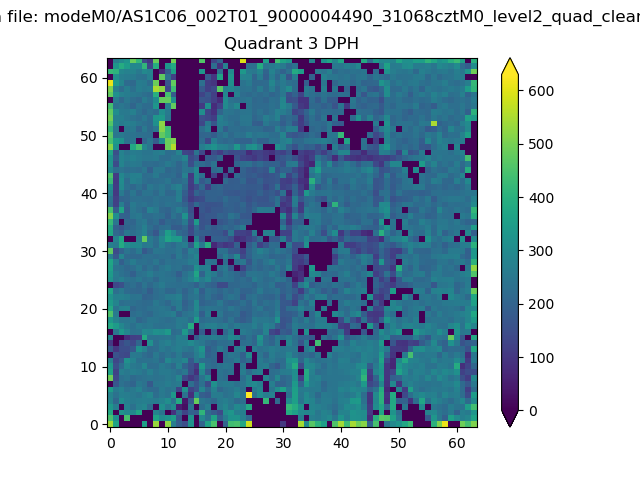 |
 |
Quadrant C |
| Plot type | Count rate plots | Images |
|---|---|---|
| Comparison with Poisson distribution Blue bars denote a histogram of data divided into 1 sec bins. Red curve is a Poisson curve with rate = median count rate of data. |
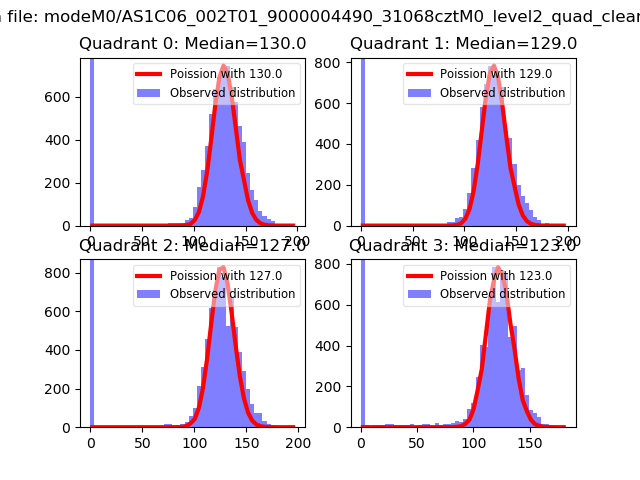 |
 |
| Quadrant-wise count rates Data is divided into 100 sec bins |
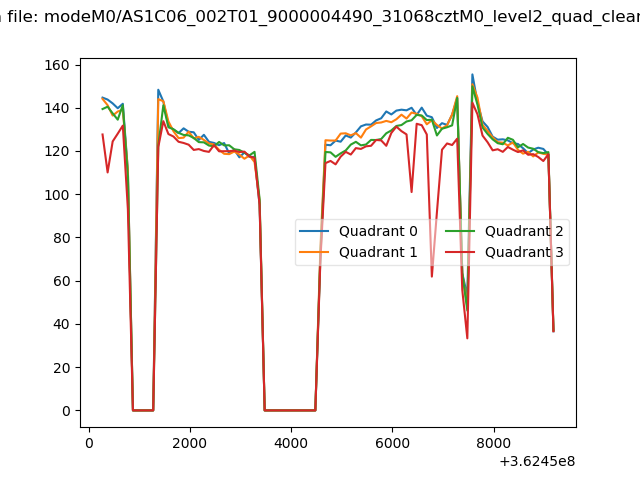 |
|
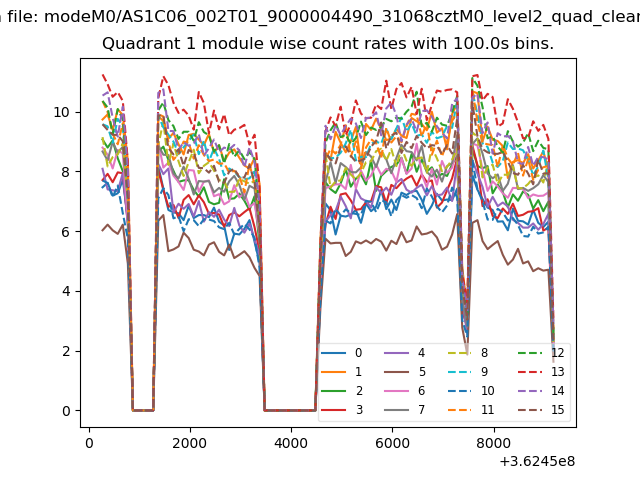
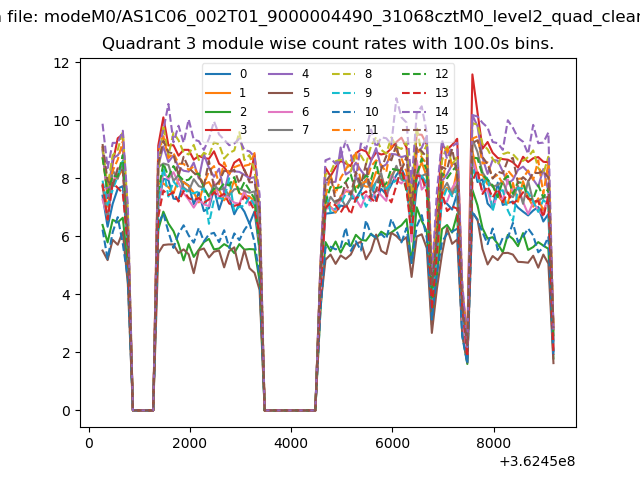
| Module-wise count rates for Quadrant A Data is divided into 100 sec bins |
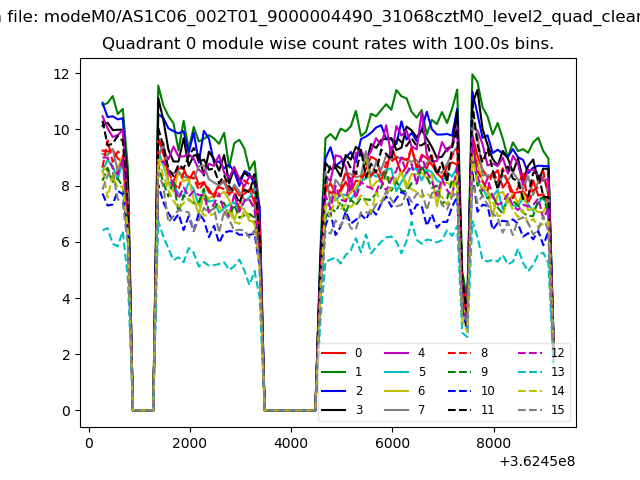 |
 |
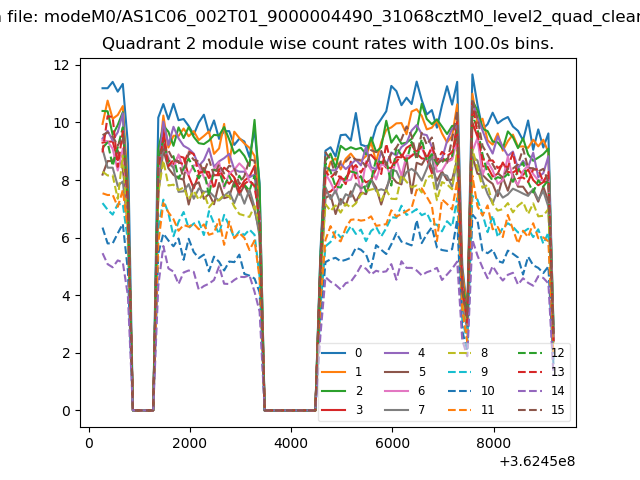
| Module-wise count rates for Quadrant B Data is divided into 100 sec bins |
 |
 |
| Module-wise count rates for Quadrant C Data is divided into 100 sec bins |
 |
 |
| Module-wise count rates for Quadrant D Data is divided into 100 sec bins |
 |
 |
| Parameter | Plot |
|---|---|
| CZT HV Monitor | 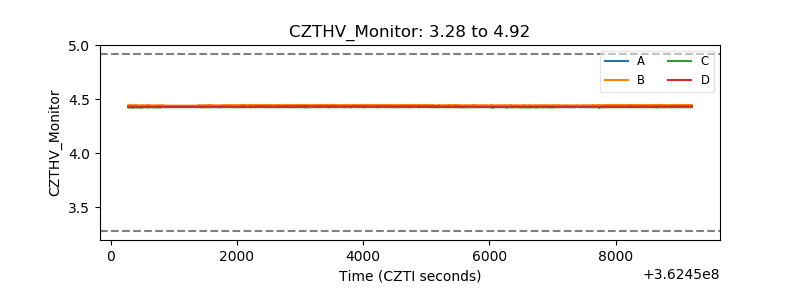 |
| D_VDD | 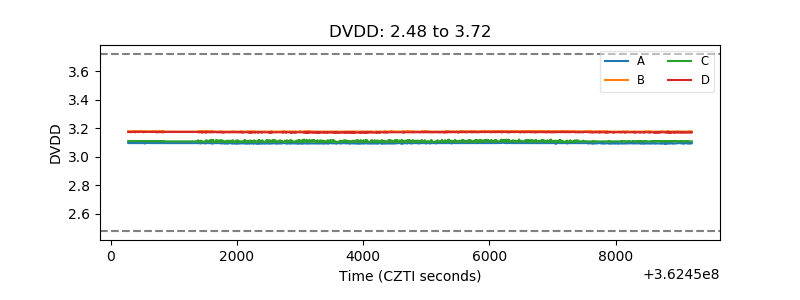 |
| Temperature 1 | 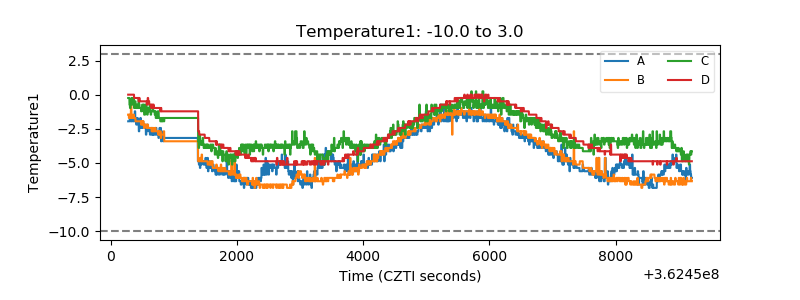 |
| Veto HV Monitor | 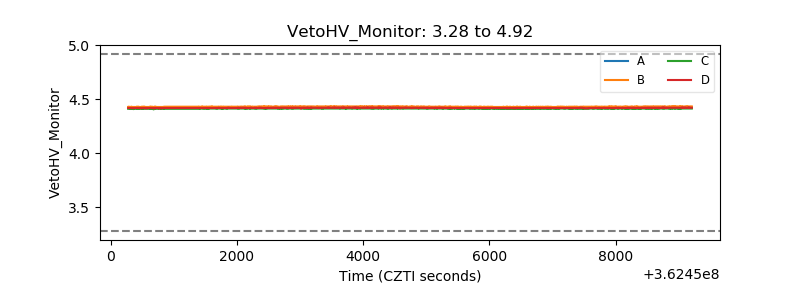 |
| Veto LLD | 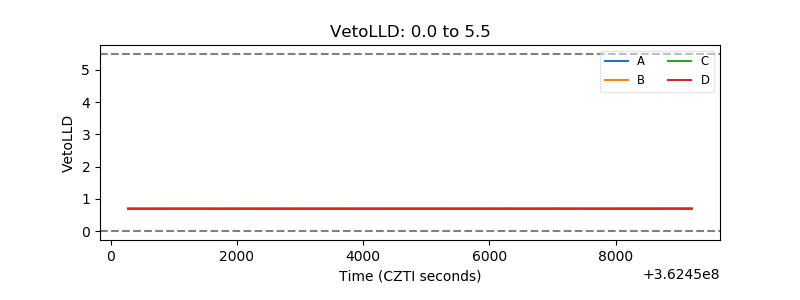 |
| Alpha Counter | 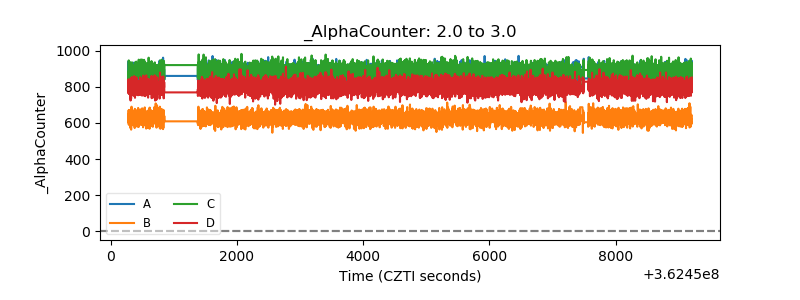 |
| _CPM_Rate | 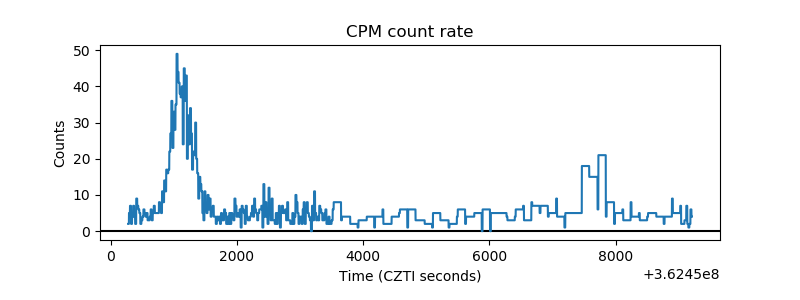 |
| CZT Counter | 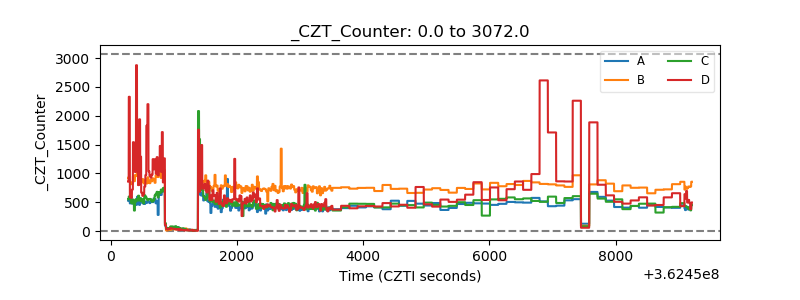 |
| +2.5 Volts monitor |  |
| +5 Volts monitor |  |
| _ROLL_ROT | 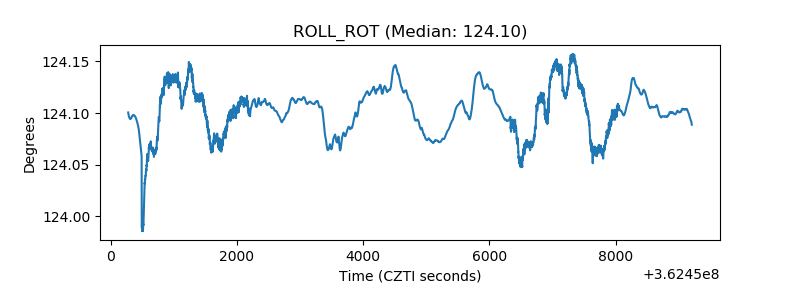 |
| _Roll_DEC | 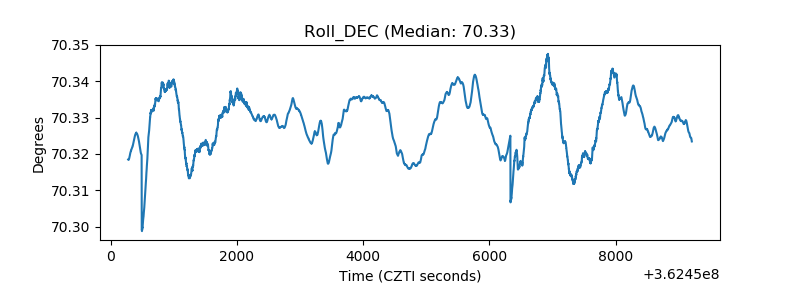 |
| _Roll_RA | 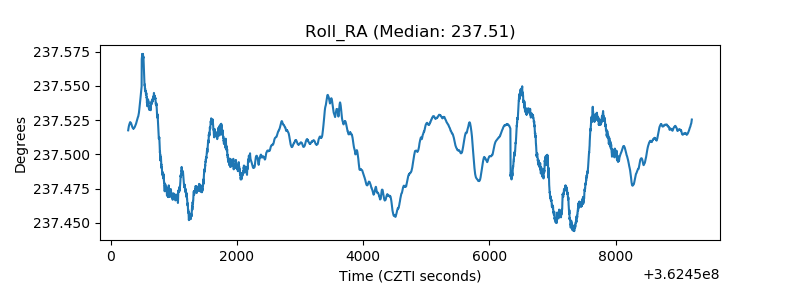 |
| Veto Counter | 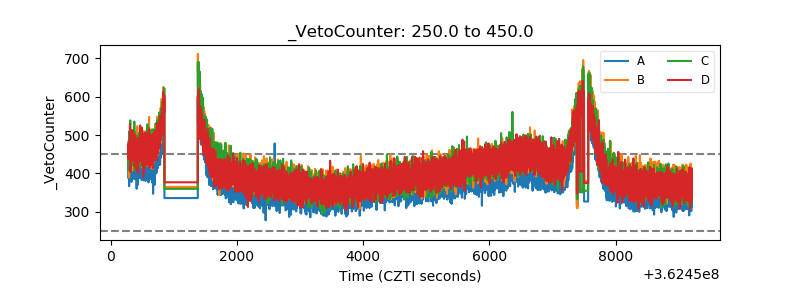 |